2. Qualitative concerns include fairness and the aesthetics of the
area in which waiting takes place.
3. Arrivals are governed by the size of the source population
(finite or infinite); the pattern of arrivals at the system (on a
schedule or randomly); and the behavior of the arrivals (joining
4. Measures of system performance:
◼ The average time each customer or object spends in the
5. Assumptions of the “basic” single-server model:
1. Arrivals are served on a first-come, first-served (FCFS)
basis, and every arrival waits to be served, regardless of
the length of the line or queue.
2. Arrivals are independent of preceding arrivals, but the
and come from an infinite population.
4. Service times vary from one customer to the next and are
independent of one another, but their average rate is
known.
5. Service times occur according to the negative exponential
distribution.
8. Ws is the time spent waiting plus being serviced, Wq is the
time spent waiting for service. Ws is therefore larger than Wq by
the amount of time spent on the service itself.
9. The first in, first out priority rule is often not valid. Examples
of when other rules are more appropriate include:
◼ An elevator (last in, first out)
◼ Popcorn stand at a theater (random)
Analytically, the performance measures take on negative signs,
11. If is only slightly smaller than : The denominator of the
performance measures all include ( − ). This value is now very
small, making the performance measures large. Average number
12. Finite waiting lines exist in:
◼ Barber shops (there are only a limited number of seats for
waiting because of space)
◼ A company that has five telephone receivers connected to a
single incoming line (multiserver, zero-length waiting line)
Copyright ©2014 Pearson Education, Inc.
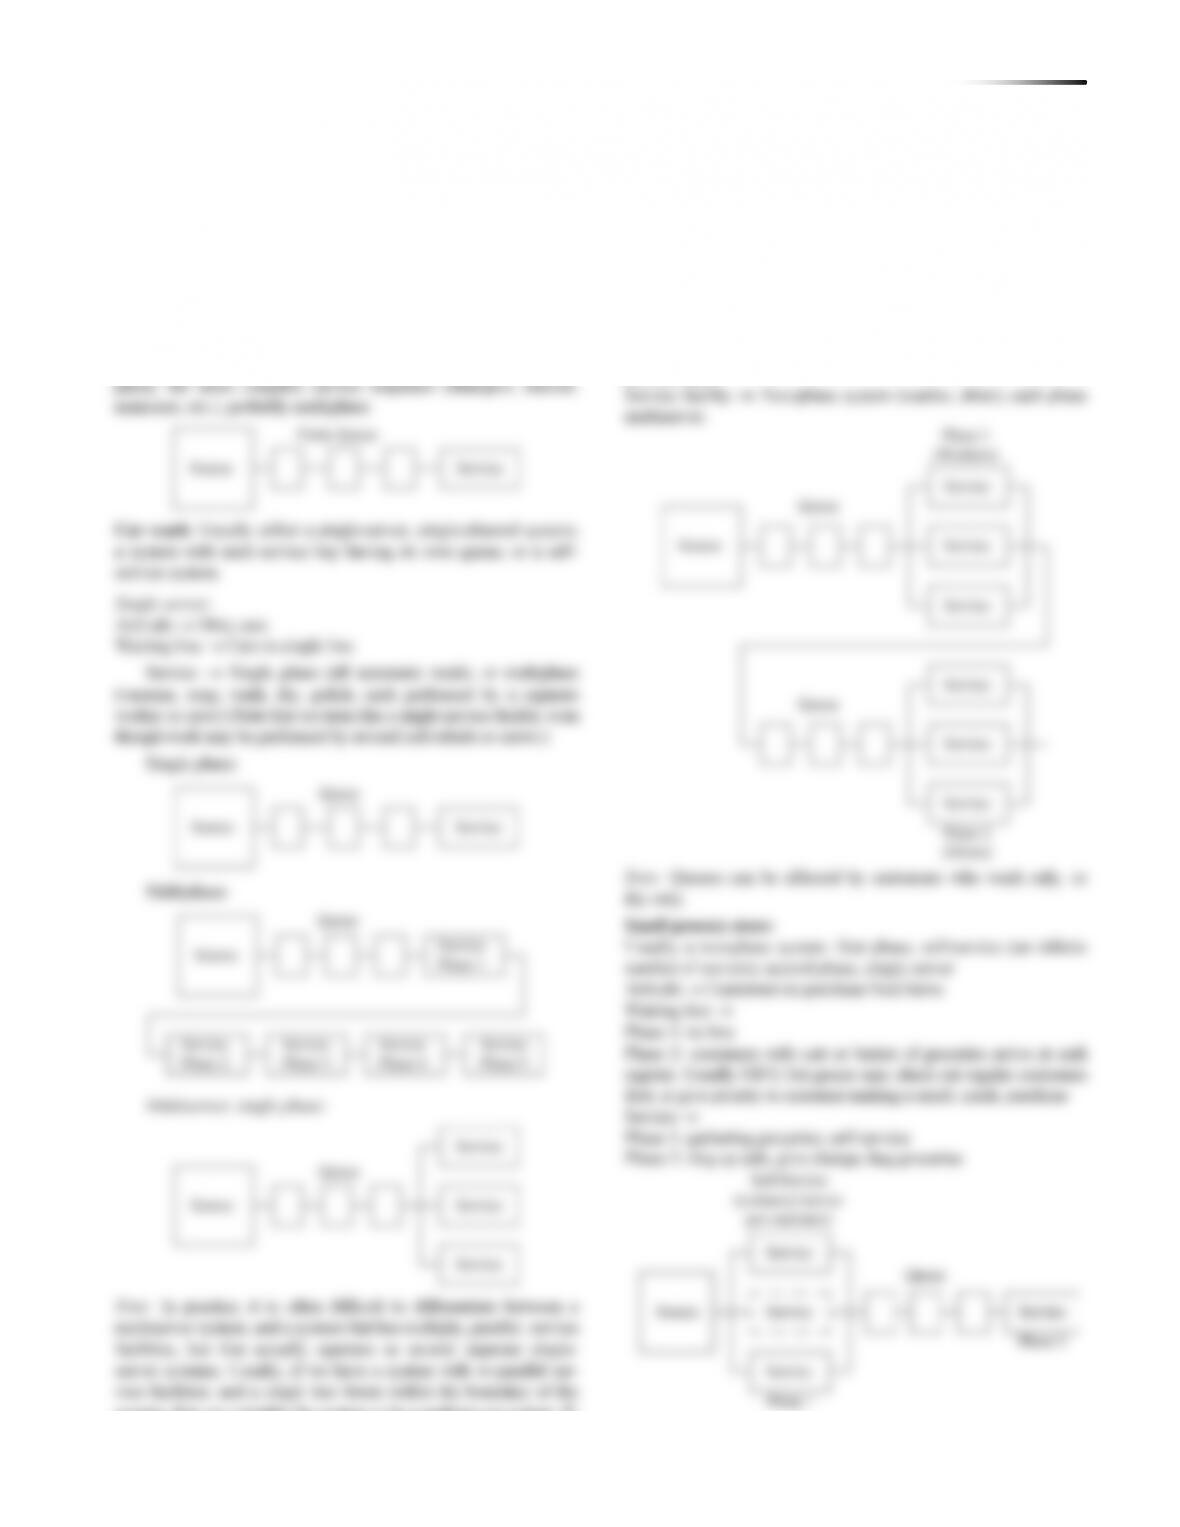
13. Barber shop:
Arrivals → Customers wanting haircuts
Waiting line → Seated customers; limited number of chairs;
priority is informal FIFO
Service → Haircut, shampoo, etc. For simple service, single
system, then we consider the system to be a multiserver system. If,
Laundromat:
Arrivals → Customers with loads of dirty laundry
Waiting line → Customers waiting in a group for the next availa-
ble washing machine or drier. Service on an informal FIFO
priority basis.
314 BUSINESS ANALYTICS MODULE D WA I T I N G – L I N E MO D E L S
14. Doctor’s offices generally attempt to schedule “group” arrivals
(10 patients on the hour, every hour), or uniform arrivals (1 pa-
tient every 15 minutes). Arrivals at an emergency center, on the
other hand, are typically Poisson.
15. Constant service time model will have an average queue
length and an average waiting time that is one-half that of the
same model with exponential service time.
16. This deals with the interesting issue of the value of waiting
time. Some service organizations place a very low value on your
time, leading to a good classroom discussion.
1. For how many minutes do customers wait before their muffler
installation begins?
40
2. How fast would the average installation (service) time have to
be to cut the waiting time in half?
16 minutes
3. Suppose the arrival rate increases by 10 percent to 2.2 cus-
4. How high would the wage rate need to be in order to make 1
mechanic the least costly option?
5. If a second mechanic is added, is it less costly to have the two
mechanics working separately or to have the two mechanics work
as a single team with a service rate that is twice as fast?
to 6 and doubling the wages, the single server cost is $112 +
$13.33, or $125.33. Therefore, having them work separately is
less costly.
the new compactor.
2. The service rate represents, of course, the design capacity.
What minimum rate is needed in order to save money with the
purchase of a new compactor?
10 trucks per hour or more.
END–OF-MODULE PROBLEMS
*Note that Active Models D.1-D.3 appear on our Web sites,
www.pearsonhighered.com/heizer and www.myomlab.com.
316 BUSINESS ANALYTICS MODULE D WA I T I N G – L I N E MO D E L S
0
2 2 2
24 24
(c) = 3.2 cars
( ) 30(30 24) 30(6)
24 24 2
(d) = hours 8min.
( ) 30(30 24) 30(6) 15
1
(e) 1 / 1 24 / 30 .20
5
24
(f) 3
q
q
L
W
P
= = =
−−
= = = =
−−
= − = − = =
==
12
1 1 2 1
4.80
05
(g) Probability( 2)
24 24
.640 .512 0.128
30 30
nn
n P P
++
==
= = −
= − = − =
(h) With a second server at the same
= 30 speed, Ws = .04 hours
= 2.38 minutes
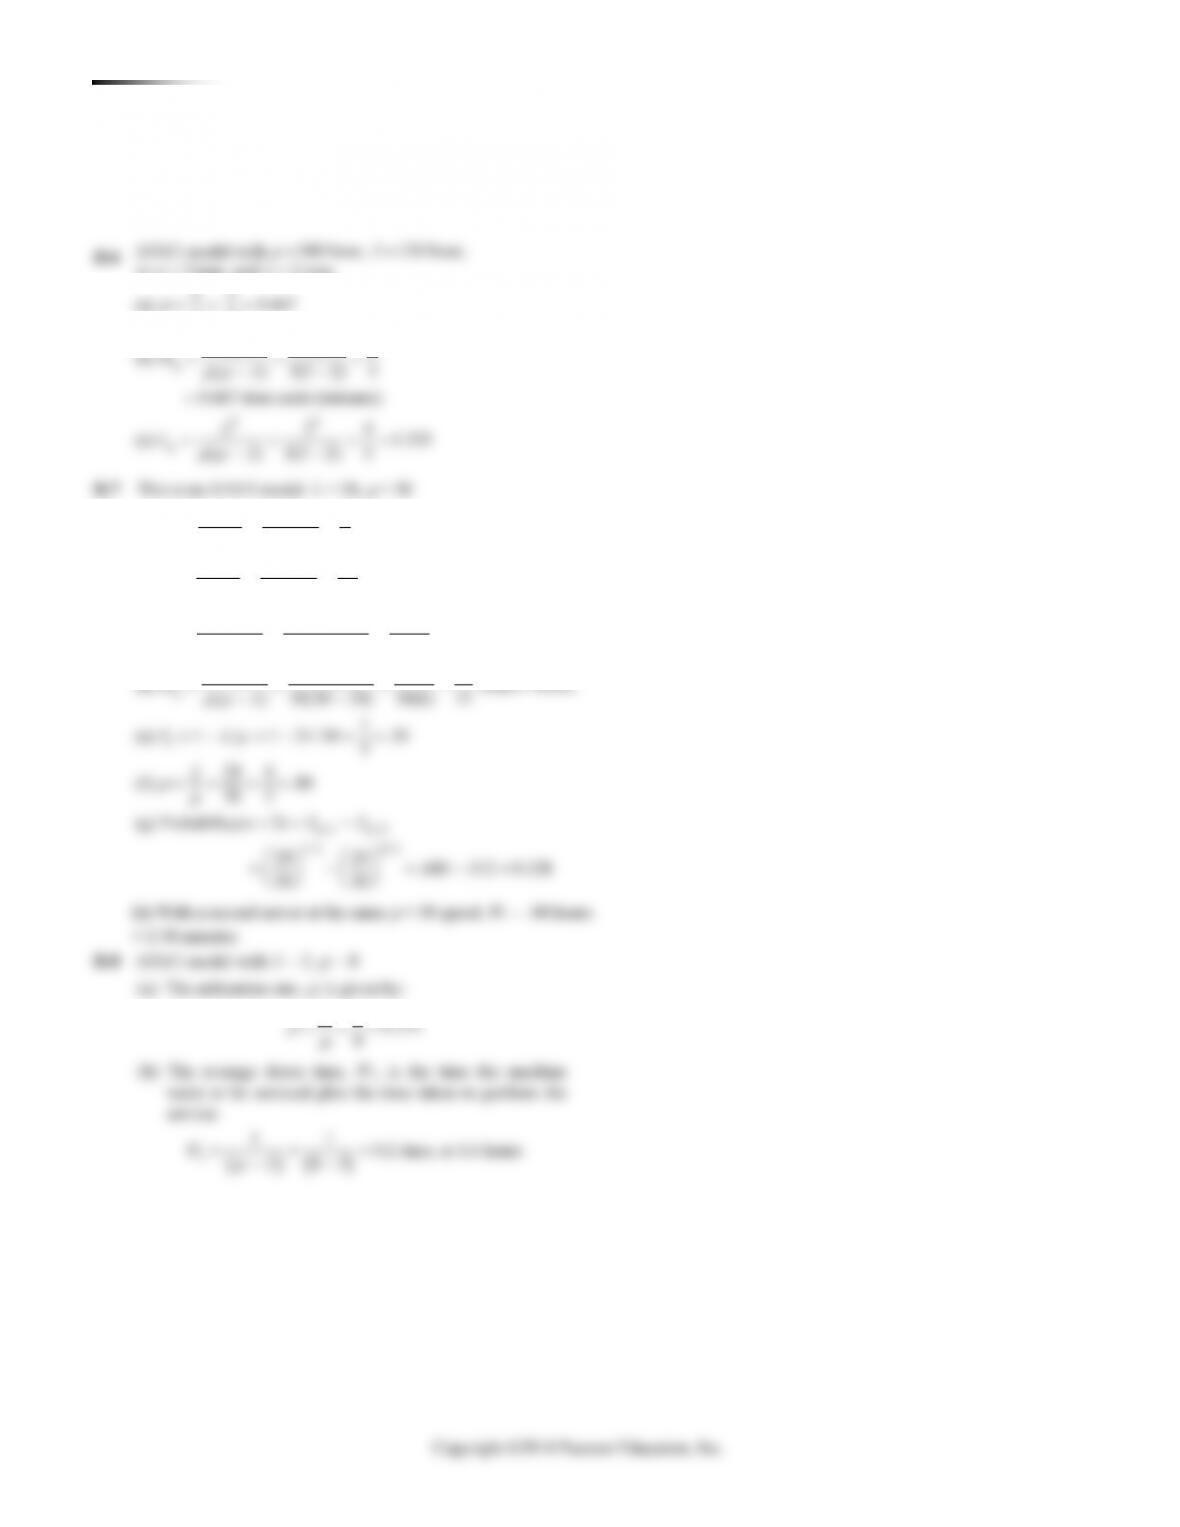
D.8 M/M/1 model with
= 3,
= 8
(a) The utilization rate,
, is given by:
30.375
8
= = =
(b) The average down time, Ws, is the time the machine
waits to be serviced plus the time taken to perform the
service.
( ) ( )
11
0.2 days, or 1.6 hours
83
s
W
= = =
−−
1 1 1
( ) (280 210) 70
0.014 hours in the line
0.014 hours 0.857 minutes 51.4 seconds
s
s
W
W
= = =
−−
=
= = =
(d) The average time spent by a patron waiting in line to
get a ticket, Wq, is given by:
210 210
( ) 280(280 210) 280 70
210 0.011 hours
19,600
0.64 minutes 38.6 seconds
q
W
= = =
− −
==
==
(e) The probability that there are more than two people in
the system, Pn > 2, is given by:
1
3
2
210 0.422
280
k
nk
n
P
P
+
=
==
The probability that there are more than three people in
the system, Pn > 3, is given by:
4
3
210 0.316
280
n
P
==
The probability that there are more than four people in
the system, Pn > 4, is given by:
5
4
210 0.237
280
n
P
==
D.11 This is an M/M/1 queue;
= 25/hr.; and
= 30/hr.
q
s
s
L
W
W
=−
=−
==
= = = =
−−
==
= = =
−−
2
2
(a) ()
25
30(30 25)
625
4.1667 students
150
1 1 1
(b) hr 12 min
30 25 5
(c) 25 / hr; 40 / hr.
1 1 1
hr, or 4 min
40 25 15
The new time is 4 min, a reduction of 8 min.
(d) This is an M/M/2 queue; = 25;
= 30.
Ws = 0.04 hr, or 2.4 min
22
30.225 machines waiting
( ) 8(8 3)
q
L
= = =
−−
(d) Probability that more than one machine is in the system:
12
1
39
, or 0.141
8 64
k
n k n
PP
+
= = = =
Probability that more than 2, 3, or 4 machines are in the
system:
3
2
4
3
5
4
3 27 0.053
8 512
3 81 0.020
8 4096
3 243 0.007
8 32,768
n
n
n
P
P
P
= = =
= = =
= = =
D.9 This is an M/M/1 model; = 10,
= 15
0
2 2 2
10
(a) ( ) 15(15 10)
10 2
0.1333 hours 8 min.
15(5) 15
10 10
(b) 1.333
( ) 15(15 10) 15(5)
1 1 1
(c) hours 12 min.
15 10 5
10 10
(d) 2 people in the system
15 10 5
(e) 1 /
q
q
s
s
W
L
W
L
P
==
−−
= = = =
= = = =
−−
= = = =
−−
= = = =
−−
=− 1 10 / 15 1 / 3= − =
(f ) This is an M/M/2 model; = 10,
= 15
(a) Wq = 0.0083 hours .5 min.
(b) Lq = 0.0833
(c) Ws = 0.075 hours 4.5 min.
(d) Ls = 0.75 (less than 1 person in the system)
(e) P0 = 0.5
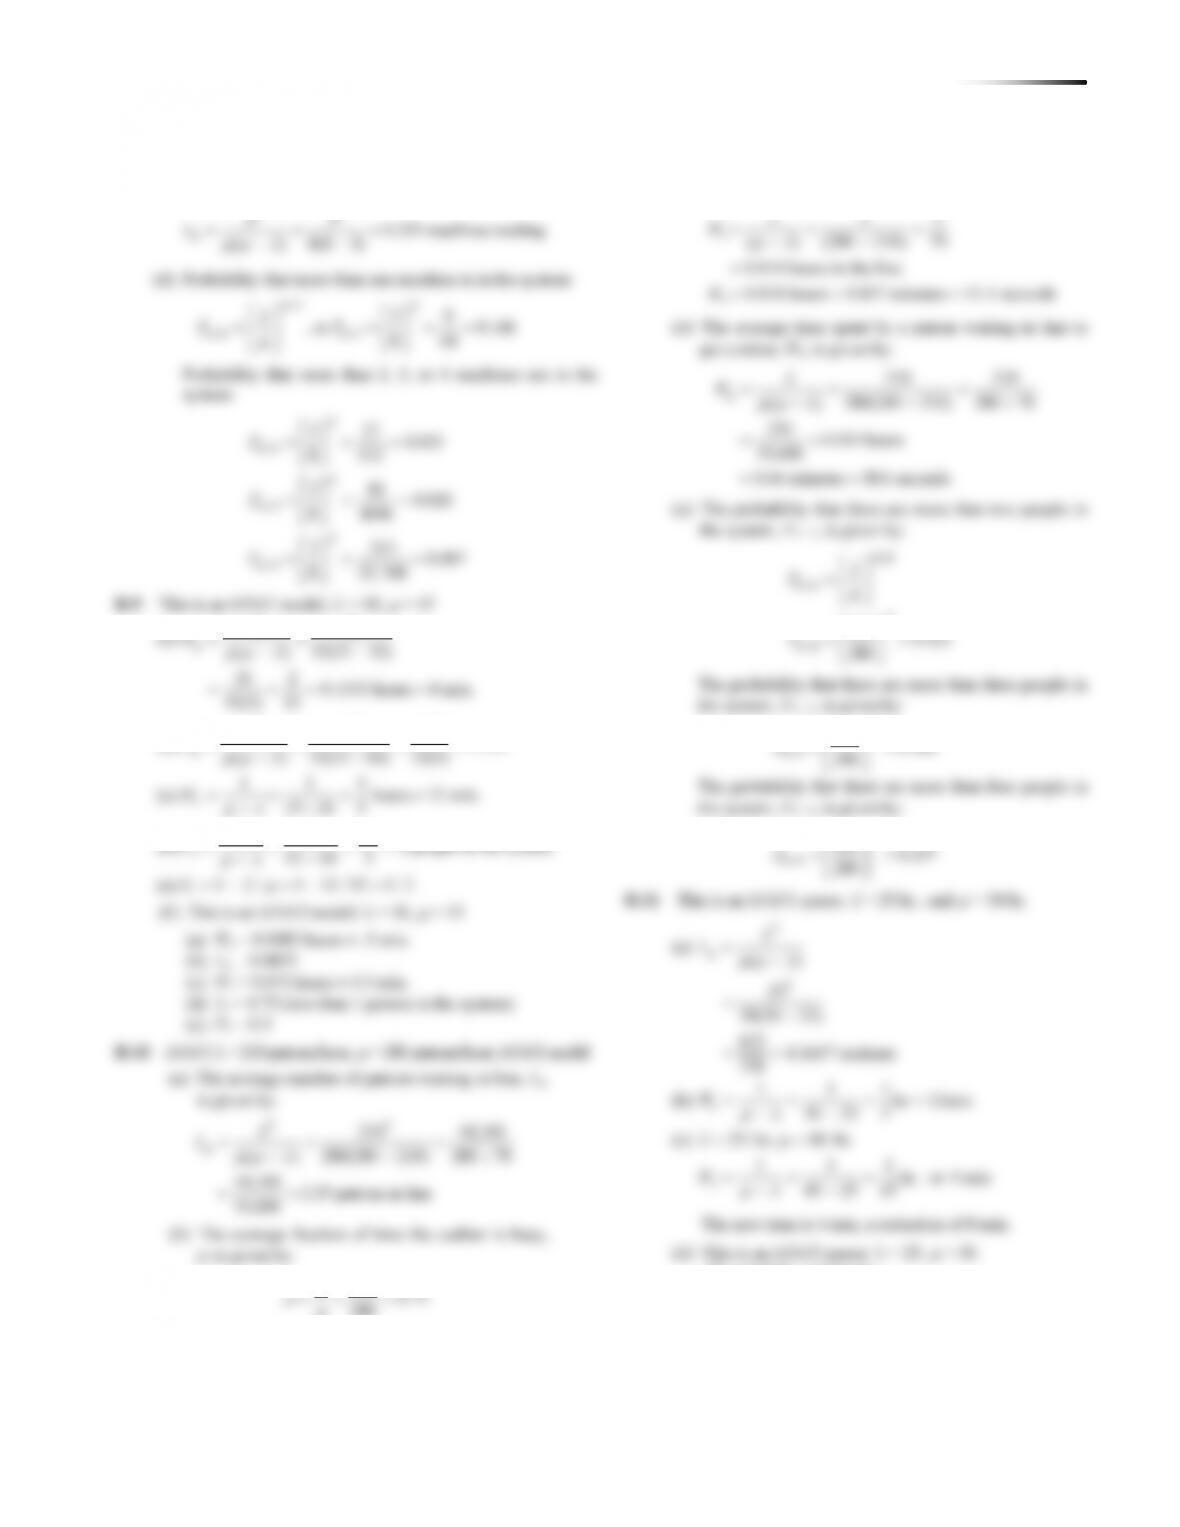
D.10 M/M/1 = 210 patrons/hour,
= 280 patrons/hour; M/M/1 model
(a) The average number of patrons waiting in line, Lq,
is given by:
22
210 44,100
( ) 280(280 210) 280 70
44,100 2.25 patrons in line
19,600
q
L
= = =
− −
==
(b) The average fraction of time the cashier is busy,
, is given by:
210 0.75
280
= = =
318 BUSINESS ANALYTICS MODULE D WA I T I N G – L I N E MO D E L S
30 30 6 trucks in the system
35 30 5
s
L
= = = =
−−
(b) The average time spent by a truck in the system, Ws, is
given by:
1 1 1 0.2 hours = 12 minutes
35 30 5
s
W
= = = =
−−
(c) The utilization rate for the bin area,
, is given by:
30 6 0.857
1
4
3
30 0.540
35
k
nk
n
P
P
+
=
==
Thus, the probability that there are more than three
trucks in the system is 0.540.
(e) Unloading cost:
hours trucks hours $
16 30 0.2 18
day hour truck hour
16 30 0.2 18 $1,728 / day
u
C=
= =
◼ Compute total cost with the second clerk
◼ Compare the two
Present total cost:
/ hour Service cost Waiting cost
$10 per hour
(12 calls per hour 0.267 hours
waiting per call $25 per hour)
10 (12 0.267 25)
10 80.1/ hour
t
C=+
=+
= +
=+
( )
( )( )
01
11
!!
0
0 1 2 2 15
1 12 1 12 1 12
0! 15 1 15 1 2 15 2 15 12
22 15
4 1 4
5 2 5 30 12
16 30
41
5 2 25 18
1
1
1
1
1
1
1
nM nM
M
n M M
n
P
=−
−
=
−
−
=
+
=
++
=
++
=++
Copyright ©2014 Pearson Education, Inc.
13. Barber shop:
Arrivals → Customers wanting haircuts
Waiting line → Seated customers; limited number of chairs;
priority is informal FIFO
Service → Haircut, shampoo, etc. For simple service, single
system, then we consider the system to be a multiserver system. If,
Laundromat:
Arrivals → Customers with loads of dirty laundry
Waiting line → Customers waiting in a group for the next availa-
ble washing machine or drier. Service on an informal FIFO
priority basis.
314 BUSINESS ANALYTICS MODULE D WA I T I N G – L I N E MO D E L S
14. Doctor’s offices generally attempt to schedule “group” arrivals
(10 patients on the hour, every hour), or uniform arrivals (1 pa-
tient every 15 minutes). Arrivals at an emergency center, on the
other hand, are typically Poisson.
15. Constant service time model will have an average queue
length and an average waiting time that is one-half that of the
same model with exponential service time.
16. This deals with the interesting issue of the value of waiting
time. Some service organizations place a very low value on your
time, leading to a good classroom discussion.
1. For how many minutes do customers wait before their muffler
installation begins?
40
2. How fast would the average installation (service) time have to
be to cut the waiting time in half?
16 minutes
3. Suppose the arrival rate increases by 10 percent to 2.2 cus-
4. How high would the wage rate need to be in order to make 1
mechanic the least costly option?
5. If a second mechanic is added, is it less costly to have the two
mechanics working separately or to have the two mechanics work
as a single team with a service rate that is twice as fast?
to 6 and doubling the wages, the single server cost is $112 +
$13.33, or $125.33. Therefore, having them work separately is
less costly.
the new compactor.
2. The service rate represents, of course, the design capacity.
What minimum rate is needed in order to save money with the
purchase of a new compactor?
10 trucks per hour or more.
END–OF-MODULE PROBLEMS
*Note that Active Models D.1-D.3 appear on our Web sites,
www.pearsonhighered.com/heizer and www.myomlab.com.
316 BUSINESS ANALYTICS MODULE D WA I T I N G – L I N E MO D E L S
0
2 2 2
24 24
(c) = 3.2 cars
( ) 30(30 24) 30(6)
24 24 2
(d) = hours 8min.
( ) 30(30 24) 30(6) 15
1
(e) 1 / 1 24 / 30 .20
5
24
(f) 3
q
q
L
W
P
= = =
−−
= = = =
−−
= − = − = =
==
12
1 1 2 1
4.80
05
(g) Probability( 2)
24 24
.640 .512 0.128
30 30
nn
n P P
++
==
= = −
= − = − =
(h) With a second server at the same
= 30 speed, Ws = .04 hours
= 2.38 minutes
D.8 M/M/1 model with
= 3,
= 8
(a) The utilization rate,
, is given by:
30.375
8
= = =
(b) The average down time, Ws, is the time the machine
waits to be serviced plus the time taken to perform the
service.
( ) ( )
11
0.2 days, or 1.6 hours
83
s
W
= = =
−−
1 1 1
( ) (280 210) 70
0.014 hours in the line
0.014 hours 0.857 minutes 51.4 seconds
s
s
W
W
= = =
−−
=
= = =
(d) The average time spent by a patron waiting in line to
get a ticket, Wq, is given by:
210 210
( ) 280(280 210) 280 70
210 0.011 hours
19,600
0.64 minutes 38.6 seconds
q
W
= = =
− −
==
==
(e) The probability that there are more than two people in
the system, Pn > 2, is given by:
1
3
2
210 0.422
280
k
nk
n
P
P
+
=
==
The probability that there are more than three people in
the system, Pn > 3, is given by:
4
3
210 0.316
280
n
P
==
The probability that there are more than four people in
the system, Pn > 4, is given by:
5
4
210 0.237
280
n
P
==
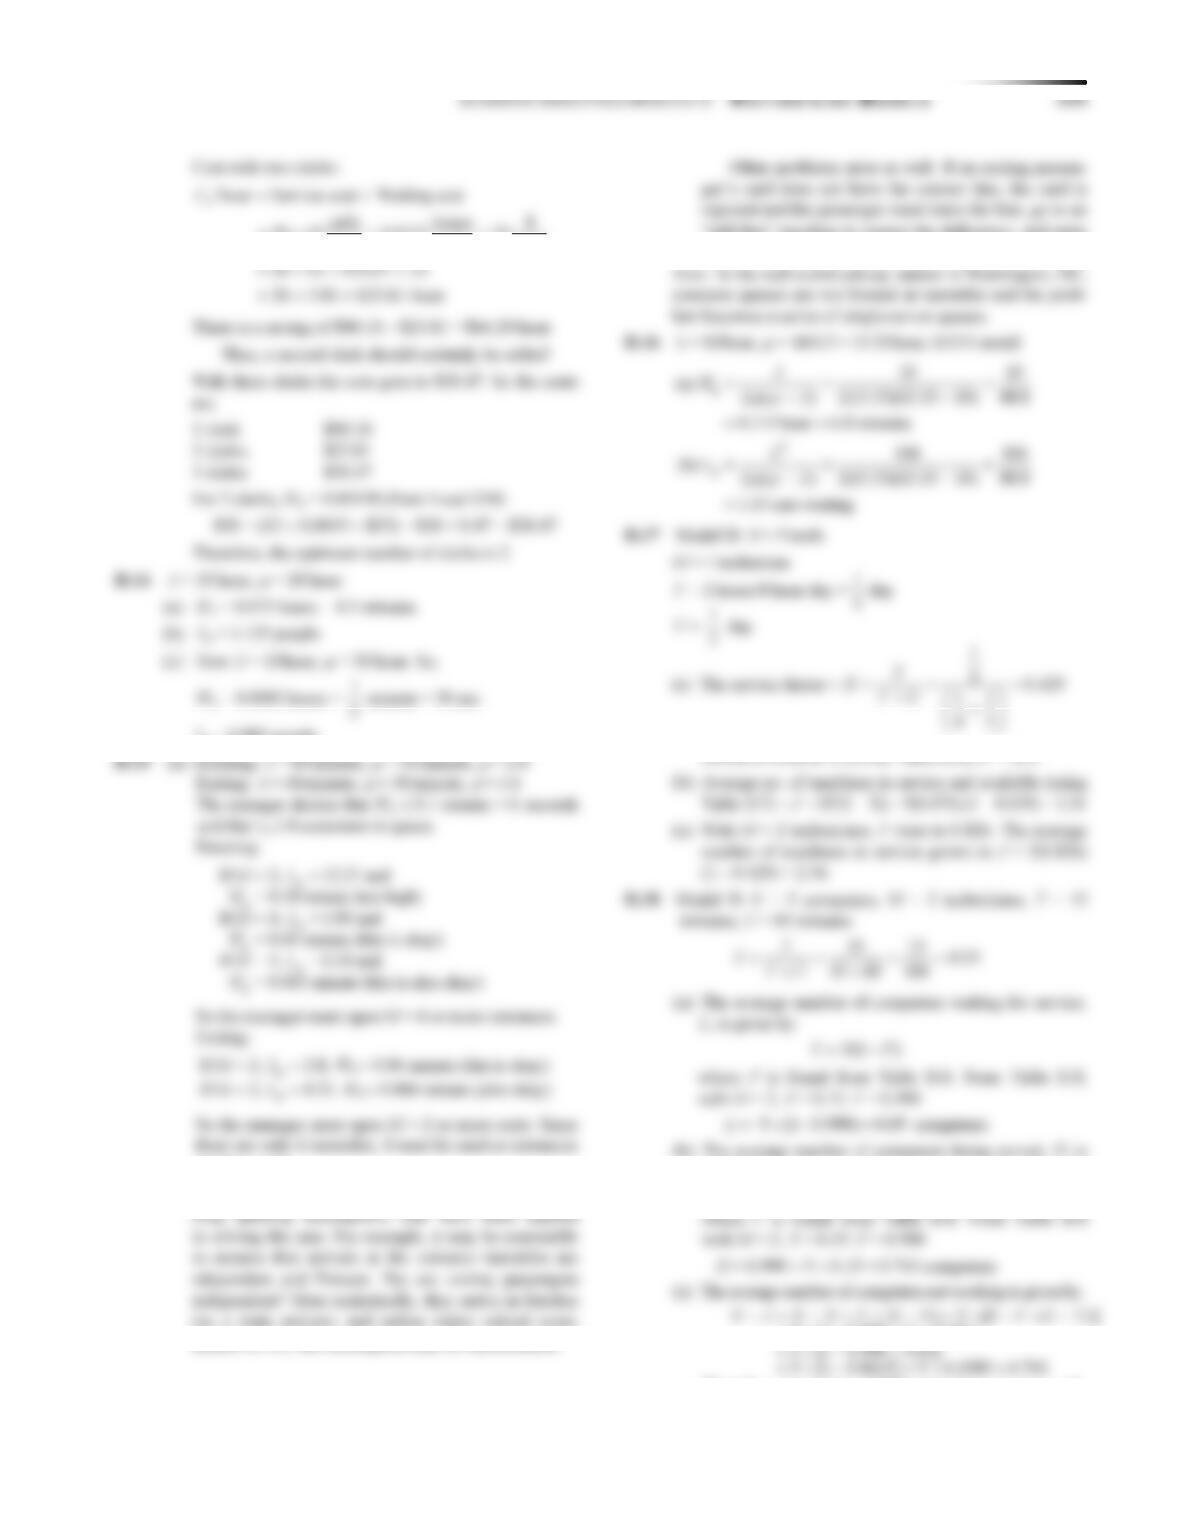
D.11 This is an M/M/1 queue;
= 25/hr.; and
= 30/hr.
q
s
s
L
W
W
=−
=−
==
= = = =
−−
==
= = =
−−
2
2
(a) ()
25
30(30 25)
625
4.1667 students
150
1 1 1
(b) hr 12 min
30 25 5
(c) 25 / hr; 40 / hr.
1 1 1
hr, or 4 min
40 25 15
The new time is 4 min, a reduction of 8 min.
(d) This is an M/M/2 queue; = 25;
= 30.
Ws = 0.04 hr, or 2.4 min
22
30.225 machines waiting
( ) 8(8 3)
q
L
= = =
−−
(d) Probability that more than one machine is in the system:
12
1
39
, or 0.141
8 64
k
n k n
PP
+
= = = =
Probability that more than 2, 3, or 4 machines are in the
system:
3
2
4
3
5
4
3 27 0.053
8 512
3 81 0.020
8 4096
3 243 0.007
8 32,768
n
n
n
P
P
P
= = =
= = =
= = =
D.9 This is an M/M/1 model; = 10,
= 15
0
2 2 2
10
(a) ( ) 15(15 10)
10 2
0.1333 hours 8 min.
15(5) 15
10 10
(b) 1.333
( ) 15(15 10) 15(5)
1 1 1
(c) hours 12 min.
15 10 5
10 10
(d) 2 people in the system
15 10 5
(e) 1 /
q
q
s
s
W
L
W
L
P
==
−−
= = = =
= = = =
−−
= = = =
−−
= = = =
−−
=− 1 10 / 15 1 / 3= − =
(f ) This is an M/M/2 model; = 10,
= 15
(a) Wq = 0.0083 hours .5 min.
(b) Lq = 0.0833
(c) Ws = 0.075 hours 4.5 min.
(d) Ls = 0.75 (less than 1 person in the system)
(e) P0 = 0.5
D.10 M/M/1 = 210 patrons/hour,
= 280 patrons/hour; M/M/1 model
(a) The average number of patrons waiting in line, Lq,
is given by:
22
210 44,100
( ) 280(280 210) 280 70
44,100 2.25 patrons in line
19,600
q
L
= = =
− −
==
(b) The average fraction of time the cashier is busy,
, is given by:
210 0.75
280
= = =
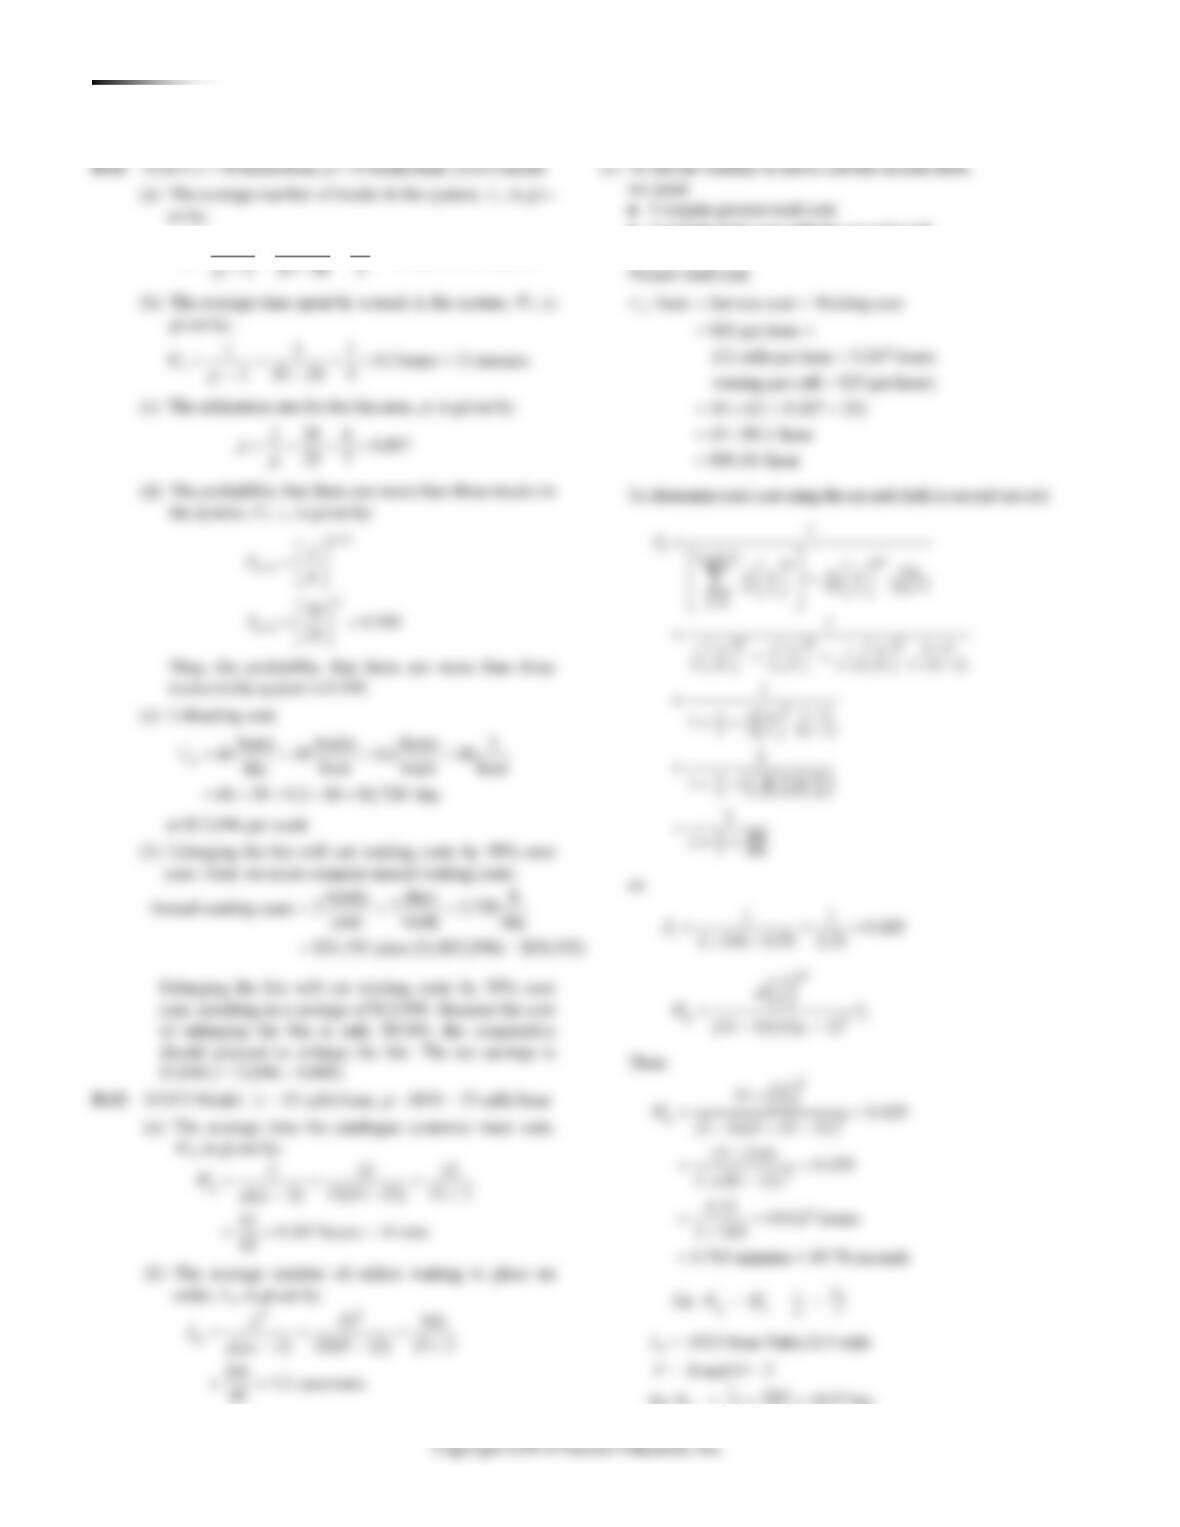
318 BUSINESS ANALYTICS MODULE D WA I T I N G – L I N E MO D E L S
30 30 6 trucks in the system
35 30 5
s
L
= = = =
−−
(b) The average time spent by a truck in the system, Ws, is
given by:
1 1 1 0.2 hours = 12 minutes
35 30 5
s
W
= = = =
−−
(c) The utilization rate for the bin area,
, is given by:
30 6 0.857
1
4
3
30 0.540
35
k
nk
n
P
P
+
=
==
Thus, the probability that there are more than three
trucks in the system is 0.540.
(e) Unloading cost:
hours trucks hours $
16 30 0.2 18
day hour truck hour
16 30 0.2 18 $1,728 / day
u
C=
= =
◼ Compute total cost with the second clerk
◼ Compare the two
Present total cost:
/ hour Service cost Waiting cost
$10 per hour
(12 calls per hour 0.267 hours
waiting per call $25 per hour)
10 (12 0.267 25)
10 80.1/ hour
t
C=+
=+
= +
=+
( )
( )( )
01
11
!!
0
0 1 2 2 15
1 12 1 12 1 12
0! 15 1 15 1 2 15 2 15 12
22 15
4 1 4
5 2 5 30 12
16 30
41
5 2 25 18
1
1
1
1
1
1
1
nM nM
M
n M M
n
P
=−
−
=
−
−
=
+
=
++
=
++
=++