C
B U S I N E S S A N A L Y T I C S MOD U L E
1. Three information needs of the model: the origin points and
the capacity or supply per period at each; the destination points
and the demand per period at each; and the cost of shipping one
2. Steps in the intuitive method are:
◼ Step 1: Identify the cell with the lowest cost. Break any
ties for the lowest cost arbitrarily.
◼ Step 2: Allocate as many units as possible to that cell with-
3. The three steps in the northwest corner method are:
◼ ■Step 1: Exhaust the supply of each row before moving
down to the next row.
◼ Step 2: Exhaust the demand requirements of each column
4. An optimal solution has been reached when all improvement
indices (profits) are non-negative (non–positive).
5. The intuitive method will usually provide a better initial
solution than the northwest corner solution, but neither suggests
an optimal solution.
6. The number of cells used is m + n – 1; the number of possible
routes available is m n. Example: for a 2 3 problem, 4 of
6 routes will be used, for a 5 6 problem, 10 of 30 routes will
be used. (m = rows, n = columns)
7. Nothing prohibits the model from applying over short dis-
tances. The three assumptions do not address issues of scale. An
office could easily offer several sources of shipments, as well as
8. A “northeast corner” rule would be directly analogous to the
northwest corner rule, but it would simply begin in the upper-right
corner instead of the upper-left corner. This initial solution is
degenerate because only four squares (instead of the expected
9. Total supply is not equal to total demand in an unbalanced
transportation problem. Such a problem can be balanced by adding
a dummy row (supply demand) or column (demand supply).
10. Solutions must use m + n − 1 cells, where m = number of
rows and n = number of columns.
11. A negative index represents the amount by which total
transportation costs could be decreased if one unit of product were
shipped by the source–destination combination.
12. Production costs can be added to transportation costs in each
source, and the problem can then be solved as usual.
13. Degeneracy means there is no closed path from any unused
square back to the original unused square via squares that are
currently being used. Special techniques are needed to compute
the improvement indices.
Mexico City
50
50
Detroit
30
30
Ottawa
40
Total cost of N.W. corner method = $300 + 900 + 390 + 570
+ 960 = $3,120.
(b) Intuitive lowest-cost starting point:
Mexico City
50
50
Detroit
40
20
Ottawa
40
Total cost of intuitive method = $300 + 400 + 520 + 380
+ 400 = $2,000.
(c) Stepping-stone method:
Mexico City
30
70
Detroit
20
40
40
Multiple optimal solutions exist


296 BUSINESS ANALYTICS MODULE C TR A N S P O R T A T I O N MO D E L S
C.2
X
50
50
100
Y
30
20
50
Z
50
25
75
Demand
50
80
70
25
225
Cost = $2,670 (note the dummy is needed to balance).
(b) Intuitive lowest-cost approach:
X
50
30
20
100
Y
50
50
Z
50
25
75
Demand
50
80
70
25
225
An alternate least-cost solution is :
X–B = 5, X –Dummy =25, Z–B =.75, and Z–Dummy = 0.
Cost = $2,630 (note the dummy is needed to balance).
Intuitive approach yields a better starting point.
X
50
50
Y
50
Z
30
20
25
C.4 The only cell with a negative cost improvement index is
Houston–Miami. It achieves a –1. Allocate 10 to that cell. The
result is:
Houston
0
0
10
St. Louis
20
0
0
Chicago
0
20
10
Total cost = $170
C.5 The optimal cost = $14,700


298 BUSINESS ANALYTICS MODULE C TR A N S P O R T A T I O N MO D E L S
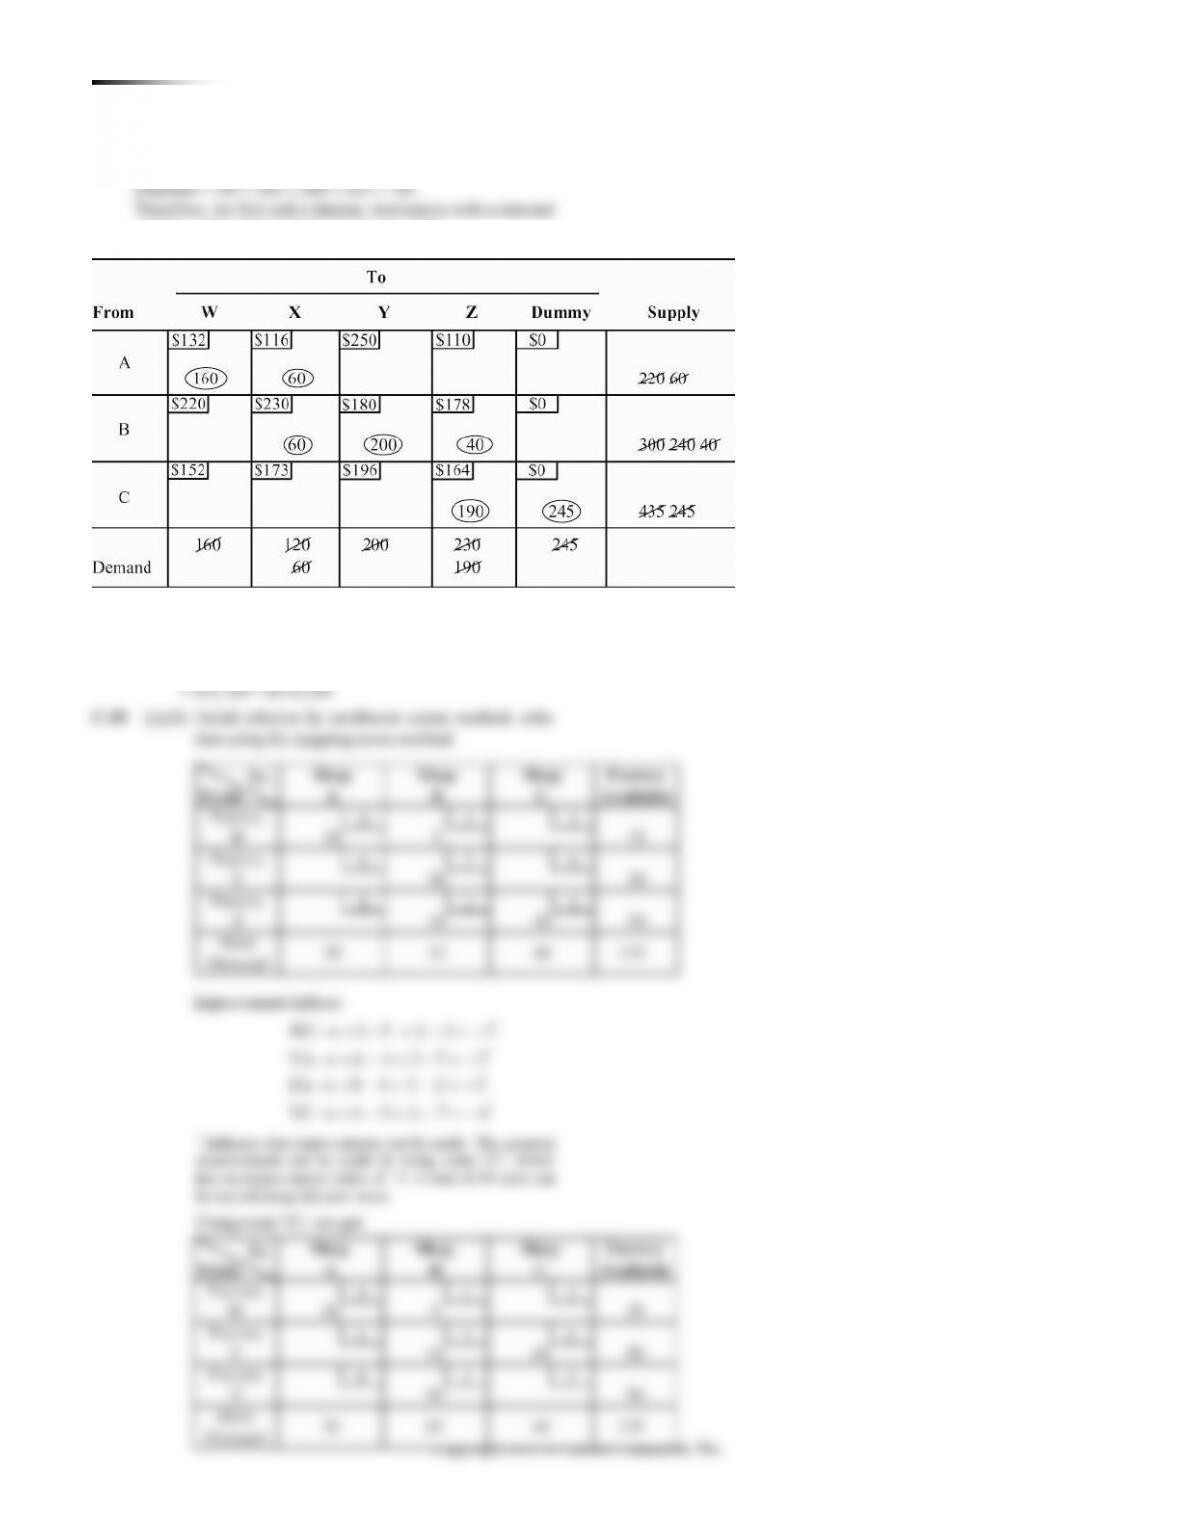
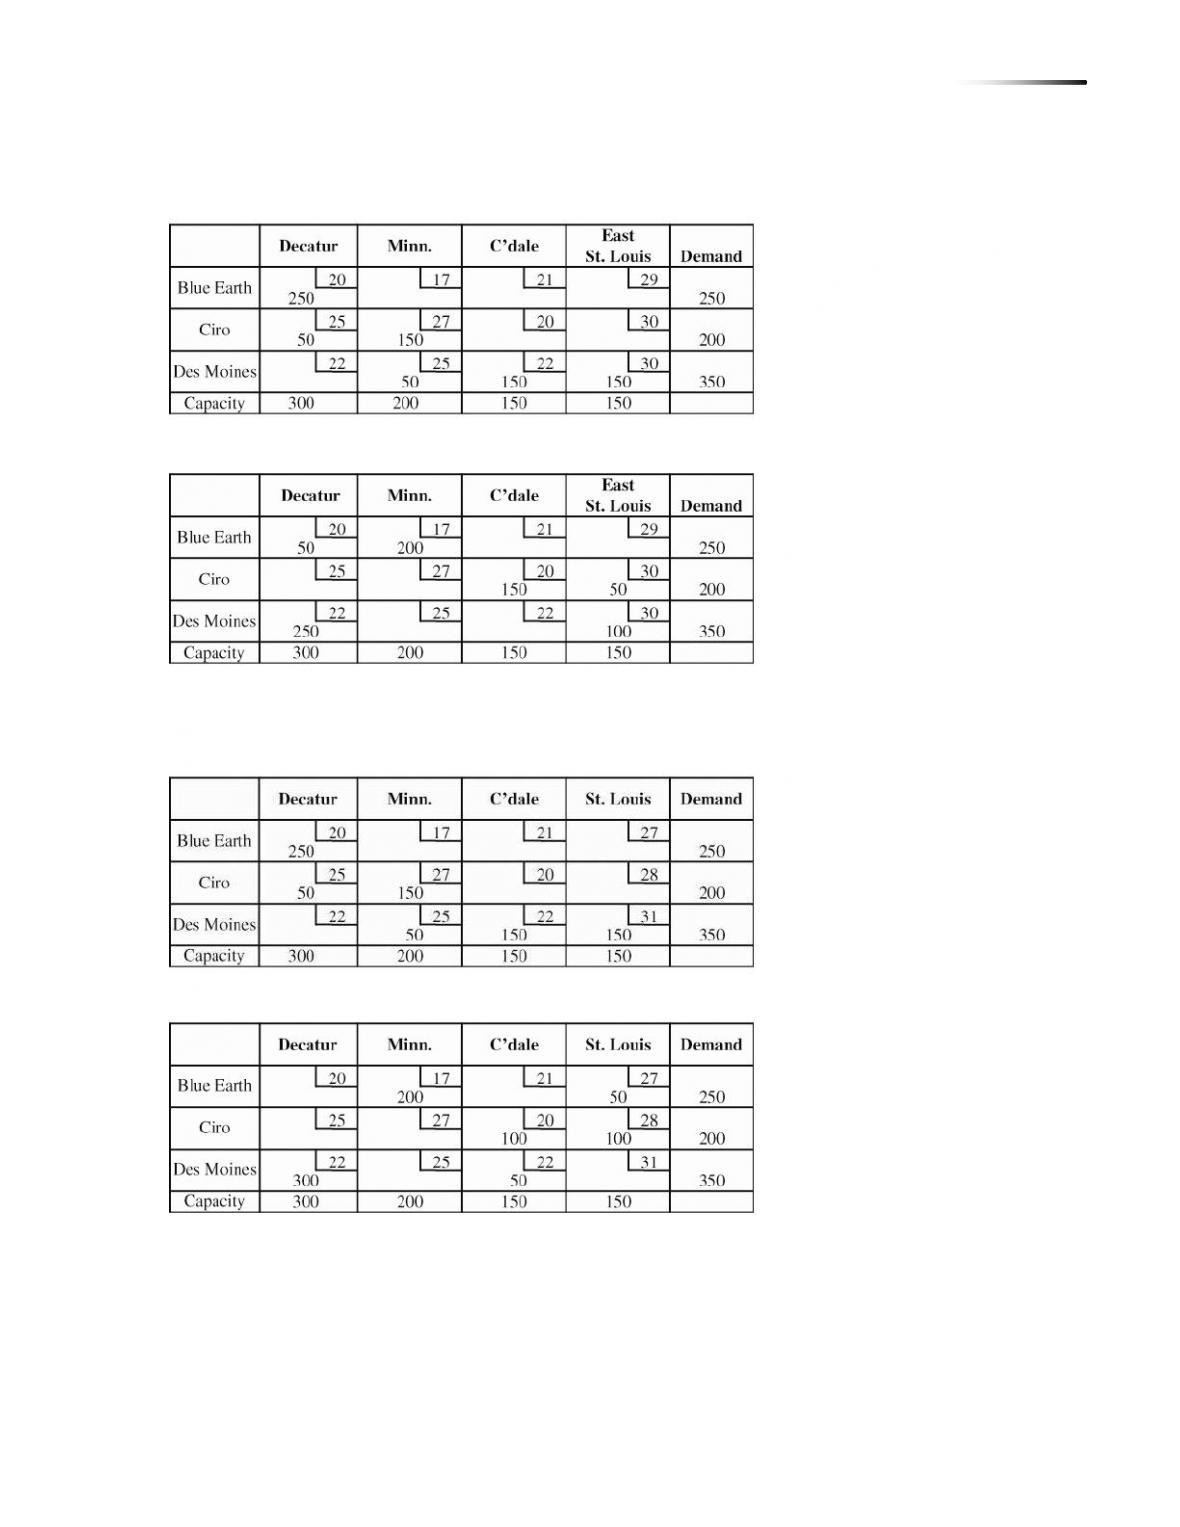
C.9 Supply = 220 + 300 + 435 = 955
of 955 – 710 = 245 and shipping costs of $0.
Cost = $132(160) + $116(60) + $230(60) + $180(200)
+ $178(40) + $164(190)
= $21,120 + 6,960 + $13,800 + $36,000 + $7,120
WC 3 5 2 3 3
YA 6 4 3 7 2
ZA 8 4 3 2 5
YC 6 5 2 7 4
→ + − + − = −
→ + − + − = −
→ + − + − = +
→ + − + − = −


WC 3 6 6 4 1
YB 7 6 4 3 2
ZA 8 4 3 2 5
ZC 5 2 3 4 6 6 2
→ + − + − = −
→ + − + − = +
→ + − + − = +
WA 4 3 6 6 1
YB 7 3 3 6 1
ZA 8 6 6 3 3 2 6
ZC 5 2 3 3 3
→ + − + − = +
→ + − + − = +
→ + − + − + − = +
WC 3 6 7 3 1
YA 6 4 3 7 2
ZA 8 4 3 2 5
ZC 5 2 7 6 4
→ + − + − = +
→ + − + − = −
→ + − + − = +

300 BUSINESS ANALYTICS MODULE C TR A N S P O R T A T I O N MO D E L S
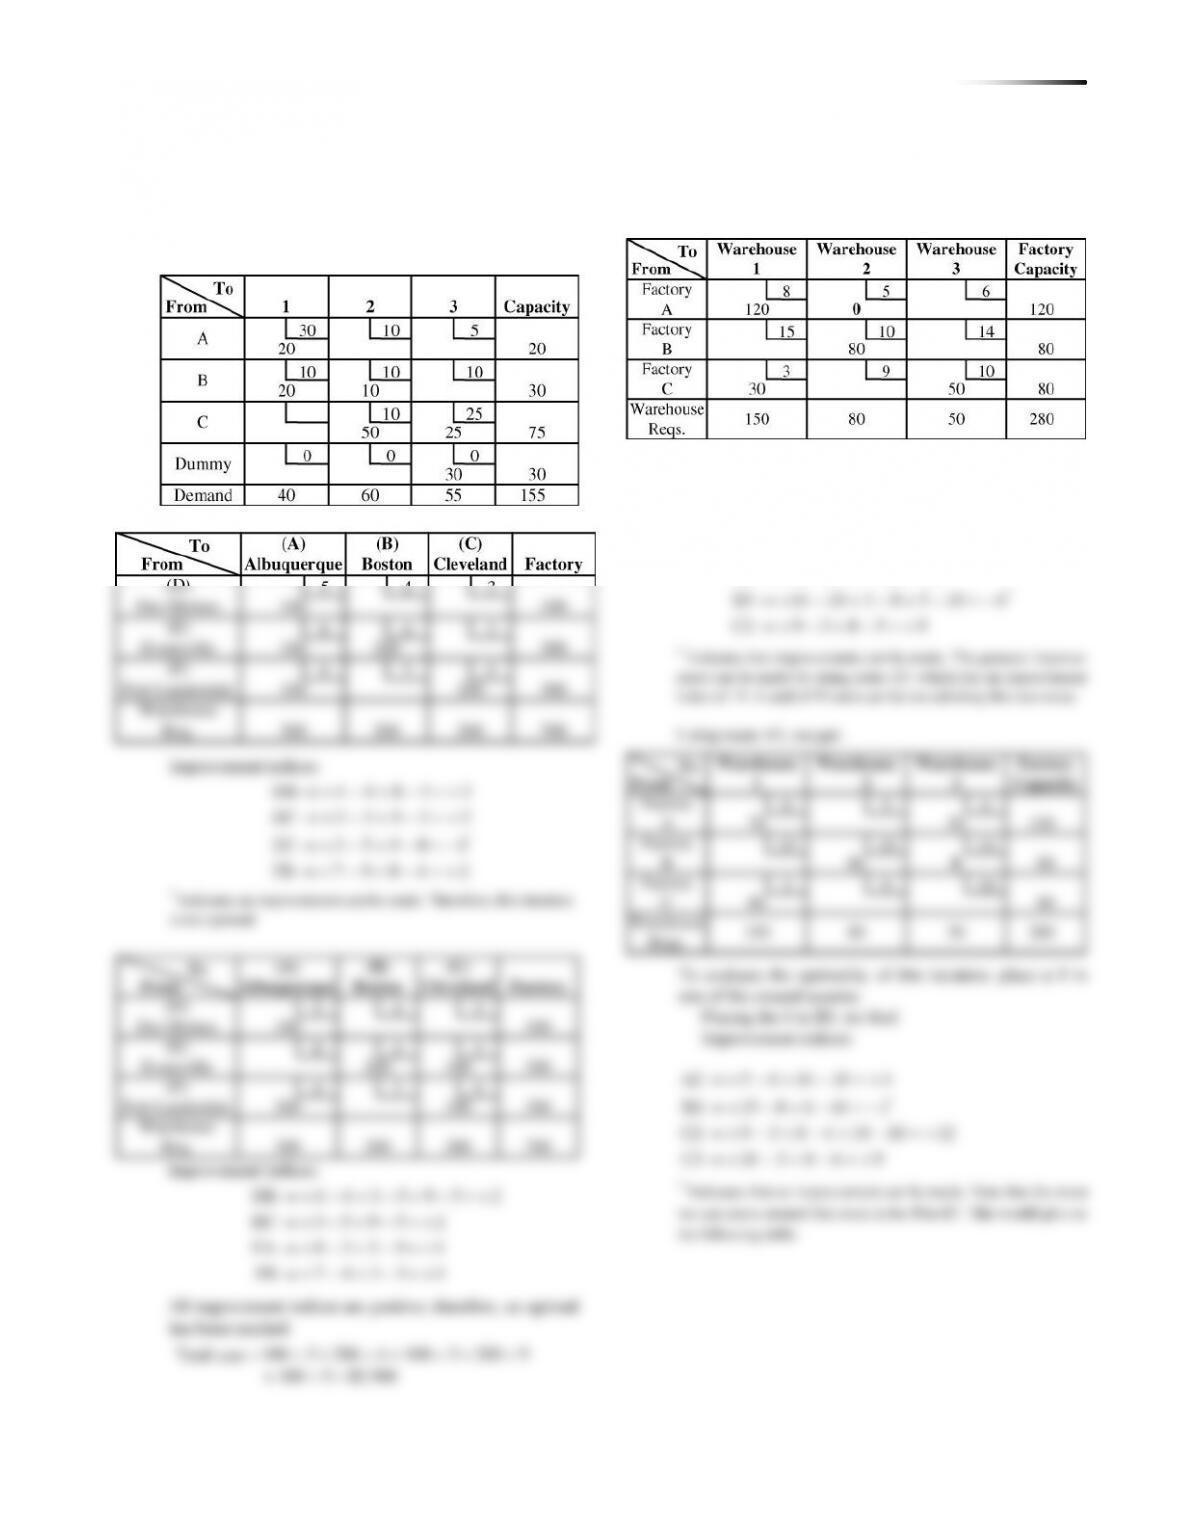
C.11 Solve two separate transportation problems. One will
include Philadelphia and the other will include Seattle. In both
cases, we need a dummy destination.


302 BUSINESS ANALYTICS MODULE C TR A N S P O R T A T I O N MO D E L S
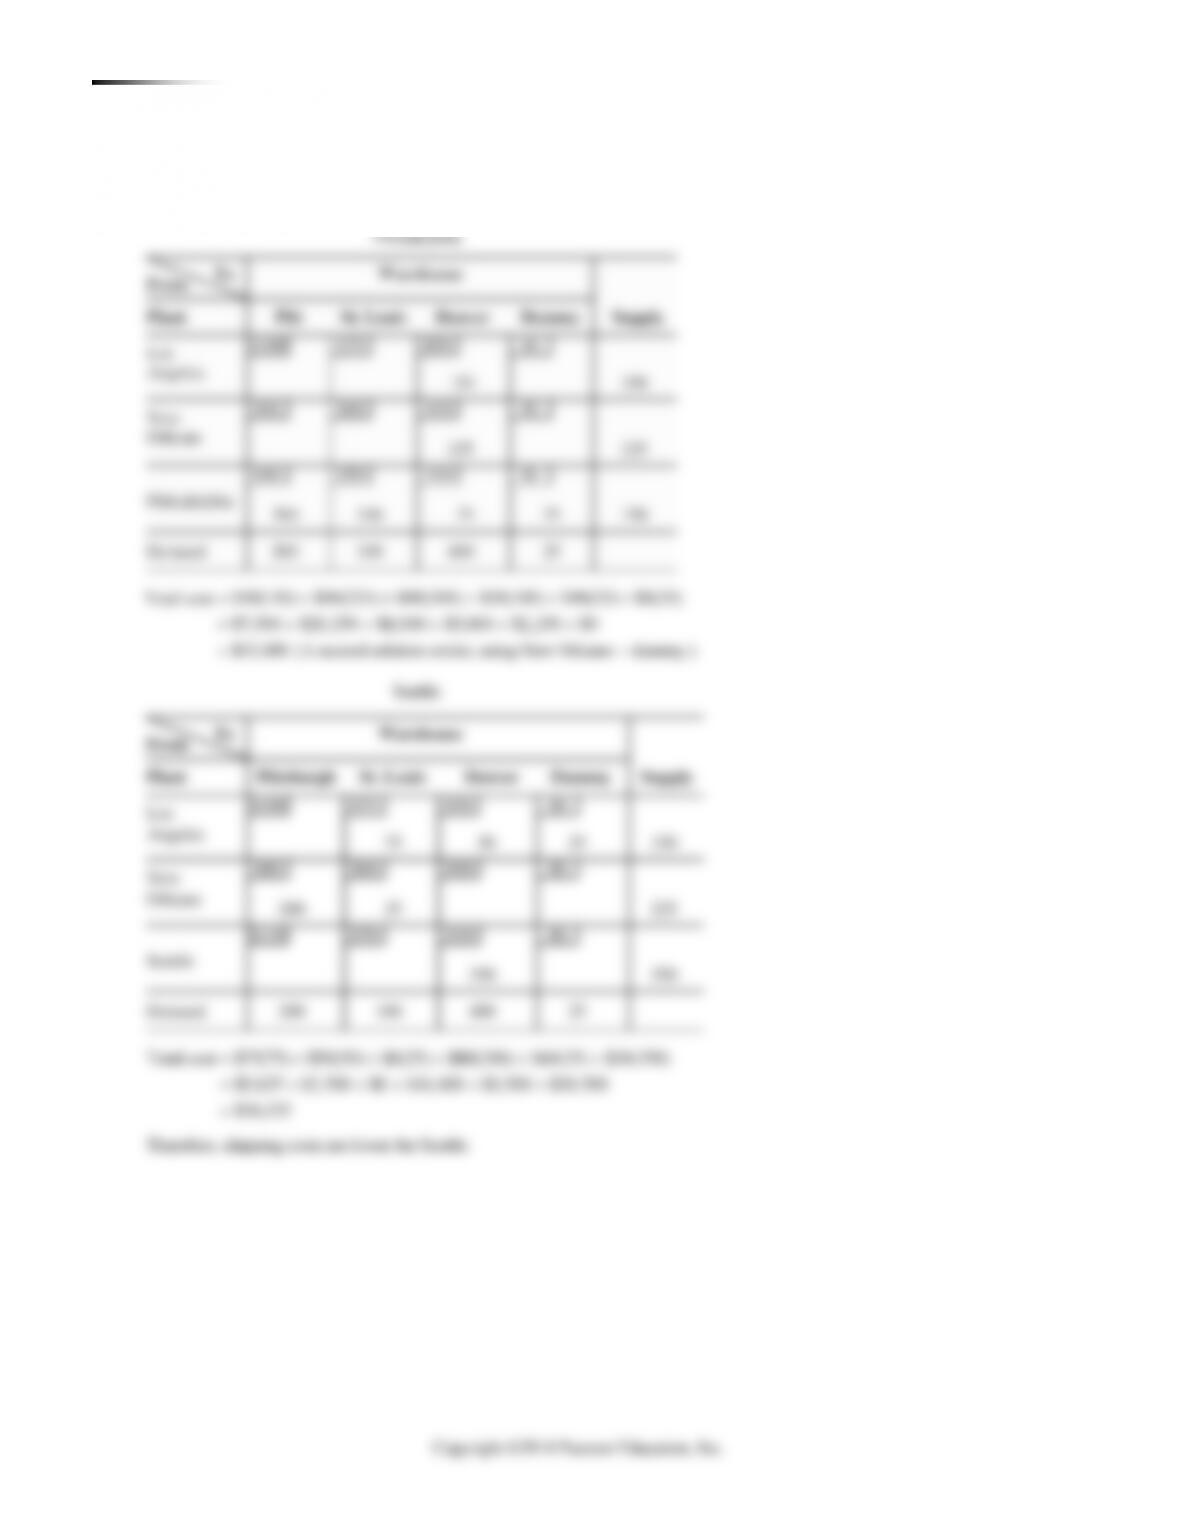
C.13 Considering East St. Louis, we have:
Initial solution—Northwest corner rule:

DB 4 4 8 5 3
DC 3 5 9 5 2
EC 3 5 9 8 1
FB 7 9 8 4 2
→ + − + − = +
→ + − + − = +
→ + − + − = −
→ + − + − = +
DB 4 4 3 5 9 5 2
DC 3 5 9 5 2
EA 8 3 5 9 1
FB 7 4 3 5 1
→ + − + − + − = +
→ + − + − = +
→ + − + − = +
→ + − + − = +
A3 6 10 3 8 9
B1 15 8 5 10 2
B3 14 10 3 8 5 10 6
C2 9 3 8 5 9
→ + − + − = −
→ + − + − = +
→ + − + − + − = −
→ + − + − = +
A2 5 6 14 10 4
B1 15 8 6 14 1
C2 9 3 8 6 14 10 12
C3 10 3 8 6 9
→ + − + − = +
→ + − + − = −
→ + − + − + − = +
→ + − + − = +
296 BUSINESS ANALYTICS MODULE C TR A N S P O R T A T I O N MO D E L S
C.2
X
50
50
100
Y
30
20
50
Z
50
25
75
Demand
50
80
70
25
225
Cost = $2,670 (note the dummy is needed to balance).
(b) Intuitive lowest-cost approach:
X
50
30
20
100
Y
50
50
Z
50
25
75
Demand
50
80
70
25
225
An alternate least-cost solution is :
X–B = 5, X –Dummy =25, Z–B =.75, and Z–Dummy = 0.
Cost = $2,630 (note the dummy is needed to balance).
Intuitive approach yields a better starting point.
X
50
50
Y
50
Z
30
20
25
C.4 The only cell with a negative cost improvement index is
Houston–Miami. It achieves a –1. Allocate 10 to that cell. The
result is:
Houston
0
0
10
St. Louis
20
0
0
Chicago
0
20
10
Total cost = $170
C.5 The optimal cost = $14,700
298 BUSINESS ANALYTICS MODULE C TR A N S P O R T A T I O N MO D E L S
C.9 Supply = 220 + 300 + 435 = 955
of 955 – 710 = 245 and shipping costs of $0.
Cost = $132(160) + $116(60) + $230(60) + $180(200)
+ $178(40) + $164(190)
= $21,120 + 6,960 + $13,800 + $36,000 + $7,120
WC 3 5 2 3 3
YA 6 4 3 7 2
ZA 8 4 3 2 5
YC 6 5 2 7 4
→ + − + − = −
→ + − + − = −
→ + − + − = +
→ + − + − = −
WC 3 6 6 4 1
YB 7 6 4 3 2
ZA 8 4 3 2 5
ZC 5 2 3 4 6 6 2
→ + − + − = −
→ + − + − = +
→ + − + − = +
WA 4 3 6 6 1
YB 7 3 3 6 1
ZA 8 6 6 3 3 2 6
ZC 5 2 3 3 3
→ + − + − = +
→ + − + − = +
→ + − + − + − = +
WC 3 6 7 3 1
YA 6 4 3 7 2
ZA 8 4 3 2 5
ZC 5 2 7 6 4
→ + − + − = +
→ + − + − = −
→ + − + − = +
300 BUSINESS ANALYTICS MODULE C TR A N S P O R T A T I O N MO D E L S
C.11 Solve two separate transportation problems. One will
include Philadelphia and the other will include Seattle. In both
cases, we need a dummy destination.
302 BUSINESS ANALYTICS MODULE C TR A N S P O R T A T I O N MO D E L S
C.13 Considering East St. Louis, we have:
Initial solution—Northwest corner rule:
DB 4 4 8 5 3
DC 3 5 9 5 2
EC 3 5 9 8 1
FB 7 9 8 4 2
→ + − + − = +
→ + − + − = +
→ + − + − = −
→ + − + − = +
DB 4 4 3 5 9 5 2
DC 3 5 9 5 2
EA 8 3 5 9 1
FB 7 4 3 5 1
→ + − + − + − = +
→ + − + − = +
→ + − + − = +
→ + − + − = +
A3 6 10 3 8 9
B1 15 8 5 10 2
B3 14 10 3 8 5 10 6
C2 9 3 8 5 9
→ + − + − = −
→ + − + − = +
→ + − + − + − = −
→ + − + − = +
A2 5 6 14 10 4
B1 15 8 6 14 1
C2 9 3 8 6 14 10 12
C3 10 3 8 6 9
→ + − + − = +
→ + − + − = −
→ + − + − + − = +
→ + − + − = +