
Copyright ©2014 Pearson Education, Inc.
Period 0
0
1
Period 1
80,000
0.9346
Period 2
80,000
0.8734
69,875.09
Period 3
80,000
0.8163
65,303.83
Period 4
80,000
0.7629
Period 5
80,000
0.713
SUPPLEMENT 7 CA P A C I T Y A N D CO N S T R A I N T MA N A G E M E N T 109
Inflow
at 6%
Period 0
Period 1
Period 2
Period 3
Period 0
1
Period 1
18,018.02
Period 2
12,174.34
Period 4
9,880.96
Period 5
5,934.51
Period 6
5,346.40
Total
85,000
62,322.11
70,000
–7,677.89
Outflow
at 4%
PV Inflow
Period 0
Period 1
0.9615
Period 2
0.9246
Period 3
0.889
Period 4
0.8548
Period 5
0.8219
Period 6
0.7903
Total
75,378.54
70,000
5,378.539
Milling
110 SUPPLEMENT 7 CA P A C I T Y A N D CO N S T R A I N T MA N A G E M E N T
Period 2
60,000
0
0.8734
0
52,406.32
Period 3
60,000
0
0.8163
48,977.88
0
48,977.88
Period 4
60,000
0
0.7629
0
45,773.71
Period 5
60,000
0
0.713
42,779.17
0
42,779.17
Total
390,000
220,000
305,982.70
220,000
Period 2
60,000
0
0.8734
0
52,406.32
Period 3
60,000
0
0.8163
48,977.88
0
48,977.88
Period 4
60,000
0
0.7629
0
45,773.71
Period 5
60,000
0
0.713
42,779.17
0
42,779.17
Total
390,000
220,000
305,982.70
220,000
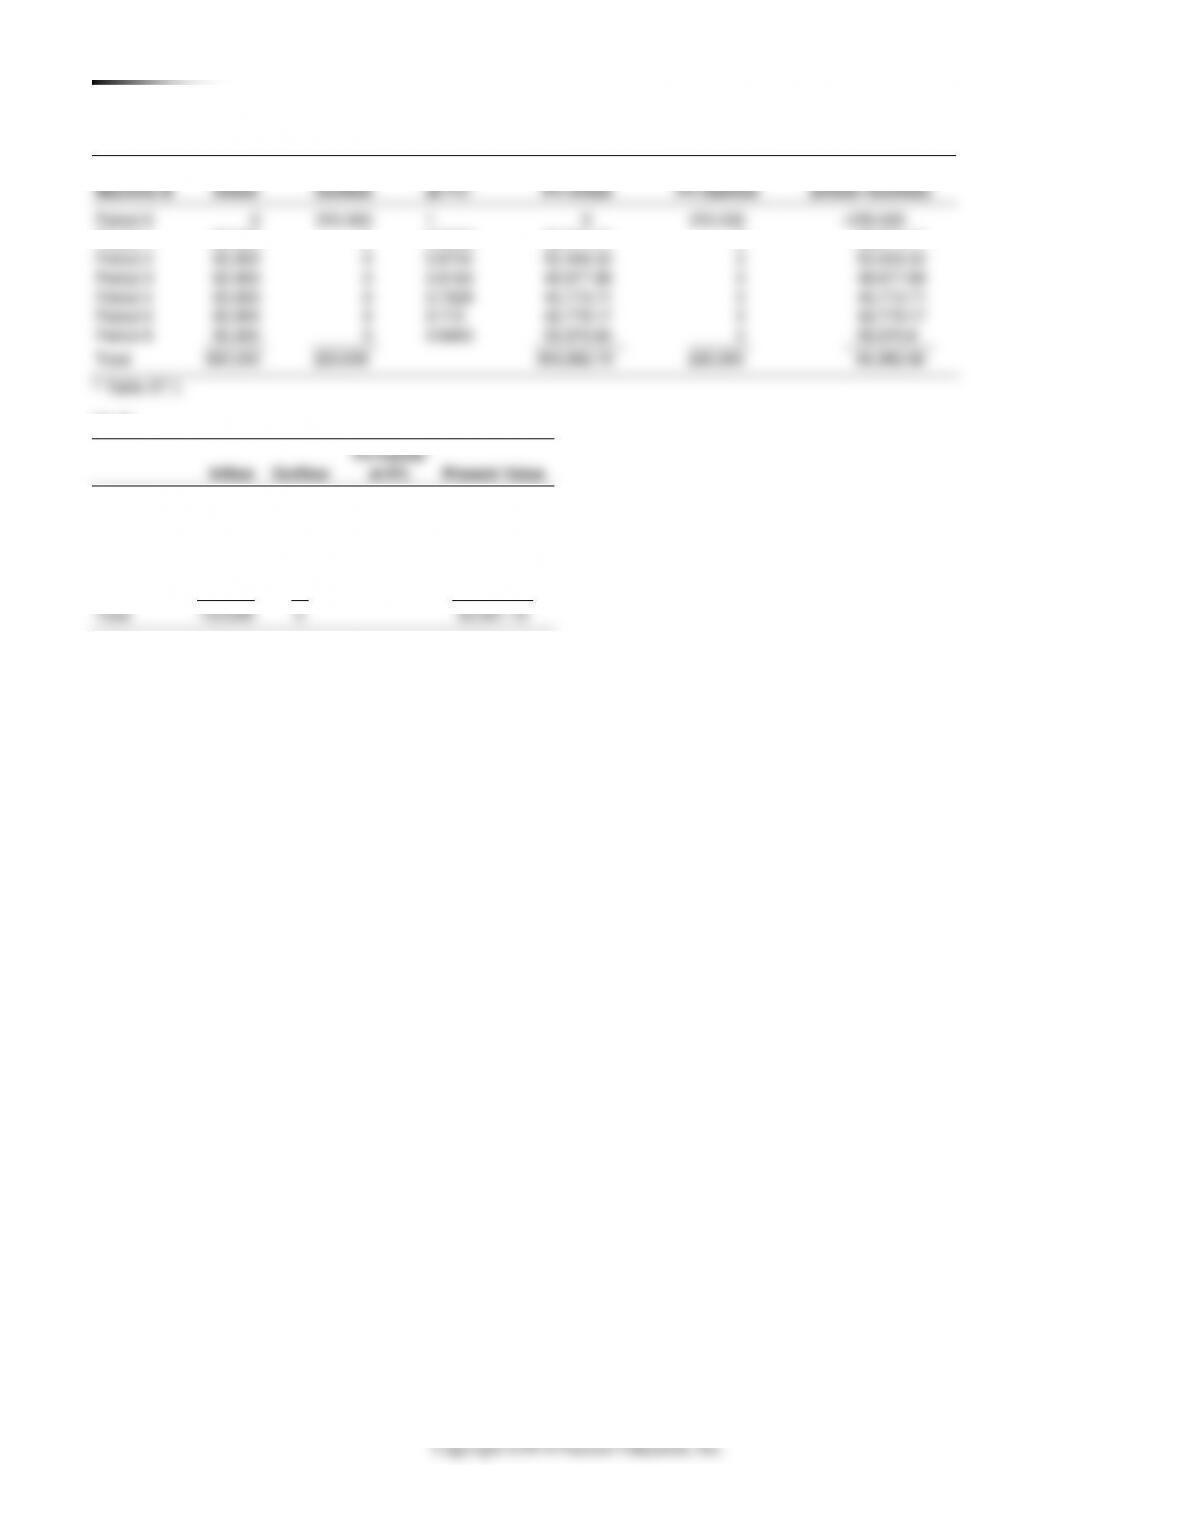
S7.45
PV Factor
Inflow
Outflow
at 6%
Present Value
Period 0
0
0
1
0
Period 1
20,000
0
0.9434
18,867.92
Period 2
0
0
0.89
0
Period 3
30,000
0
0.8396
25,188.58
Period 4
50,000
0
0.7921
39,604.68
Total
100,000
0
83,661.19
Milling
PV Factor
PV
Machine B
Inflow
Outflow
at 7%*
PV Inflow
PV Outflow
(Inflow–Outflow)
Period 0
0
220,000
1
0
220,000
–220,000
Period 1
60,000
0
0.9346
56,074.77
0
56,074.77

SUPPLEMENT 7 CA P A C I T Y A N D CO N S T R A I N T MA N A G E M E N T 111
Copyright ©2014 Pearson Education, Inc.
VIDEO CASE STUDY
CAPACITY PLANNING AT ARNOLD PALMER
HOSPITAL
The Arnold Palmer Hospital video for this case is available
from Pearson Prentice Hall at www.myomlab.com. (Its running
time is 9 minutes.) Also note that the Global Company Profile in
Chapter 6 highlights this hospital.
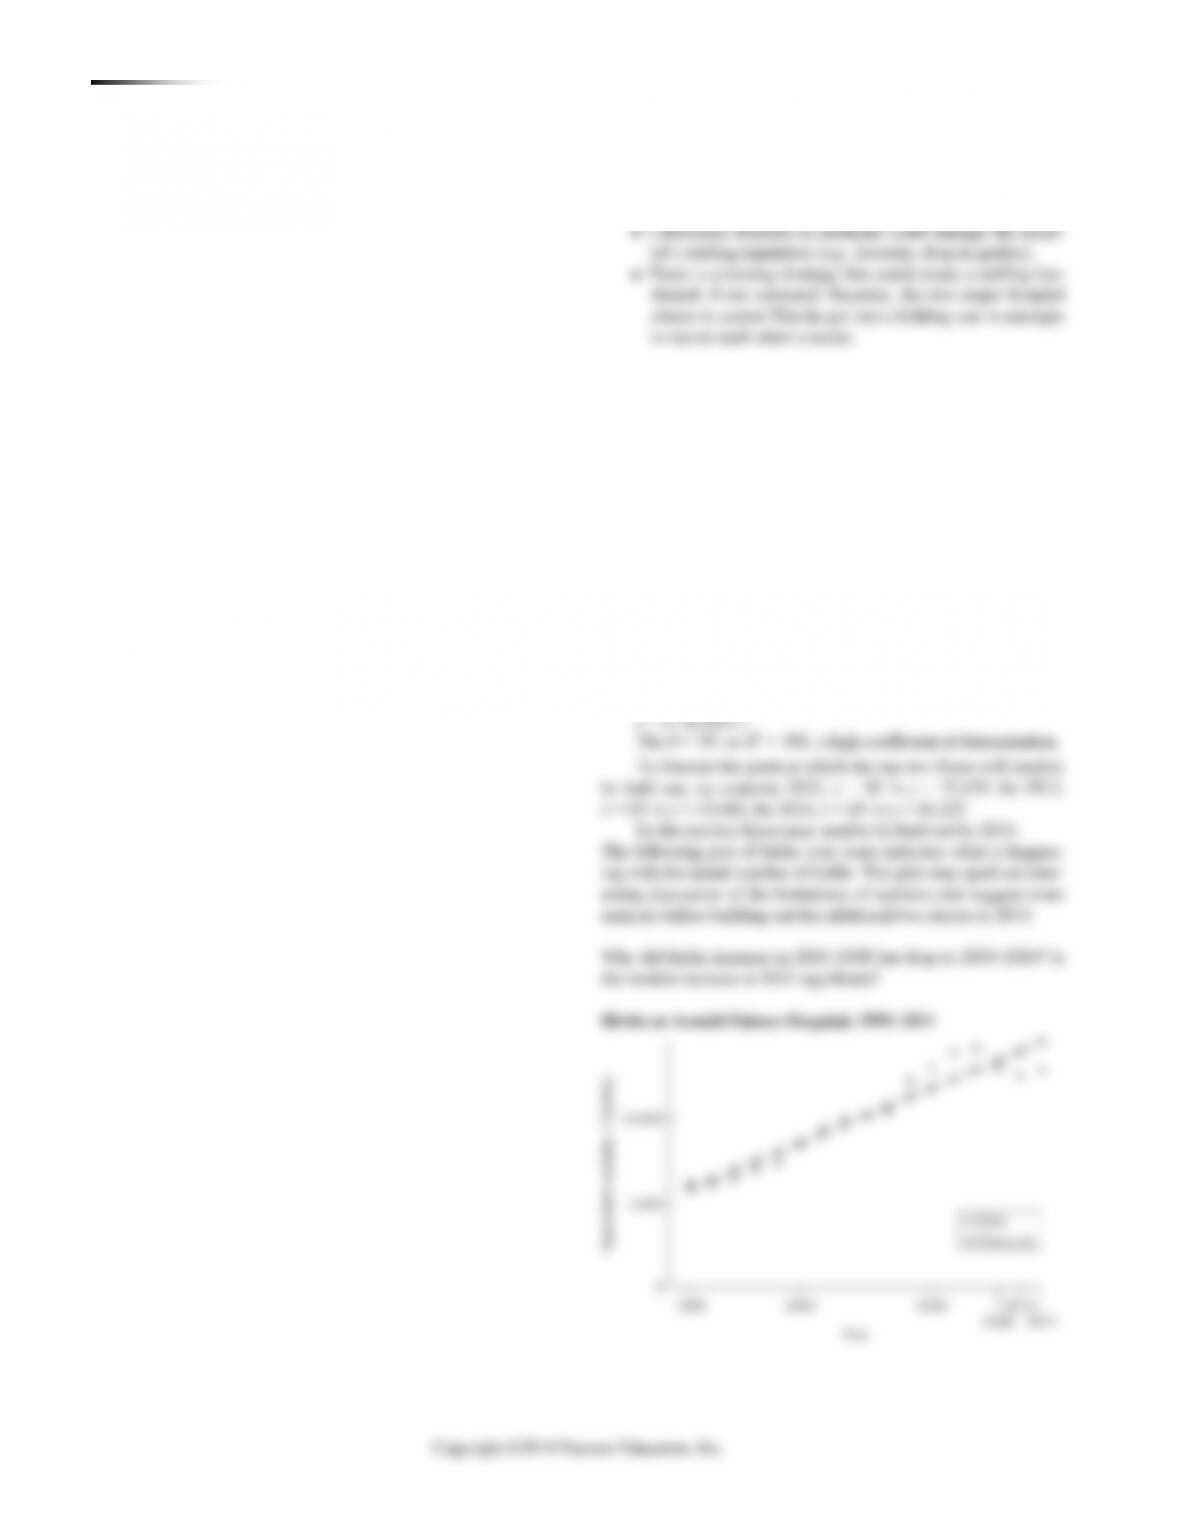
1. Given the discussion in the text, what approach is APH taking
to match capacity to demand?
Referring to Figure S7.6, Arnold Palmer Hospital’s capacity first
lagged demand and now is leading demand with incremental
2. What kind of major changes can take place in APH’s de–
mand forecast that would leave the hospital with an underutilized
facility (namely, what are the risks connected with this capacity deci-
sion)?
Possible risks:
112 SUPPLEMENT 7 CA P A C I T Y A N D CO N S T R A I N T MA N A G E M E N T
3. Use regression analysis to forecast the point at which Swan-
son needs to “build out” the top two floors of the new building.
Regression analysis on the birth data in Table S7.3 yields:
Y = projected births = 5365 + 543x
(where x = time in years. x = 1 is 1995, x = 2 is 1996,…
1. Determine weighted contribution.
Hot dogs
$2.00
$0.80
0.40
0.60
Hamburgers
$2.50
$1.00
0.40
0.60
Misc. snacks
$1.00
$0.40
0.40
0.60
Hot dogs
$2.00
$0.80
0.40
0.60
Hamburgers
$2.50
$1.00
0.40
0.60
Misc. snacks
$1.00
$0.40
0.40
0.60
Prorated salaries/5 games =
$20,000.00
2,400 sq. ft $2
$ 4,800.00
6 people 6 booths $7 5 hr
$ 1,260.00
$26,060.00
Break even = $26,060/0.6125 =
$42,546.94
Percent
25%
25%
20%
20%
10%
Percent
25%
25%
20%
20%
10%
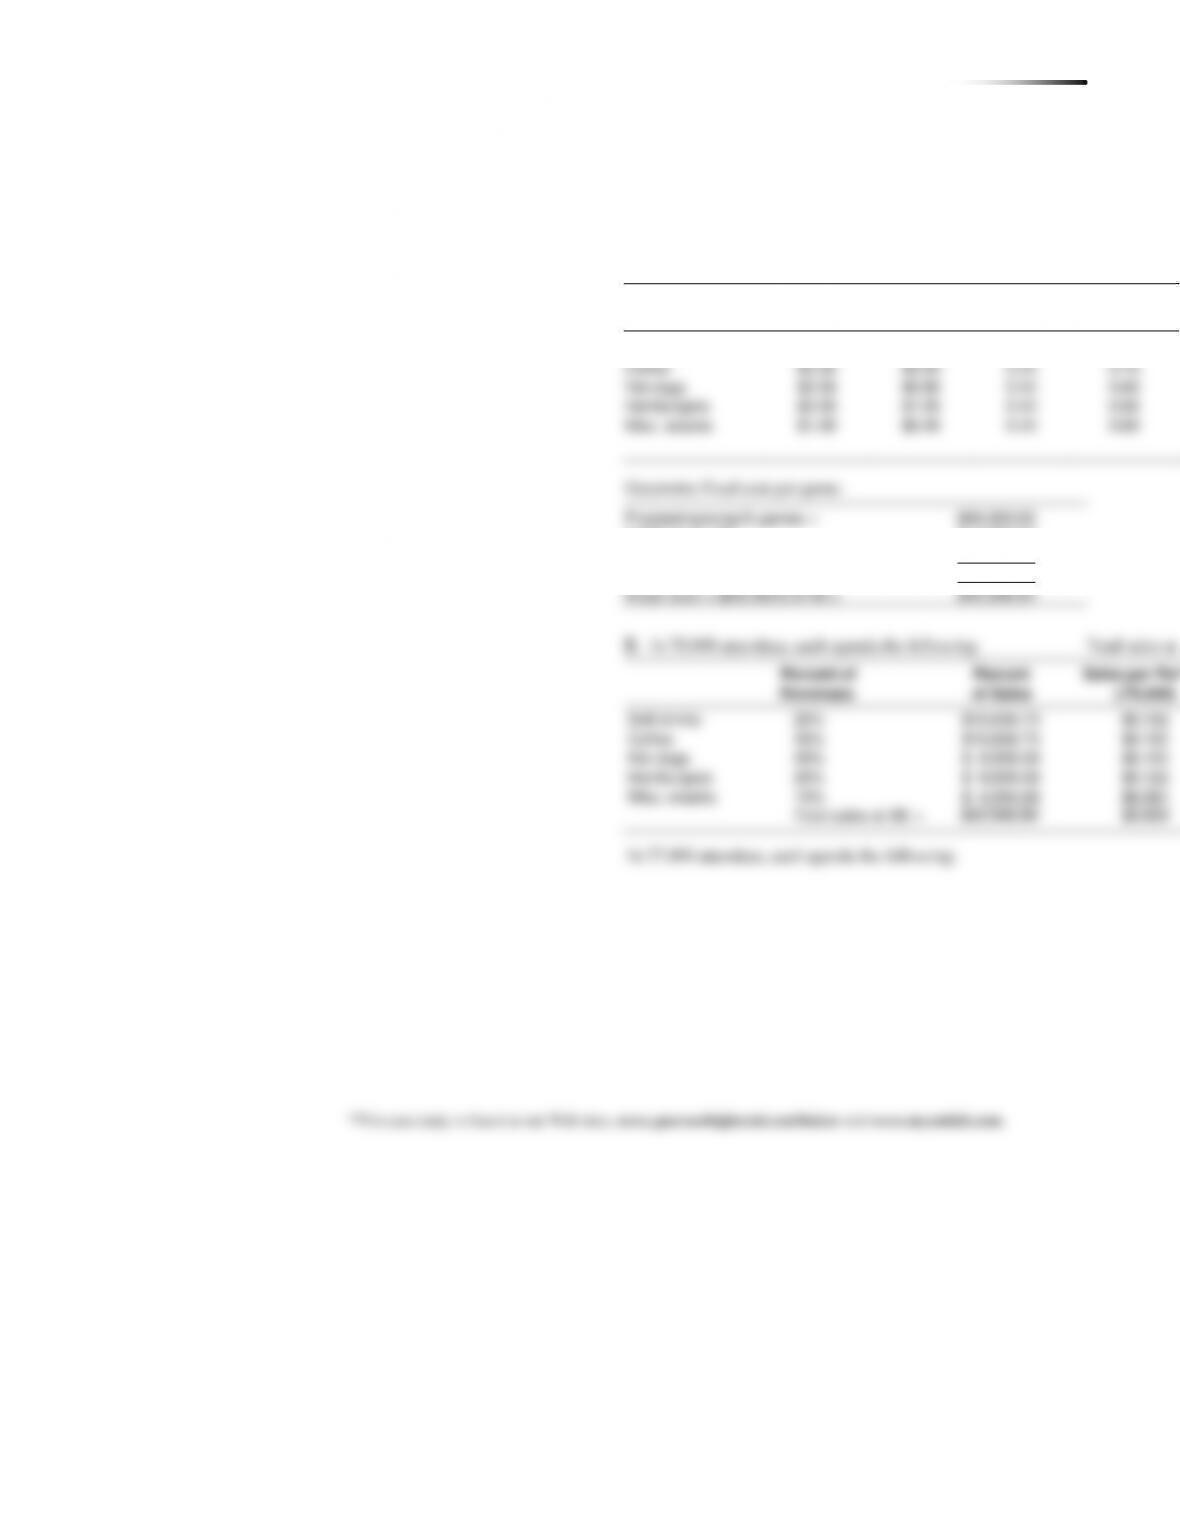
At 27,000 attendees, each spends the following:
Selling
Var.
Items
Price/ea
Cost/ea
V/P
(1 –V/P)
Soft drinks
$1.50
$0.75
0.50
0.50
Coffee
$2.00
$0.50
0.25
0.75

114 SUPPLEMENT 7 CA P A C I T Y A N D CO N S T R A I N T MA N A G E M E N T
Percent of
Percent
Sales per Person
Revenues
of Sales
(/27,000)
Soft drinks
25%
$10,636.73
$0.394
Coffee
25%
$10,636.73
$0.394
Hot dogs
20%
$ 8,509.39
$0.315
Hamburgers
20%
$ 8,509.39
$0.315
Misc. snacks
10%
$ 4,254.69
$0.158
Total sales at BE =
$42,546.94
$1.576
Average per-person food sale

110 SUPPLEMENT 7 CA P A C I T Y A N D CO N S T R A I N T MA N A G E M E N T
S7.45
PV Factor
Inflow
Outflow
at 6%
Present Value
Period 0
0
0
1
0
Period 1
20,000
0
0.9434
18,867.92
Period 2
0
0
0.89
0
Period 3
30,000
0
0.8396
25,188.58
Period 4
50,000
0
0.7921
39,604.68
Total
100,000
0
83,661.19
Milling
PV Factor
PV
Machine B
Inflow
Outflow
at 7%*
PV Inflow
PV Outflow
(Inflow–Outflow)
Period 0
0
220,000
1
0
220,000
–220,000
Period 1
60,000
0
0.9346
56,074.77
0
56,074.77
SUPPLEMENT 7 CA P A C I T Y A N D CO N S T R A I N T MA N A G E M E N T 111
Copyright ©2014 Pearson Education, Inc.
VIDEO CASE STUDY
CAPACITY PLANNING AT ARNOLD PALMER
HOSPITAL
The Arnold Palmer Hospital video for this case is available
from Pearson Prentice Hall at www.myomlab.com. (Its running
time is 9 minutes.) Also note that the Global Company Profile in
Chapter 6 highlights this hospital.
1. Given the discussion in the text, what approach is APH taking
to match capacity to demand?
Referring to Figure S7.6, Arnold Palmer Hospital’s capacity first
lagged demand and now is leading demand with incremental
2. What kind of major changes can take place in APH’s de–
mand forecast that would leave the hospital with an underutilized
facility (namely, what are the risks connected with this capacity deci-
sion)?
Possible risks:
112 SUPPLEMENT 7 CA P A C I T Y A N D CO N S T R A I N T MA N A G E M E N T
3. Use regression analysis to forecast the point at which Swan-
son needs to “build out” the top two floors of the new building.
Regression analysis on the birth data in Table S7.3 yields:
Y = projected births = 5365 + 543x
(where x = time in years. x = 1 is 1995, x = 2 is 1996,…
1. Determine weighted contribution.
Prorated salaries/5 games =
$20,000.00
2,400 sq. ft $2
$ 4,800.00
6 people 6 booths $7 5 hr
$ 1,260.00
$26,060.00
Break even = $26,060/0.6125 =
$42,546.94
At 27,000 attendees, each spends the following:
Selling
Var.
Items
Price/ea
Cost/ea
V/P
(1 –V/P)
Soft drinks
$1.50
$0.75
0.50
0.50
Coffee
$2.00
$0.50
0.25
0.75
114 SUPPLEMENT 7 CA P A C I T Y A N D CO N S T R A I N T MA N A G E M E N T
Percent of
Percent
Sales per Person
Revenues
of Sales
(/27,000)
Soft drinks
25%
$10,636.73
$0.394
Coffee
25%
$10,636.73
$0.394
Hot dogs
20%
$ 8,509.39
$0.315
Hamburgers
20%
$ 8,509.39
$0.315
Misc. snacks
10%
$ 4,254.69
$0.158
Total sales at BE =
$42,546.94
$1.576
Average per-person food sale