CHAPTER 6 MAN A G IN G QU A L I T Y 75
6.13
(a)
6.14
6.12
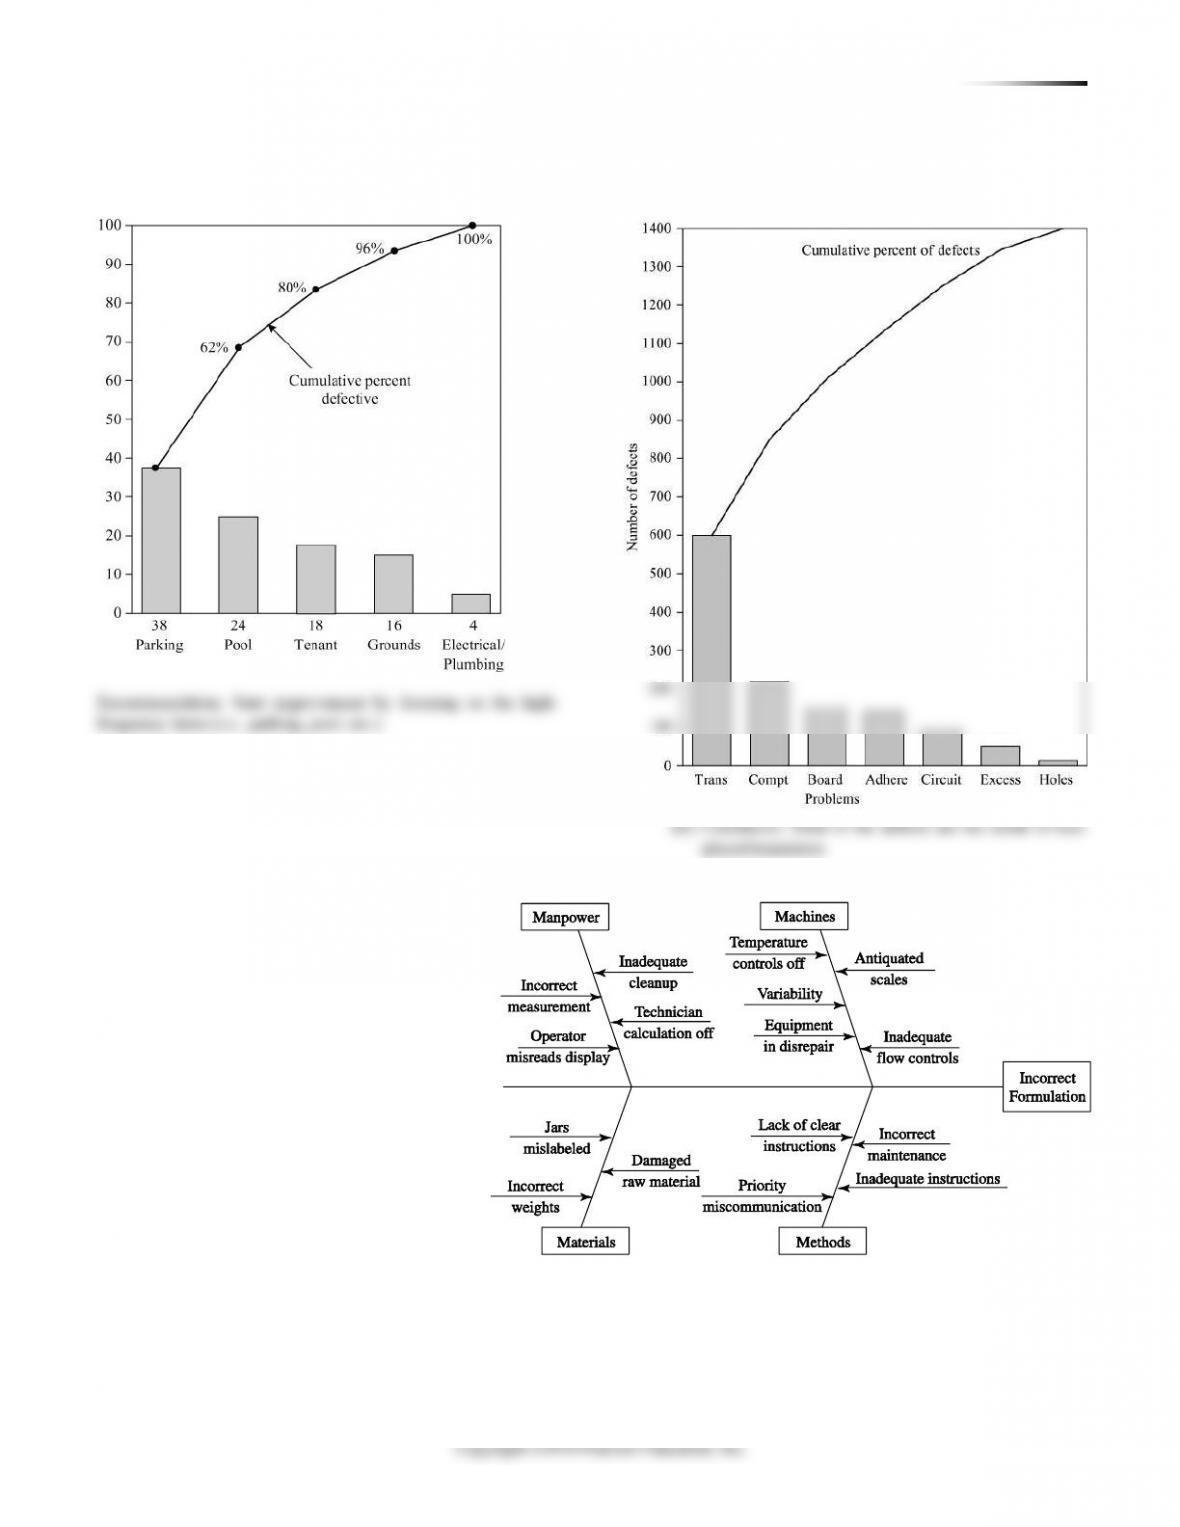
Recommendation: Start improvement by focusing on the high-
frequency items (i.e., parking, pool, etc.).
76 CHAPTER 6 MAN A G IN G QU A L I T Y
6.15 Individual responses will vary.
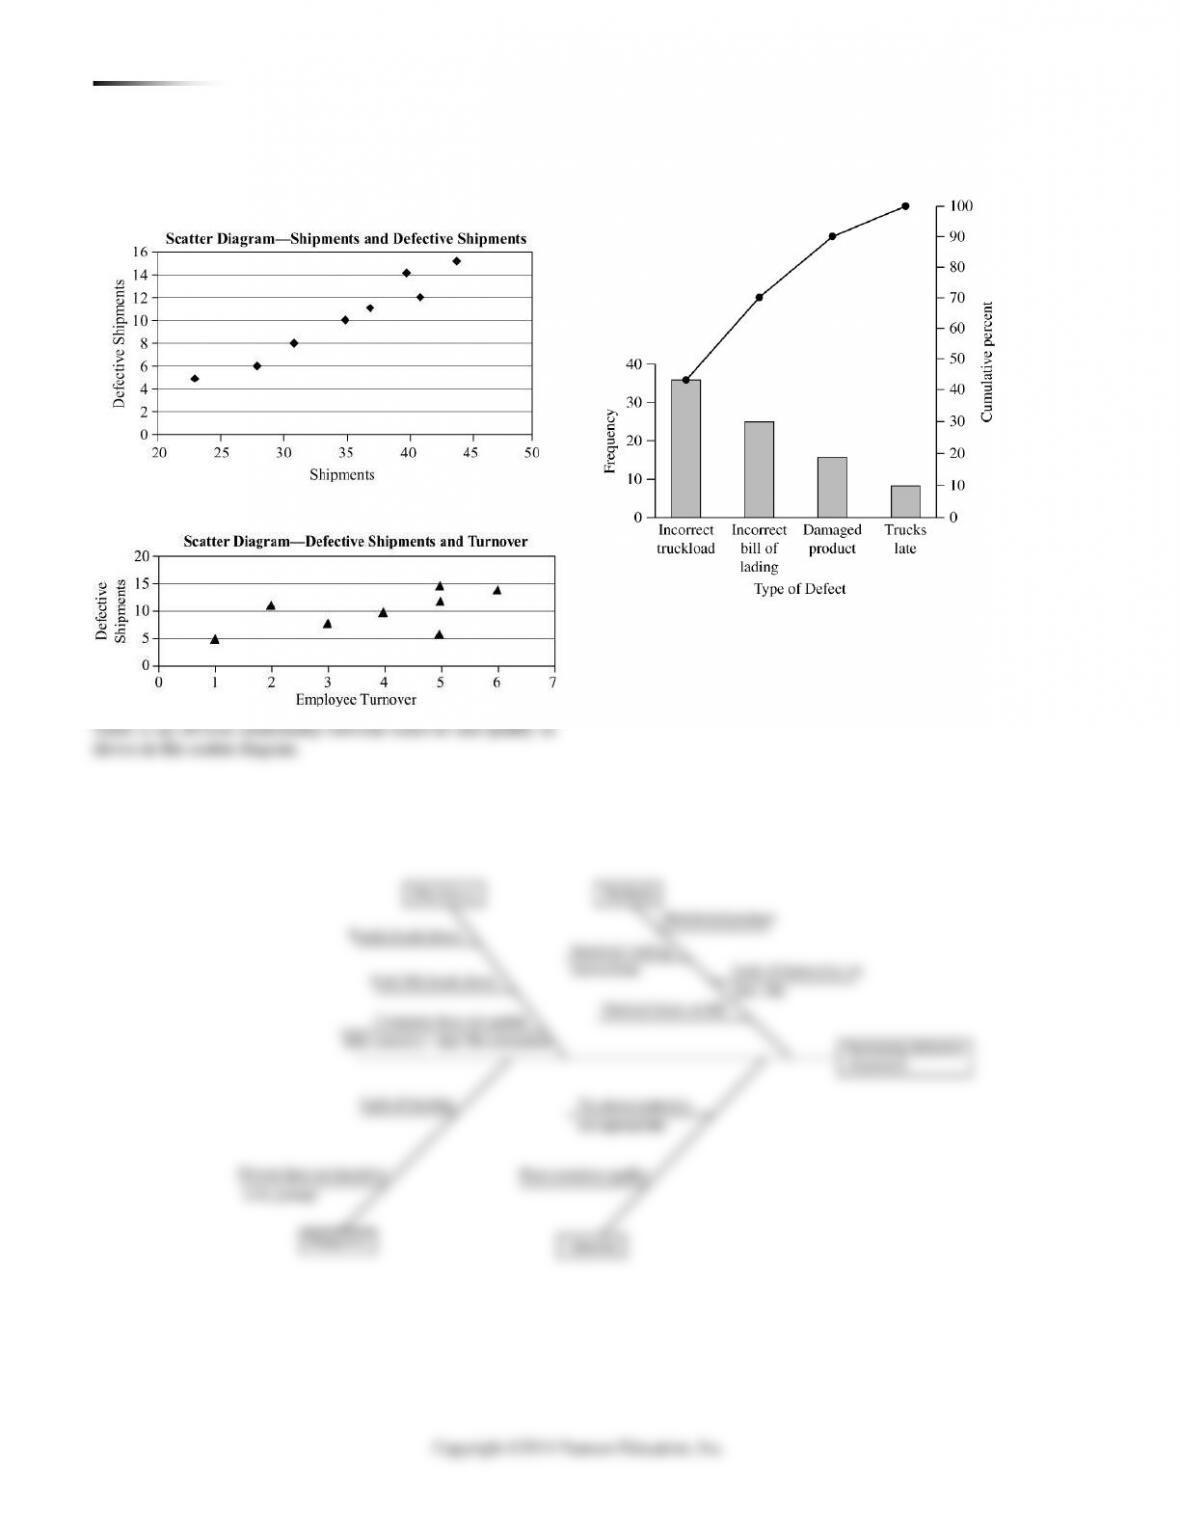
6.16 (a) The scatter diagram shows a strong positive relationship
(b) The scatter diagram will resemble the chart below:
There is an obvious relationship between turnover and quality as
shown in this scatter diagram.
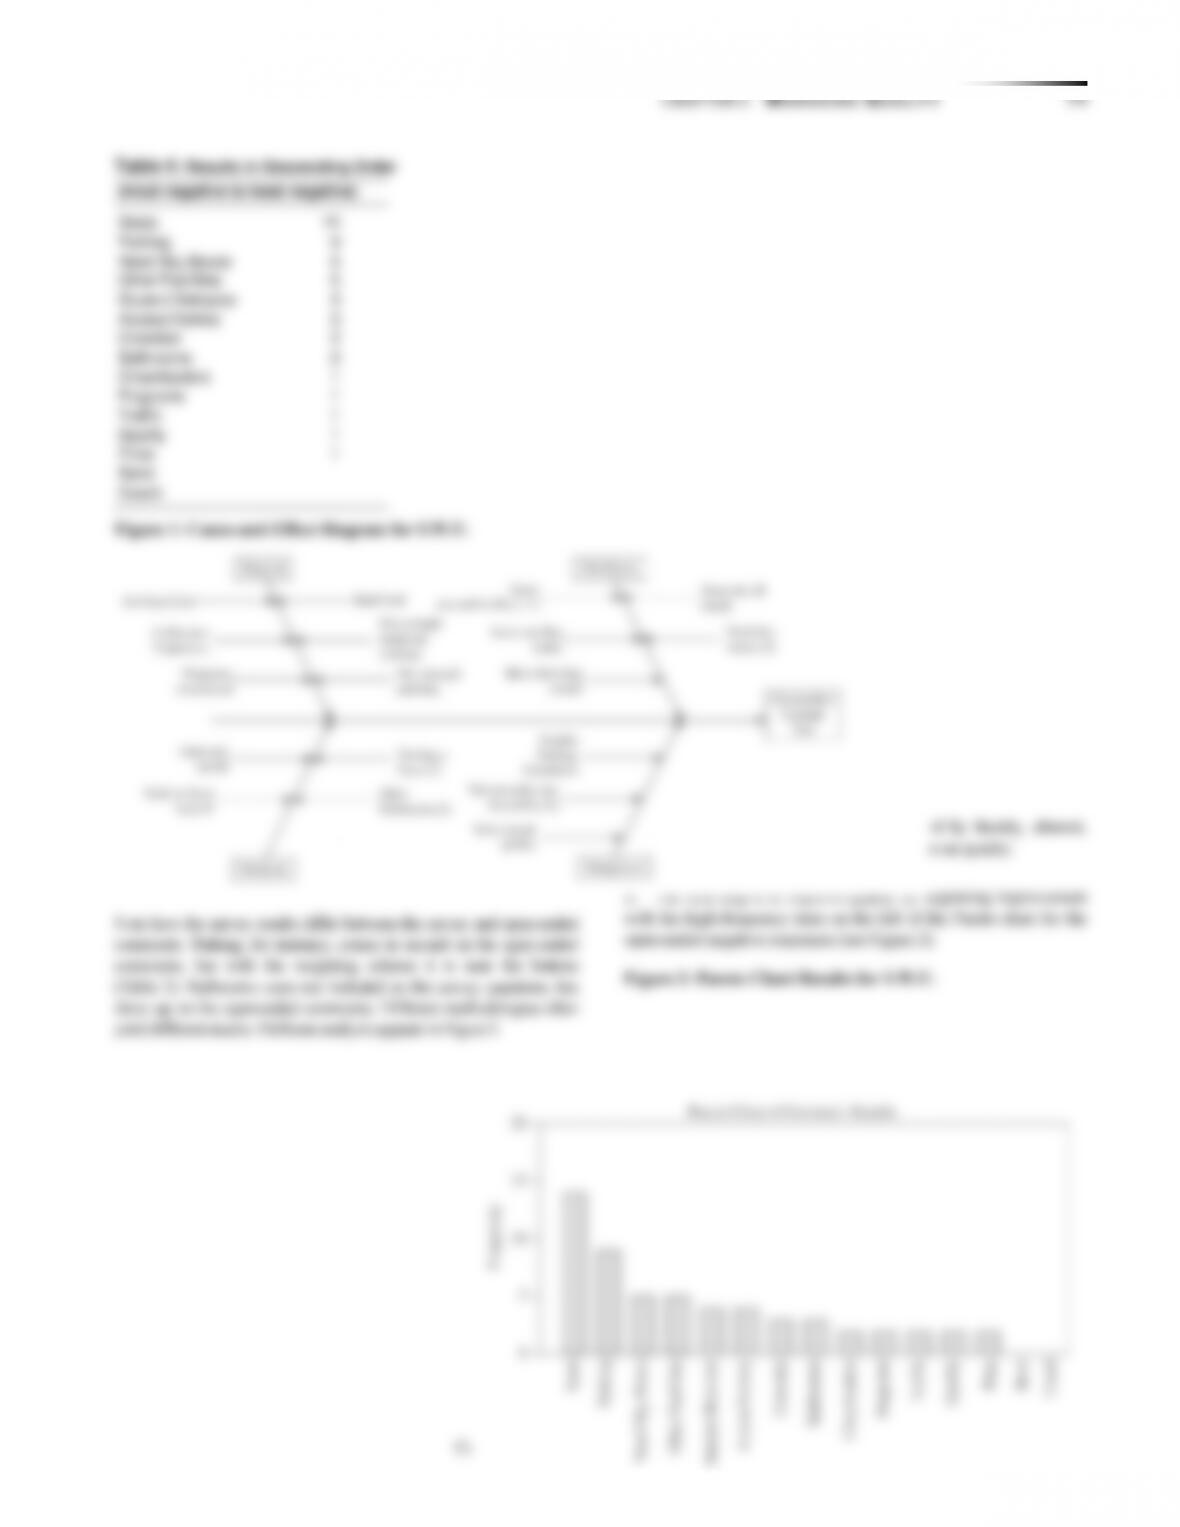
(c) The Pareto chart is:
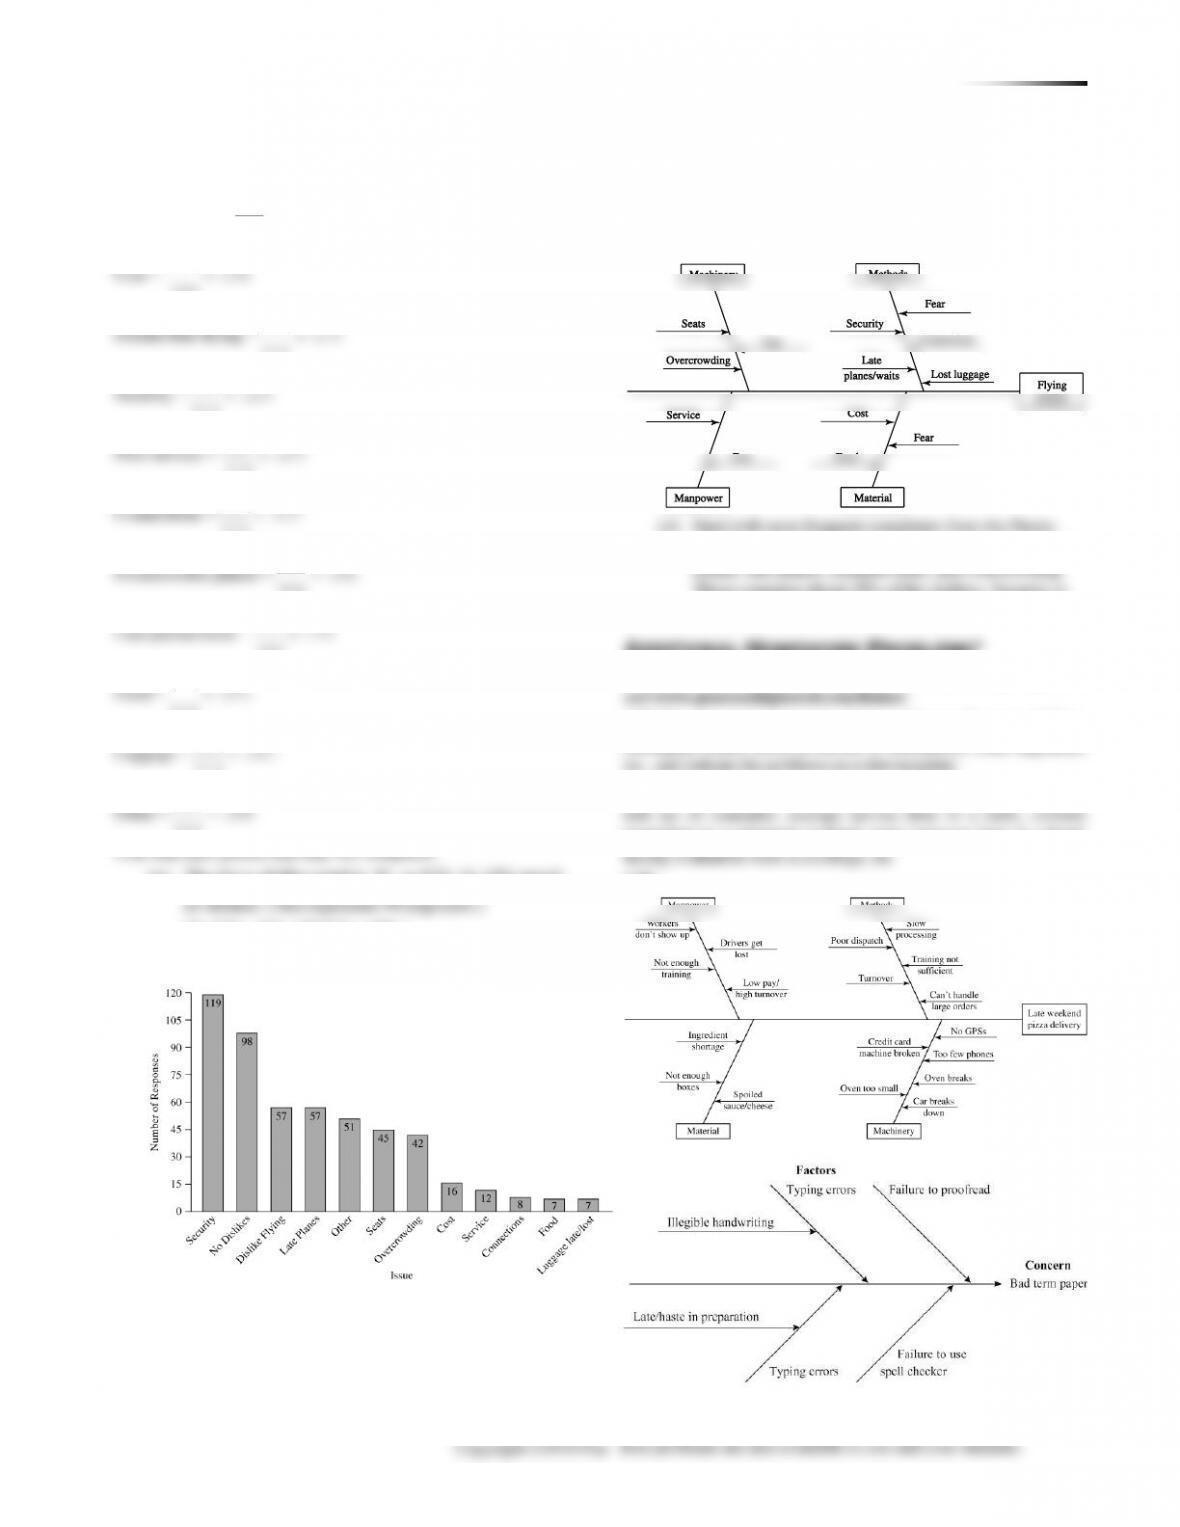
____________________________________________
(d) This is more appropriate for an in-class or group exercise
where students may brainstorm for ideas. The possible
causes should go on the four main bones. An example:
78 CHAPTER 6 MAN A G I N G QU A L I T Y
CASE STUDY
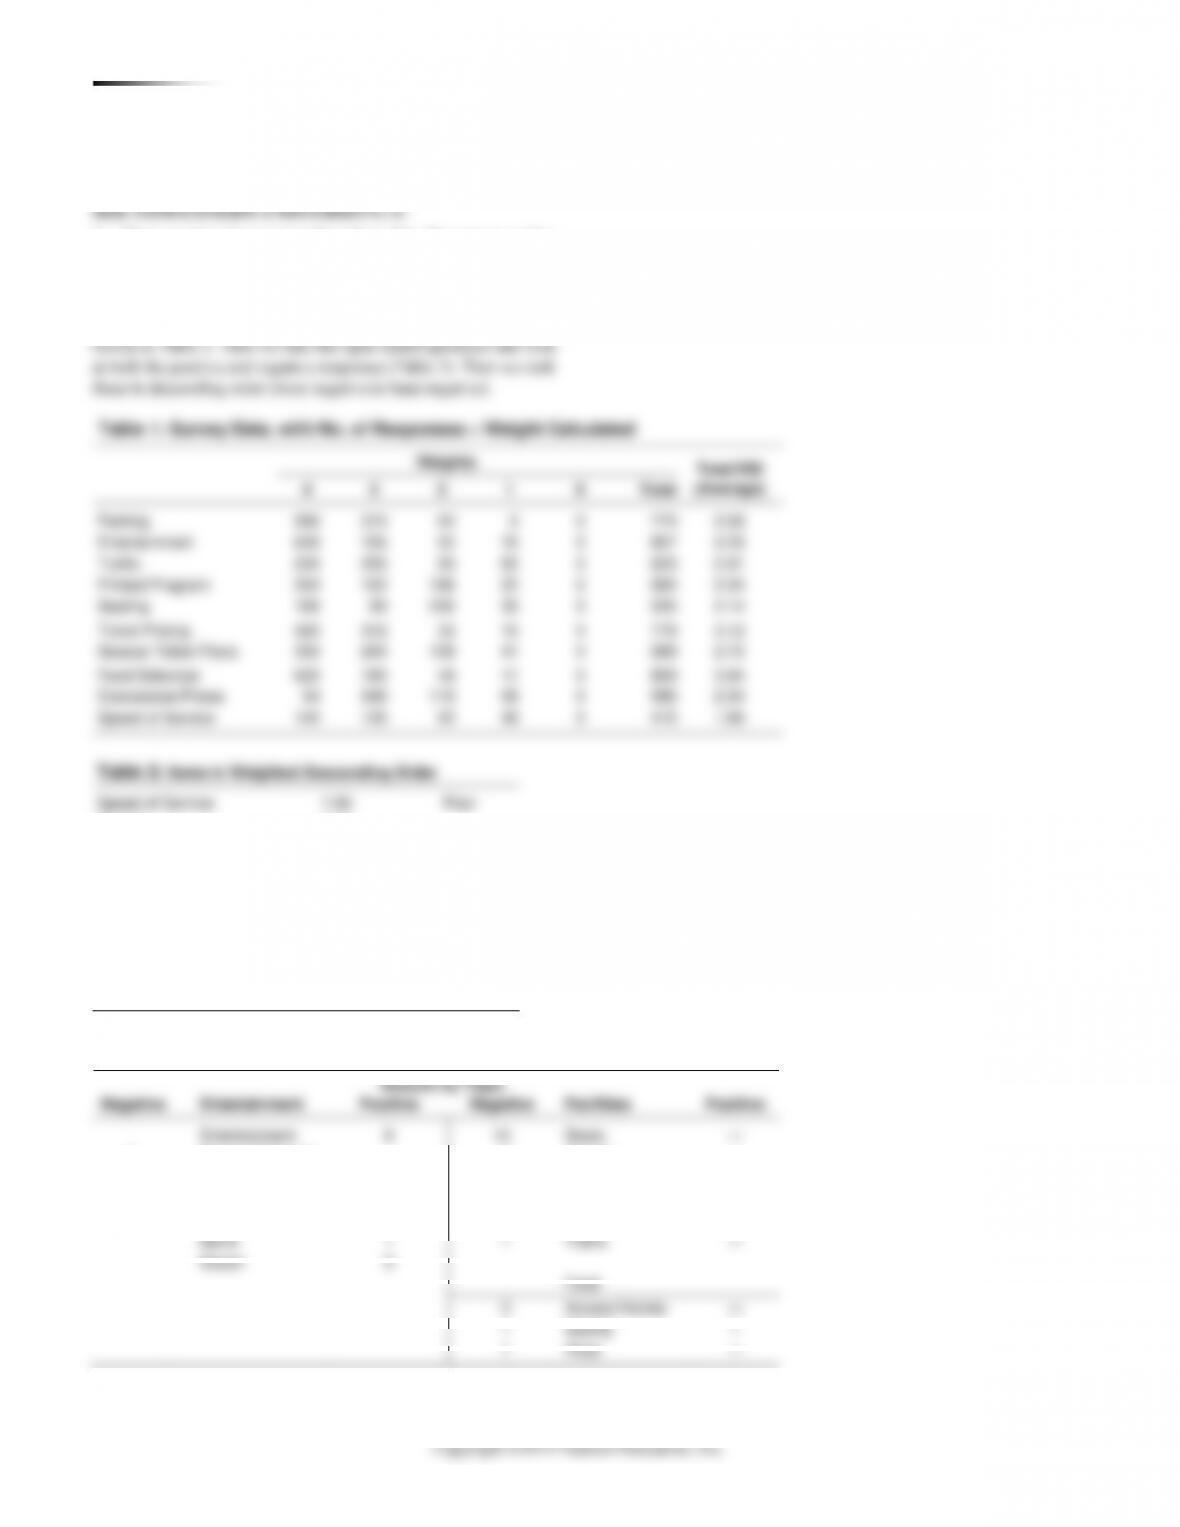
1. There are lots of ways to analyze these data. We suggest getting
the student to begin by considering the tools of TQM and go from
there. Here we have weighted these survey data (from Table 6.7)
with 4 for good and 0 for poor in Table 1 below and then ranked
them. This approach yields the data in descending order (Poor to
80 CHAPTER 6 MAN A G I N G QU A L I T Y
2
1. Why is it important for APH to get the patient’s assessment of
health care quality? Does the patient have the expertise to judge
the health care she receives?
The patient’s assessment of health care quality may drive where
the patient goes the next time services are needed. Patient
2. How would you build a culture of quality in an organization
◼ A quality plan that is part of the overall strategic plan for
the hospital.
Process controls for such areas as lab tests and pharmacy
prescription errors.
Effective supplier evaluation and development.
JIT suppliers.
Employee fulfillment:
◼ Employs an executive “dashboard” scoreboard to keep
track of major indices of quality.
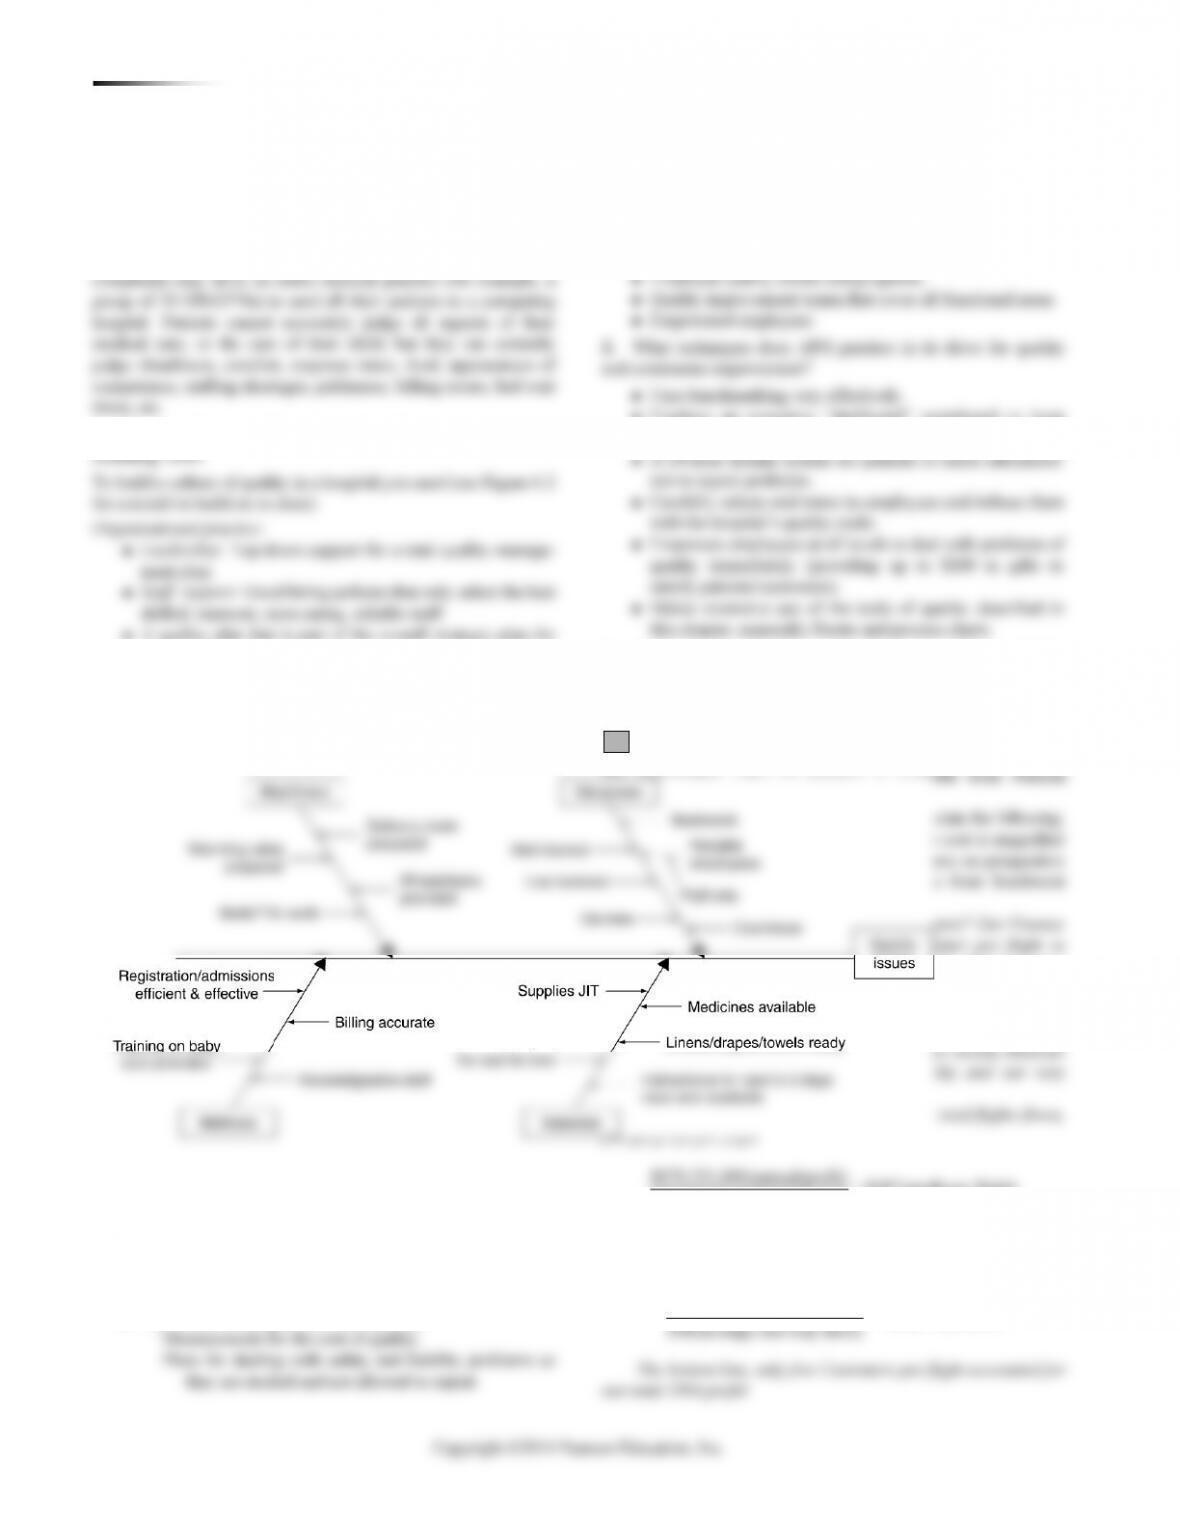
4. Develop a fishbone diagram illustrating the quality variables
for a patient who just gave birth at APH.
QUALITY AT THE RITZ-CARLTON HOTEL
1994 was 74.5, which means that, on average, only when Customer
#75 came on board did a flight become profitable.
Aside from that statistical data, let me share with you a down-
to-earth formula devised by our Dallas chief pilot, Ken Gile. It
1. The Ritz-Carlton can monitor quality in the short run
by customer feedback. Questionnaires in the room, follow-up
3. The lack of quality will manifest itself in room rate reductions,
extra supervision, complaints, and ultimately lower occupancy.
4. Great question for class discussion: Control charts can be
used for tracking customer complaints, Pareto diagrams to find
where to focus improvement efforts, cause-and-effect diagrams
problems, respectively).
Analysis by Time:
56% of all Winder rejects and 97% of Winder #3 rejects.
◼ Find cause for broken leads on Winder #1. Could eliminate
81% of Winder #1 rejects and 25% of all rejects.
◼ Find cause for wrong wire and wrong core early in month
on Winder #2. Could it be a new operator who made fewer
mistakes as he/she gained experience?
76 CHAPTER 6 MAN A G IN G QU A L I T Y
6.15 Individual responses will vary.
6.16 (a) The scatter diagram shows a strong positive relationship
(b) The scatter diagram will resemble the chart below:
There is an obvious relationship between turnover and quality as
shown in this scatter diagram.
(c) The Pareto chart is:
____________________________________________
(d) This is more appropriate for an in-class or group exercise
where students may brainstorm for ideas. The possible
causes should go on the four main bones. An example:
78 CHAPTER 6 MAN A G I N G QU A L I T Y
CASE STUDY
1. There are lots of ways to analyze these data. We suggest getting
the student to begin by considering the tools of TQM and go from
there. Here we have weighted these survey data (from Table 6.7)
with 4 for good and 0 for poor in Table 1 below and then ranked
them. This approach yields the data in descending order (Poor to
80 CHAPTER 6 MAN A G I N G QU A L I T Y
2
1. Why is it important for APH to get the patient’s assessment of
health care quality? Does the patient have the expertise to judge
the health care she receives?
The patient’s assessment of health care quality may drive where
the patient goes the next time services are needed. Patient
2. How would you build a culture of quality in an organization
◼ A quality plan that is part of the overall strategic plan for
the hospital.
Process controls for such areas as lab tests and pharmacy
prescription errors.
Effective supplier evaluation and development.
JIT suppliers.
Employee fulfillment:
◼ Employs an executive “dashboard” scoreboard to keep
track of major indices of quality.
4. Develop a fishbone diagram illustrating the quality variables
for a patient who just gave birth at APH.
QUALITY AT THE RITZ-CARLTON HOTEL
1994 was 74.5, which means that, on average, only when Customer
#75 came on board did a flight become profitable.
Aside from that statistical data, let me share with you a down-
to-earth formula devised by our Dallas chief pilot, Ken Gile. It
1. The Ritz-Carlton can monitor quality in the short run
by customer feedback. Questionnaires in the room, follow-up
3. The lack of quality will manifest itself in room rate reductions,
extra supervision, complaints, and ultimately lower occupancy.
4. Great question for class discussion: Control charts can be
used for tracking customer complaints, Pareto diagrams to find
where to focus improvement efforts, cause-and-effect diagrams
problems, respectively).
Analysis by Time:
56% of all Winder rejects and 97% of Winder #3 rejects.
◼ Find cause for broken leads on Winder #1. Could eliminate
81% of Winder #1 rejects and 25% of all rejects.
◼ Find cause for wrong wire and wrong core early in month
on Winder #2. Could it be a new operator who made fewer
mistakes as he/she gained experience?