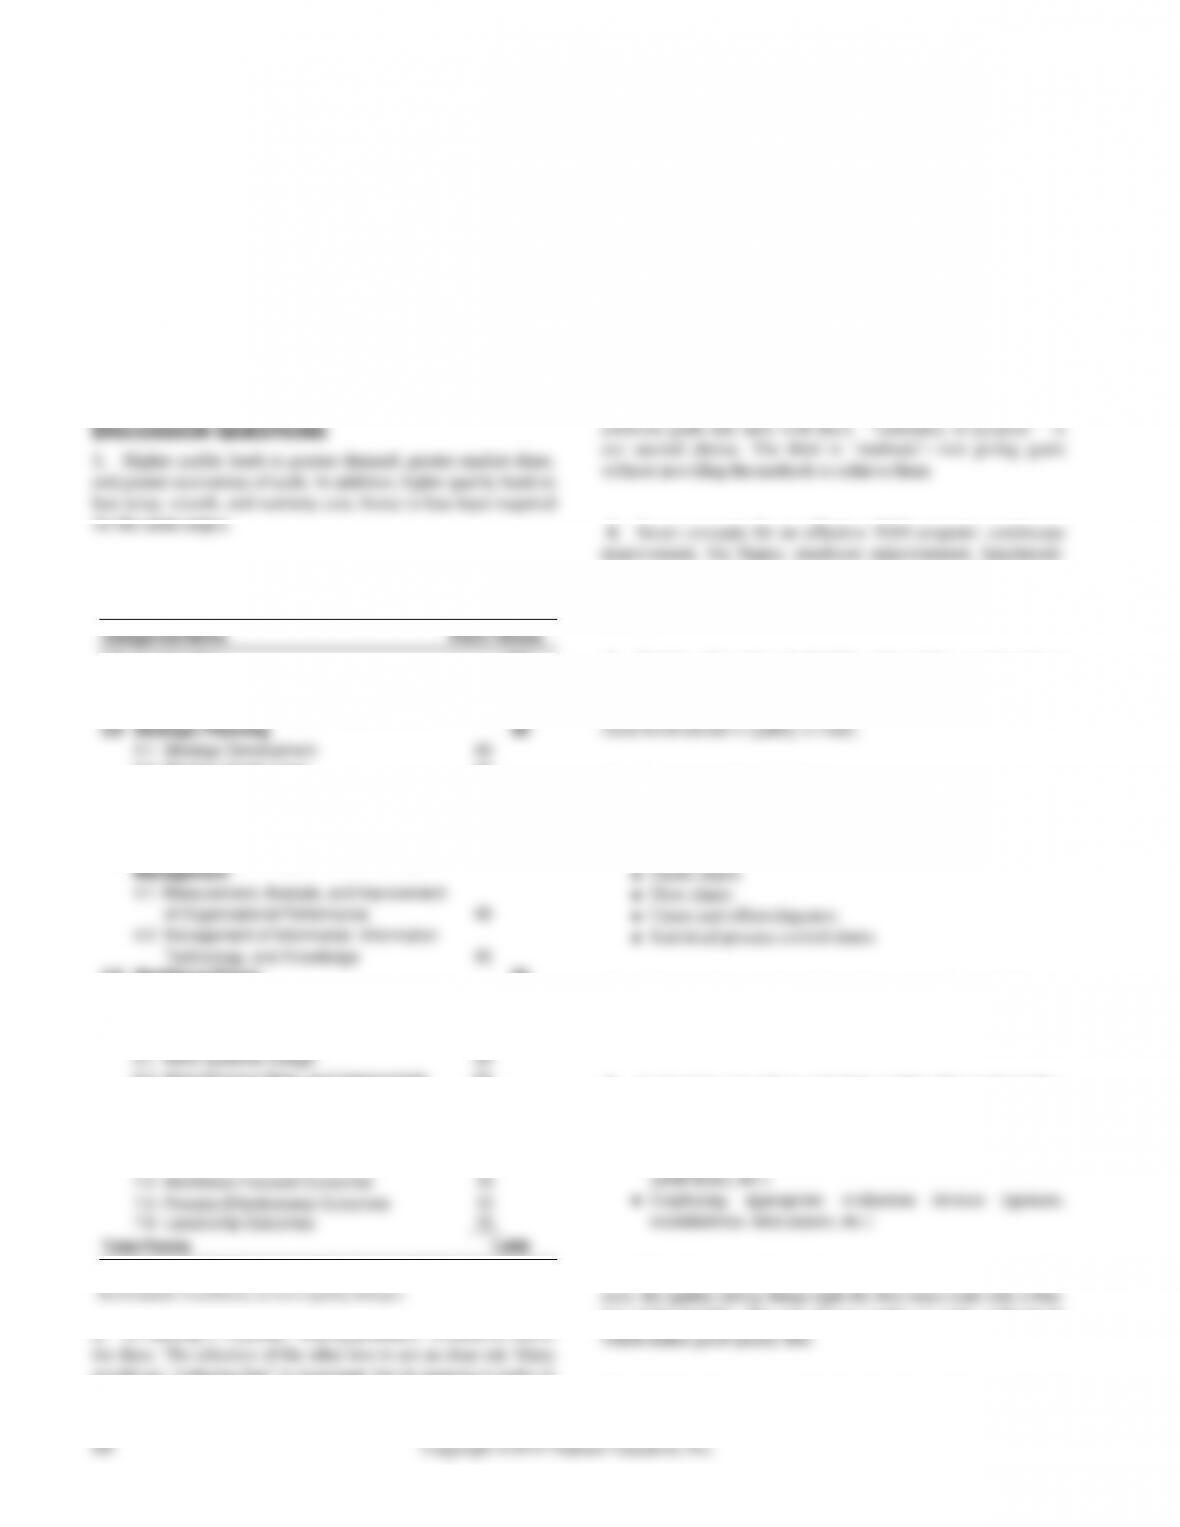
Categories/Items
Point Values
Leadership
Customer and Market Focus
Workforce Focus
Results
100
Strategic Planning
Total Points
ed TQM.
CHAPTER 6 MAN A G I N G QU A L I T Y 69
11. A Pareto chart’s purpose is to identify the critical problems
and separate them from the less important ones.
12. Ishikawa “causes”: material, machinery/equipment, methods,
13. Inspect at your supplier’s plant while the supplier is produc-
step-by-step production process, inspect when production or service
14. The design and delivery of service can make a difference in
the tangible components of service, containing the determinants of
service quality in the process design, managing expectations, and
15. Source inspection: consistent with the concept of employee
empowerment, individual employees self-check their work and
verify the work of the employee preceding them.
16. According to Berry, Zeithaml, and Parasuraman, the 10
determinants of service quality are:
17. If one adopts a definition of quality based upon “satisfying
stated or implied needs,” it is difficult to imagine any product that
would not be required to be of high quality.
18. The formula
2
L D C=
portrays a loss that increases at an
19. Counting the number of e’s in the OM in Action box:
in the list and last paragraph.
gu#st sits down for br#akfast?
Did th# wait#r mak# #y# contact?
W#r# Minibar charg#s post#d corr#ctly on th# bill?.
ar# part of th# TQM #ffort at th#s# hot#ls. Quality do#s not
happ#n by accid#nt.

70 CHAPTER 6 MA N A G IN G QU A L I T Y
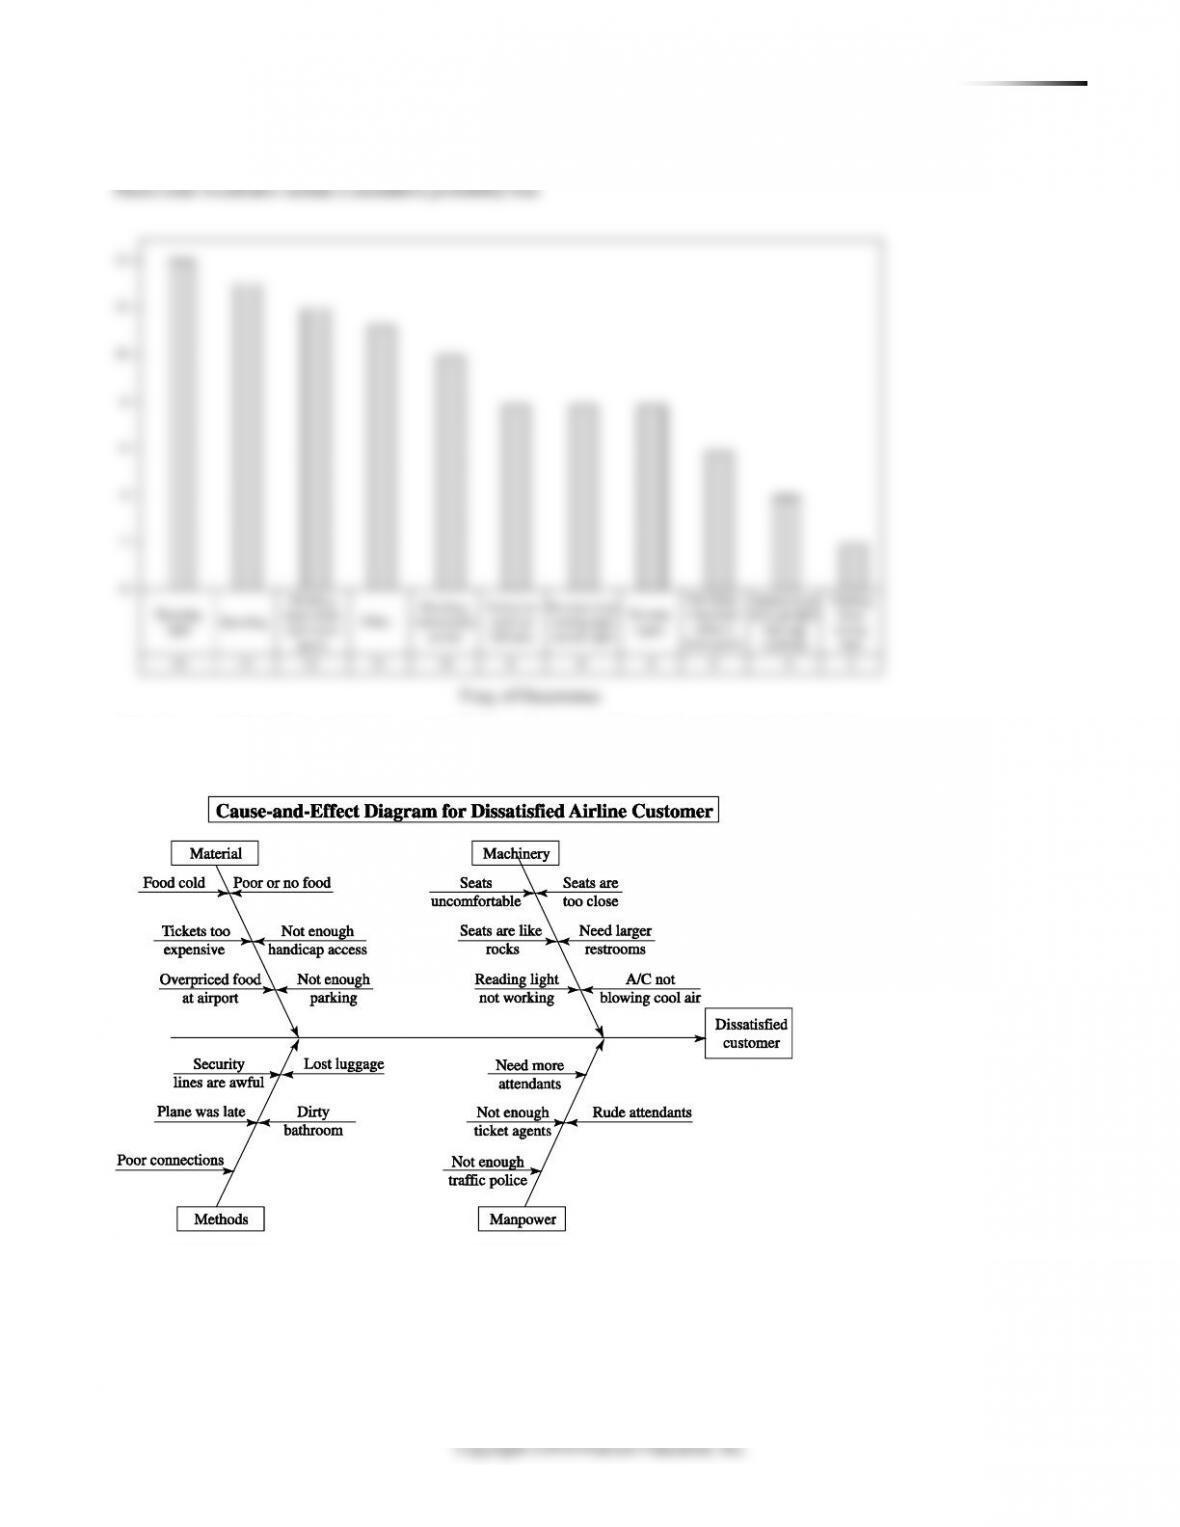
2. If we could reduce the room service complaints in half, how
does this affect the chart?
The bar for room service is cut in half. The cumulative
curve begins lower and has a steeper build.
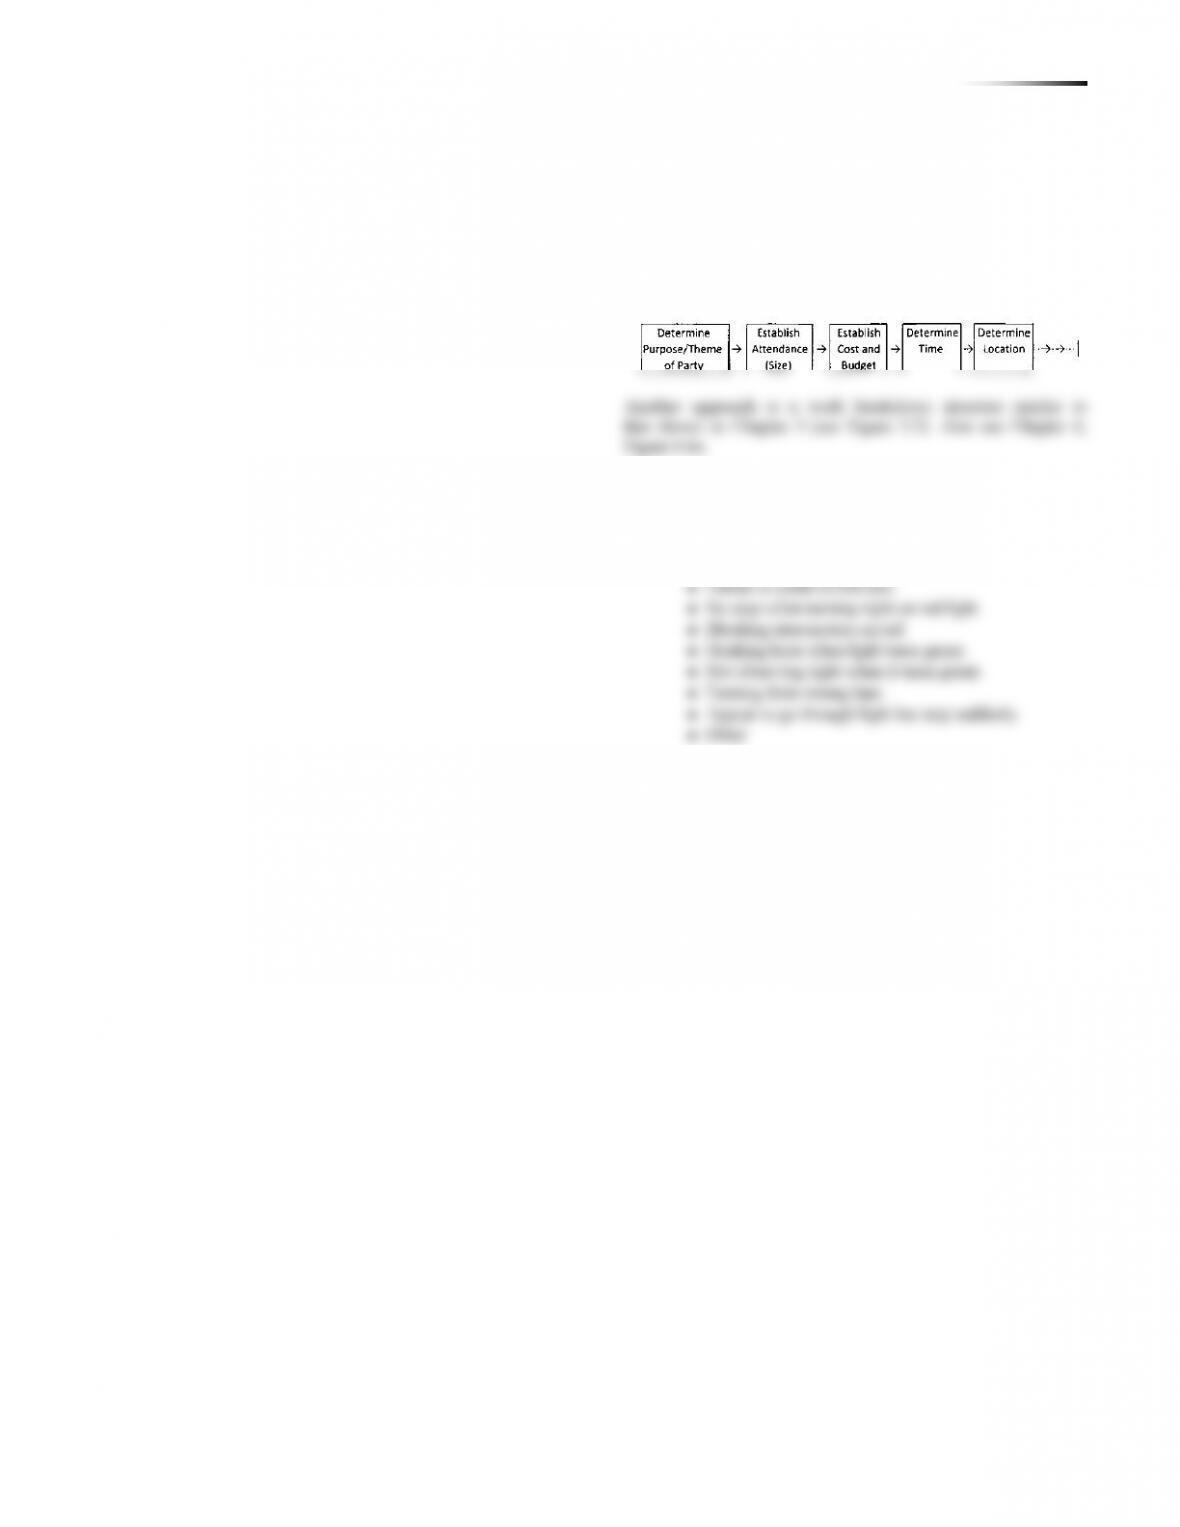
END–OF-CHAPTER PROBLEMS
6.1 (a)
6.2 The idea is to get students to seek out information via a
scatter diagram. For instance, a scatter diagram with pages of a
major city newspaper on the y-axis and day of the week on the
6.3 From these statistics, it would appear that a student could
argue that some of the cause of the poor grade was due to factors
primarily outside his/her control . . . and poor planning.
Reason for Poor Grade
Frequency
%
Difficulty understanding material
25
37
Insufficient time to complete
15
22
Distractions in exam room
9
13
Late arrival to exam
7
10
Felt ill during exam
4
6
Forgot exam was scheduled
3
4
Insufficient preparation time
2
3
Studied wrong material
2
3
Calculator batteries died during exam
1
1
6.4 Individual response, but we should have frequency on the
y–axis and time, perhaps in 15-second intervals at most fast-food
restaurants, on the x-axis.
*This Active Model can be found on our Web sites, and
www.pearsonhighered.com/heizer and www.myomlab.com.
72 CHAPTER 6 MA N A G IN G QU A L I T Y
Location: 2nd
Time of Day
and Forrester
Poor Driving
Habit
7:00–7:20 A.M.
10:00–10:20 A.M.
5:00–5:20 P.M.
7:30–7:50 P.M.
Total
Running light
14
Speeding
13
No turn signal
8
Failure to yield on
8
left turn
No stop when
8
turning right on red
light
Blocking
10
intersection on red
Honking horn
12
when light turns
green
Not observing light
6
when it turns green
Turning from
2
wrong lane
Appear to go
4
through light but
stop suddenly
Other
11
Check sheet might look like the following:
The frequency counts for this set of observations is shown on the
right. The check sheet can be used to discuss the differences in
driving habits at different times of the day.
Running light
Speeding
Honking horn when light turns green
Other
Blocking intersection on red
No stop when turning right on red light
No turn signal
Not observing light when it turns green
Appear to go through light but stop suddenly
Running light
Speeding
Honking horn when light turns green
Other
Blocking intersection on red
No stop when turning right on red light
No turn signal
Not observing light when it turns green
Appear to go through light but stop suddenly
Sorted Frequency Table
Poor Driving Habit
Frequency
CHAPTER 6 MAN A G I N G QU A L I T Y 73
A Pareto chart like the one shown below can illustrate the major habits that dominate the behavior. Note: A classic
Pareto chart would also include a cumulative probability line.
74 CHAPTER 6 MA N A G IN G QU A L I T Y
6.10 Student answers will depend upon how broadly they define
“registration.” (Is fee payment included? Is academic advising
included?) Manpower issues might include rudeness, lateness,
missing appointments, incompetence. Methods issues might
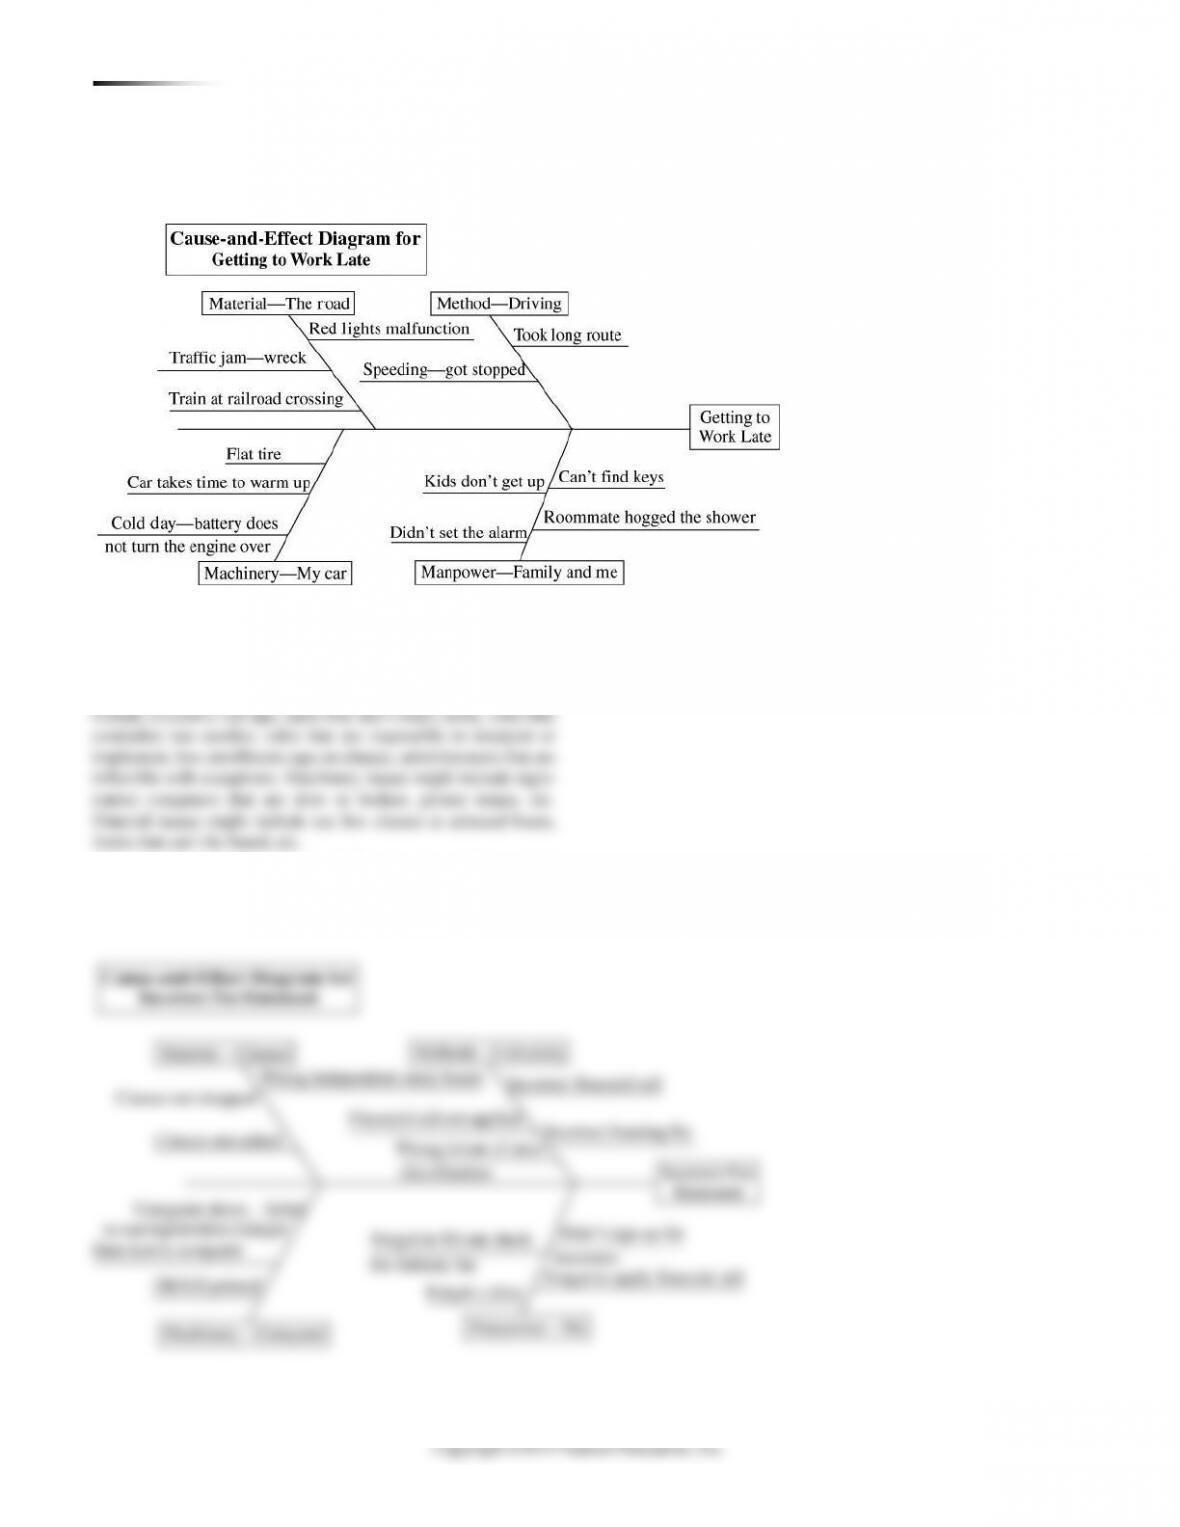
6.11 A potential chart might look like that shown below. Each
student will brainstorm different bones in the chart, depending on
the particular experiences and systems of the situation.
6.9 Depending on the type of student body, the response could
vary. A typical chart might look like the following:
CHAPTER 6 MAN A G I N G QU A L I T Y 69
11. A Pareto chart’s purpose is to identify the critical problems
and separate them from the less important ones.
12. Ishikawa “causes”: material, machinery/equipment, methods,
13. Inspect at your supplier’s plant while the supplier is produc-
step-by-step production process, inspect when production or service
14. The design and delivery of service can make a difference in
the tangible components of service, containing the determinants of
service quality in the process design, managing expectations, and
15. Source inspection: consistent with the concept of employee
empowerment, individual employees self-check their work and
verify the work of the employee preceding them.
16. According to Berry, Zeithaml, and Parasuraman, the 10
determinants of service quality are:
17. If one adopts a definition of quality based upon “satisfying
stated or implied needs,” it is difficult to imagine any product that
would not be required to be of high quality.
18. The formula
2
L D C=
portrays a loss that increases at an
19. Counting the number of e’s in the OM in Action box:
in the list and last paragraph.
gu#st sits down for br#akfast?
Did th# wait#r mak# #y# contact?
W#r# Minibar charg#s post#d corr#ctly on th# bill?.
ar# part of th# TQM #ffort at th#s# hot#ls. Quality do#s not
happ#n by accid#nt.
70 CHAPTER 6 MA N A G IN G QU A L I T Y
2. If we could reduce the room service complaints in half, how
does this affect the chart?
The bar for room service is cut in half. The cumulative
curve begins lower and has a steeper build.
END–OF-CHAPTER PROBLEMS
6.1 (a)
6.2 The idea is to get students to seek out information via a
scatter diagram. For instance, a scatter diagram with pages of a
major city newspaper on the y-axis and day of the week on the
6.3 From these statistics, it would appear that a student could
argue that some of the cause of the poor grade was due to factors
primarily outside his/her control . . . and poor planning.
Reason for Poor Grade
Frequency
%
Difficulty understanding material
25
37
Insufficient time to complete
15
22
Distractions in exam room
9
13
Late arrival to exam
7
10
Felt ill during exam
4
6
Forgot exam was scheduled
3
4
Insufficient preparation time
2
3
Studied wrong material
2
3
Calculator batteries died during exam
1
1
6.4 Individual response, but we should have frequency on the
y–axis and time, perhaps in 15-second intervals at most fast-food
restaurants, on the x-axis.
*This Active Model can be found on our Web sites, and
www.pearsonhighered.com/heizer and www.myomlab.com.
72 CHAPTER 6 MA N A G IN G QU A L I T Y
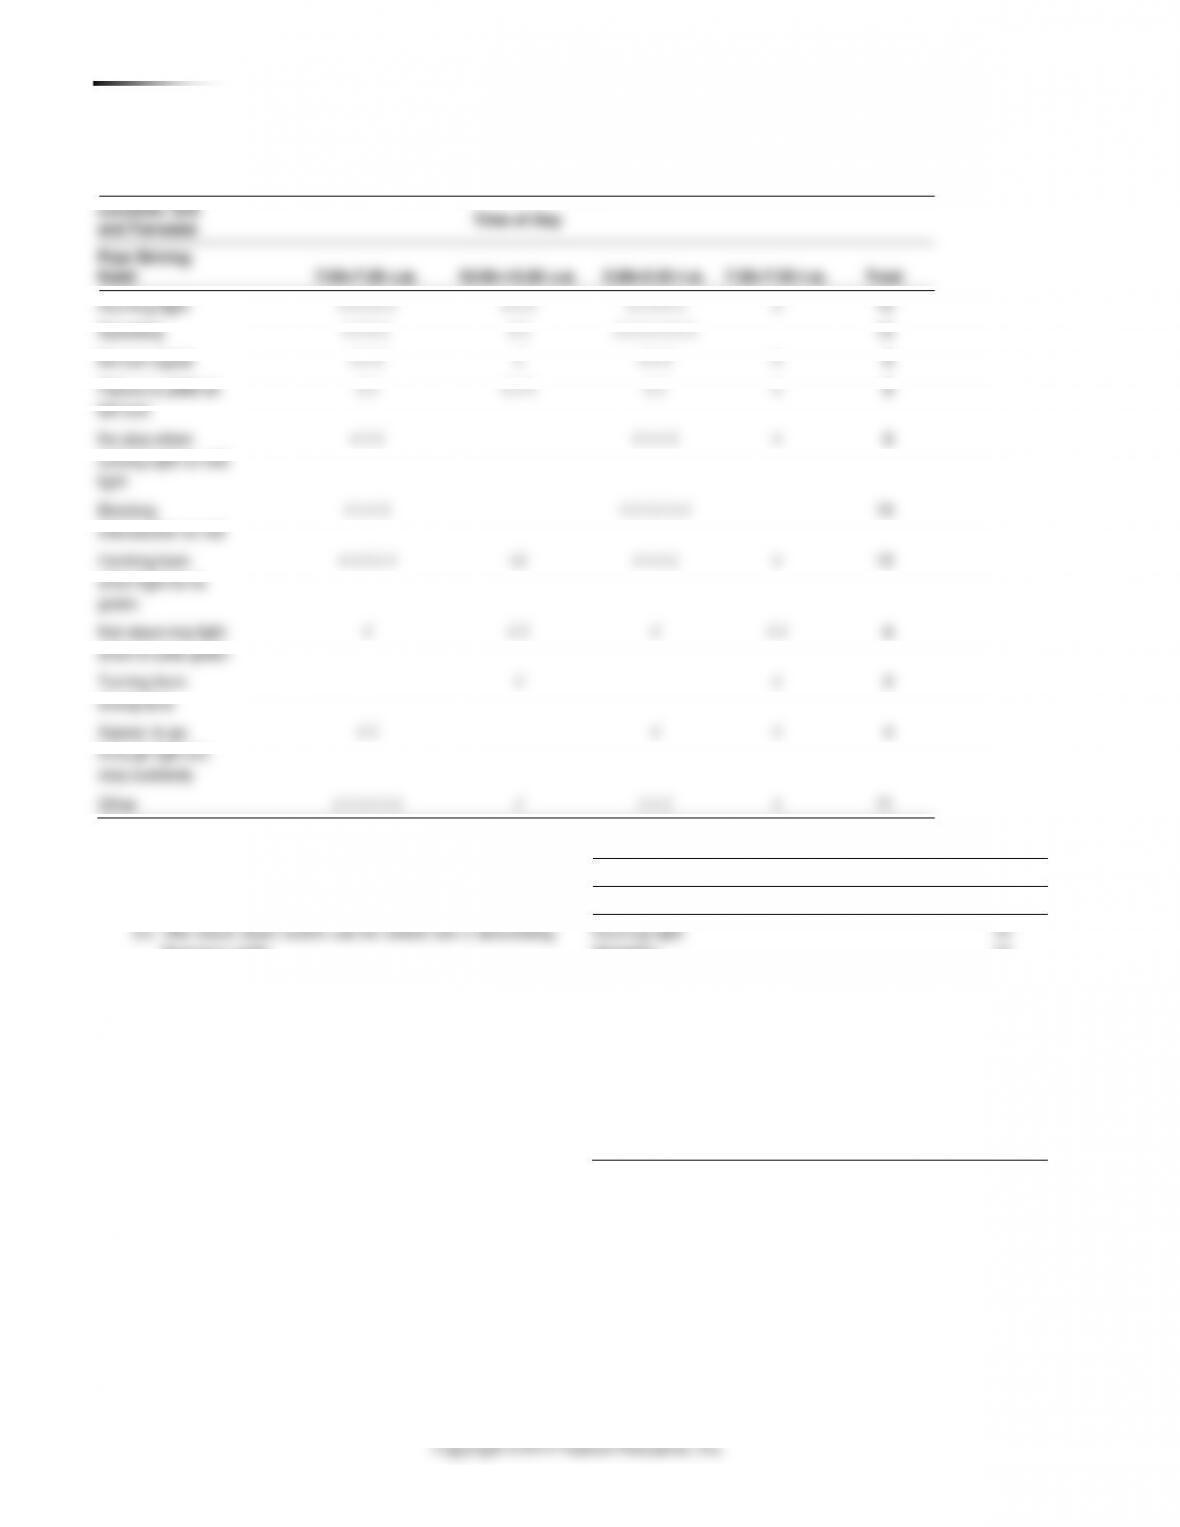
Location: 2nd
Time of Day
and Forrester
Poor Driving
Habit
7:00–7:20 A.M.
10:00–10:20 A.M.
5:00–5:20 P.M.
7:30–7:50 P.M.
Total
Running light
14
Speeding
13
No turn signal
8
Failure to yield on
8
left turn
No stop when
8
turning right on red
light
Blocking
10
intersection on red
Honking horn
12
when light turns
green
Not observing light
6
when it turns green
Turning from
2
wrong lane
Appear to go
4
through light but
stop suddenly
Other
11
Check sheet might look like the following:
The frequency counts for this set of observations is shown on the
right. The check sheet can be used to discuss the differences in
driving habits at different times of the day.
Sorted Frequency Table
Poor Driving Habit
Frequency
CHAPTER 6 MAN A G I N G QU A L I T Y 73
A Pareto chart like the one shown below can illustrate the major habits that dominate the behavior. Note: A classic
Pareto chart would also include a cumulative probability line.
74 CHAPTER 6 MA N A G IN G QU A L I T Y
6.10 Student answers will depend upon how broadly they define
“registration.” (Is fee payment included? Is academic advising
included?) Manpower issues might include rudeness, lateness,
missing appointments, incompetence. Methods issues might
6.11 A potential chart might look like that shown below. Each
student will brainstorm different bones in the chart, depending on
the particular experiences and systems of the situation.
6.9 Depending on the type of student body, the response could
vary. A typical chart might look like the following: