13
C H A P T E R
Aggregate Planning
1. Sales and Operations Planning (S&OP) balances resources
and forecast demand and aligns the organization’s competing
smooth fluctuations in work force, drive down inventory levels for
time-sensitive stock, and meet a high level of service regardless of
6. With a chase strategy, production rates or workforce levels are
adjusted to match demand requirements over the planning horizon.
7. Level scheduling is an aggregate plan in which daily
capacities are uniform from month to month. The underlying
philosophy is that stable employment leads to better quality, less
8. Mixed strategy is a planning approach in which two or more
options, such as overtime, subcontracting, hiring and layoff, etc.,
■ Most services are perishable and cannot be inventoried.
It is virtually impossible to produce the service early in
anticipation of higher demand at a later time.
11. The master production schedule (MPS) is produced by
disaggregating the aggregate plan.
13. Limitations of the transportation method include that it does
not work well when one attempts to include the effect of hiring
and layoffs in the model.
14. Revenue (yield) management adds another set of decisions
to the aggregate plan, to capacity planning, and to scheduling.
may be the one least affected. Auto rental companies, airlines, and
hotels now all vary “inventory” (autos, seats, rooms) and prices to
188 CHAPTER 13 AG G R E G A T E PLANNING
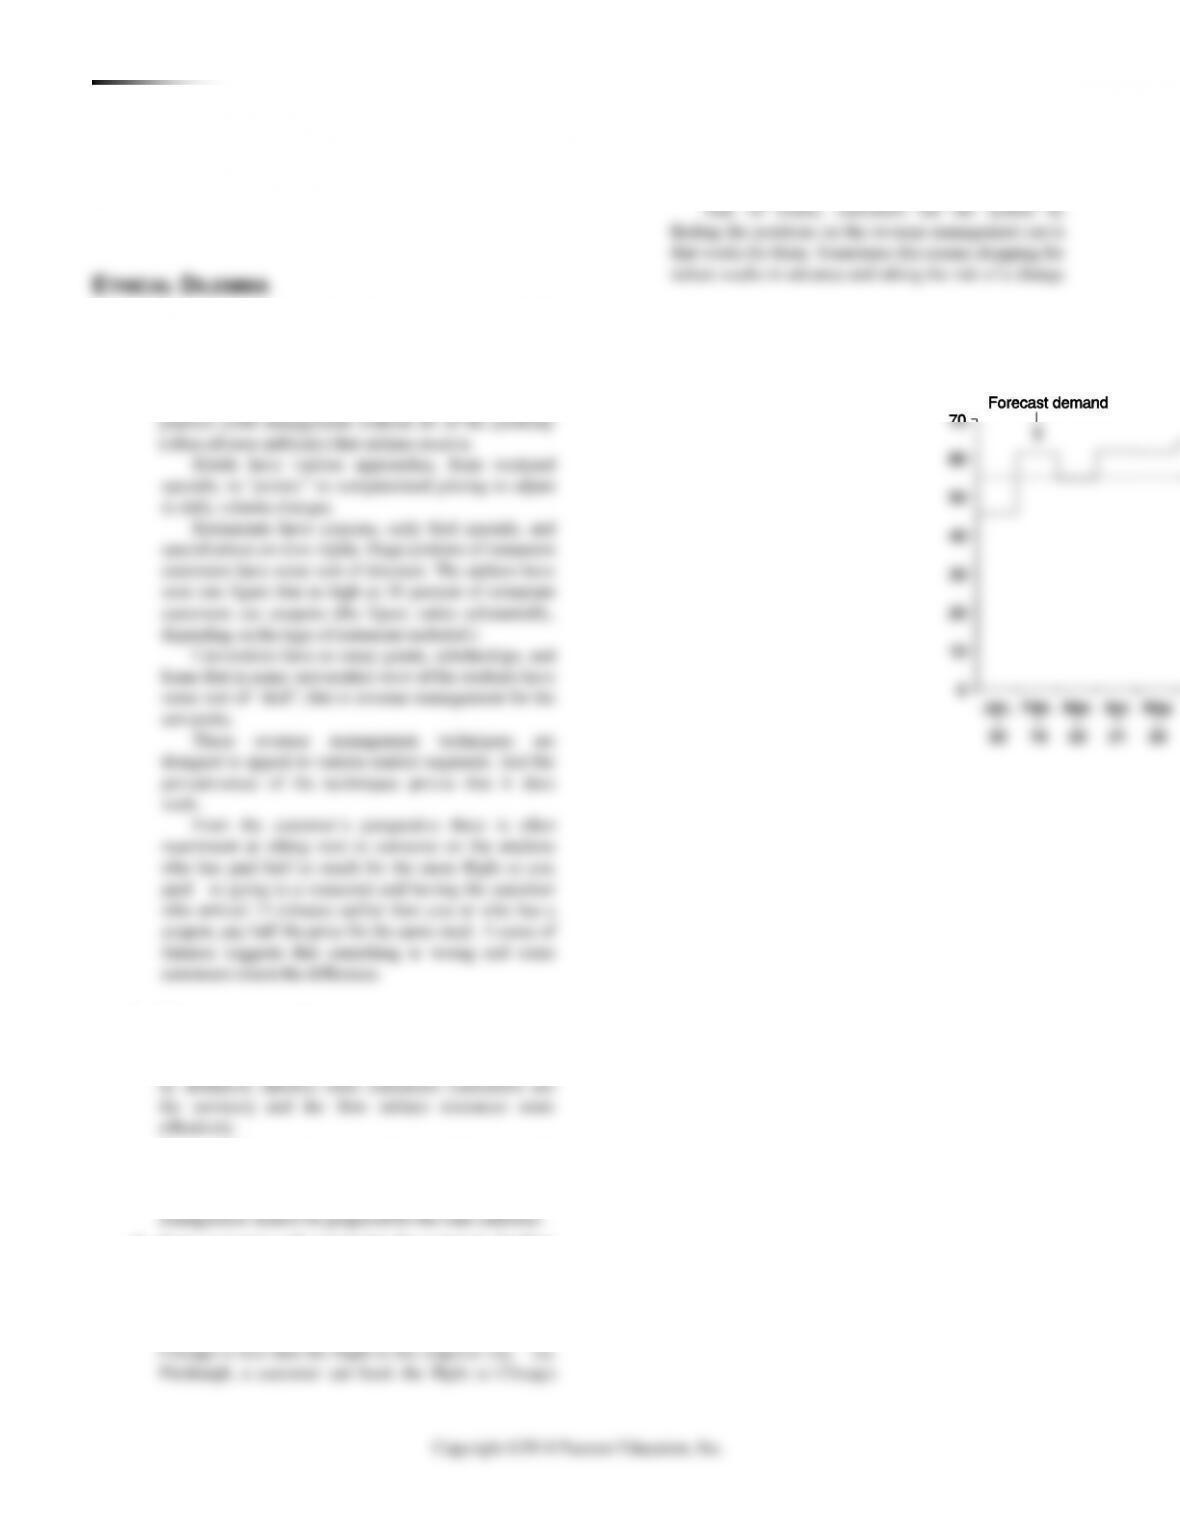
1. From the airline’s point of view, revenue (yield)
management is crucial. Moreover, many firms, including
hotels, restaurants, and universities, practice revenue
management. A good class discussion can be generated
by asking students to discuss how other organizations
2. Most customers have come to accept revenue
management and take full advantage of the opportunities
it affords. The multiple pricing of revenue management
3. Many customers take exception to the
variation in pricing—different prices for the same
service seem inherently wrong to many people and
4. Some customers will manipulate the system by booking
tickets on flights that have a stopover in a city they
travel to, but which has a higher fare than the destination
flight. They exit the plane at the stopover city—saving
money. For instance, if the flight from New York to
Chicago is less than the flight to the stopover city—say
Pittsburgh, a customer can book the flight to Chicago
but get off in Pittsburgh. You might ask students to
discuss the ethics of this manipulation.

Copyright ©2014 Pearson Education, Inc.
1. Each worker makes five units per day. If the number of
workers is reduced from 10 to 9, dropping the daily capacity, what
happens to the cost?
2. What regular time level minimizes the total cost?
39 units
3. How low can the regular daily capacity get before overtime
will be required?
At 22 units per day (4.4 workers), overtime is required.
4. How low can the regular daily capacity get before there will
not be enough capacity to meet the demand?
At 12 units per day (2.4 workers), demand cannot be met.
END–OF-CHAPTER PROBLEMS
13.1
Month
Production
Days
Forecast
Demand
Needed
Production
Each Day
Jan
22
1,000
45.5
Feb
18
1,100
61.1
Mar
22
1,200
54.5
Apr
21
1,300
61.9
May
22
1,350
61.4
Jun
21
1,350
64.3
July
21
1,300
61.9
Aug
22
1,200
54.5
Sep
21
1,100
52.4
Oct
22
1,100
50.0
Nov
20
1,050
52.5
Dec
20
900
45.0
252
13,950
55.4
(on average)
190 CHAPTER 13 AG G R E G A T E PLANNING
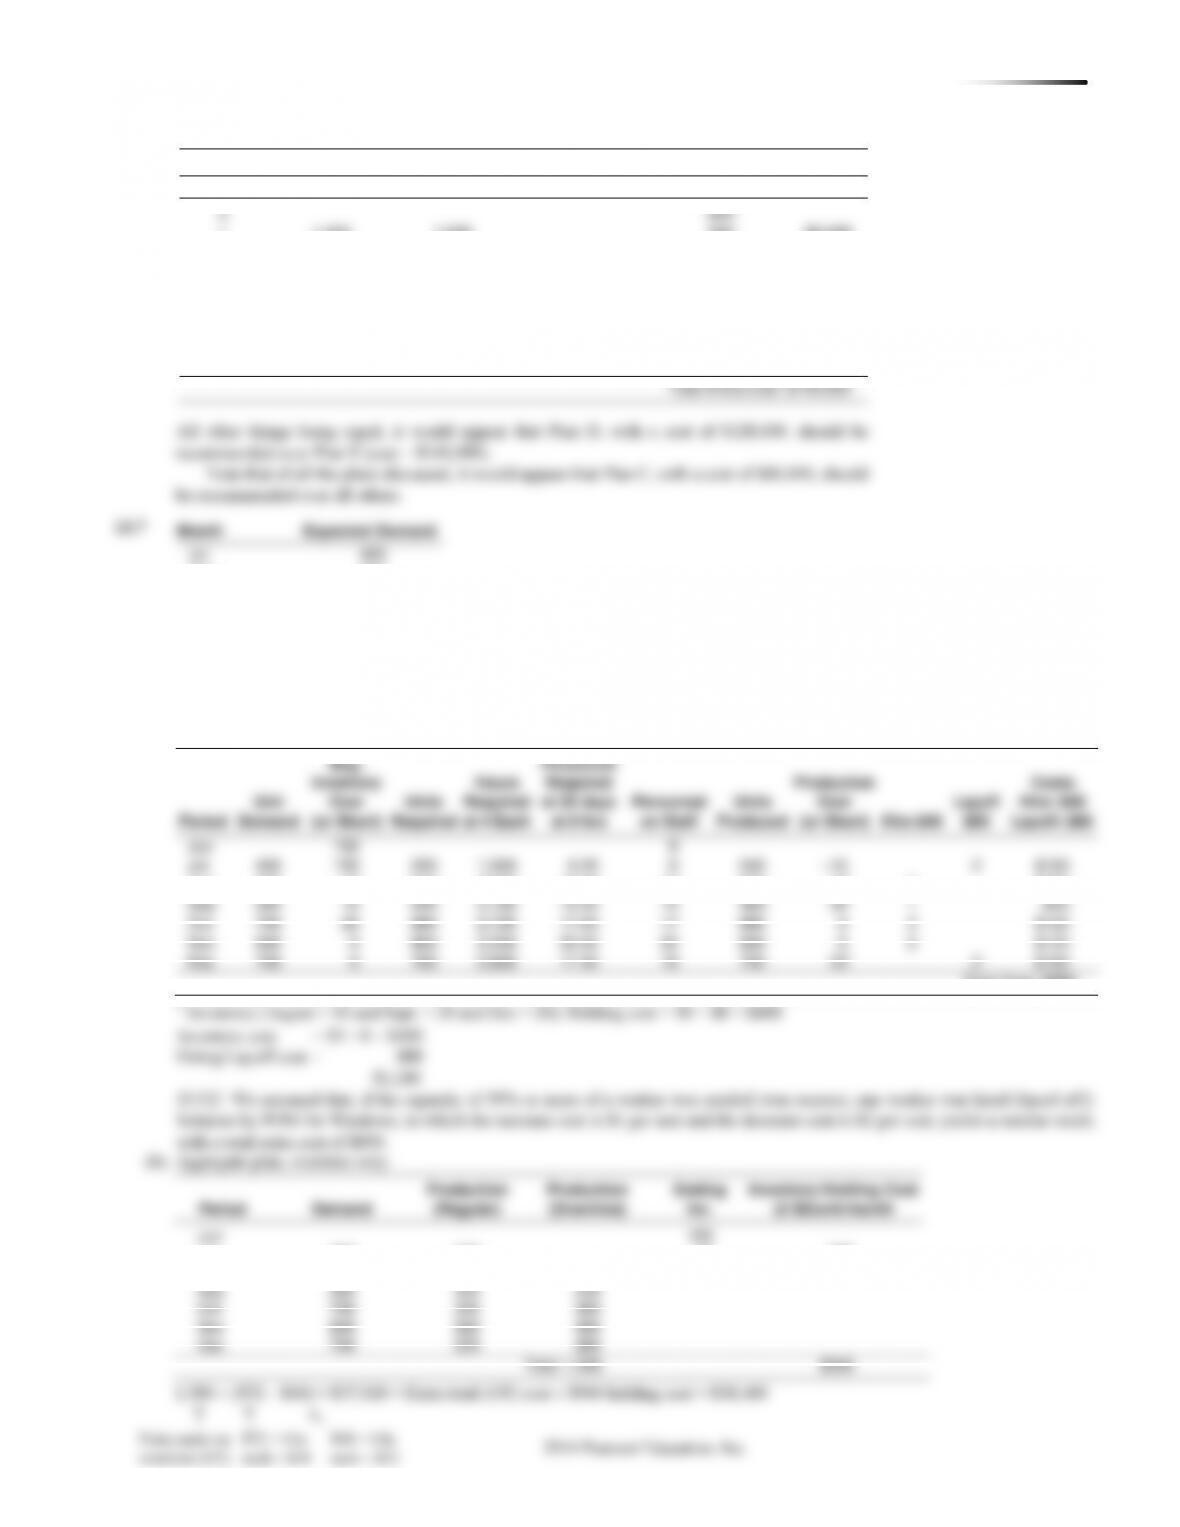
13.2 (a) Plan 5
Month
Expected
Demand
Production
Days
Demand
Per Day
Jan
900
22
41
Feb
700
18
39
Mar
800
21
38
Apr
1,200
21
57
May
1,500
22
68
Jun
1,100
20
55
6,200
124
=6,200
Average daily production requirement 124
= 50 units/day
Constant workforce of 6 persons; subcontract to meet
extra demand: Subcontract cost = $20/unit
Hours/day
Production rate/day Persons Hours/unit
8
6 30 units/day
Expected
Production
Jan
660
240
Mar
630
170
Apr
1,200
630
570
May
1,500
660
Jun
1,100
600
2,480
Carrying
cost
0
Reg. time
Overtime
0
Subcont.
0
Hire
0
0
Layoff
0
0
Total cost
113,488
1,400
1,600
1,800
1,800
2,200
2,200
1,800
Expected
Production
Jan
660
240
Mar
630
170
Apr
1,200
630
570
May
1,500
660
Jun
1,100
600
2,480
Carrying
cost
0
Reg. time
Overtime
0
Subcont.
0
Hire
0
0
Layoff
0
0
Total cost
113,488
1,400
1,600
1,800
1,800
2,200
2,200
1,800
=
= =
Month
Expected
Demand
Production
(@ 35/day)
Subcontract
Jan
900
770
130
Feb
700
630
70
Mar
800
735
65
Apr
1,200
735
465
May
1,500
770
730
Jun
1,100
700
400
1,860
Plan 6 cost analysis:
Regular production:
= =7persons $80 124 $69,440
R
C
Subcontracting:
= =1,860 units $20 $37,200
SC
C
Total cost:
69,440 37,200 = $106,640
T
C=+
(c) Plan 2 is still preferable, but Plan 6 has lower cost than Plan 5.
CHAPTER 13 AG G R E G A T E PL A N N I N G 191
0
1
1,400
1,400
$4,000
2
1,600
1,400
3
1,800
1,400
30,000
4
1,800
1,400
30,000
5
2,200
1,400
7
1,800
1,400
30,000
8
1,800
1,400
30,000
0
1
1,400
1,400
$4,000
2
1,600
1,400
3
1,800
1,400
30,000
4
1,800
1,400
30,000
5
2,200
1,400
7
1,800
1,400
30,000
8
1,800
1,400
30,000
13.5 (a)
2
1,600
1,825
850
17,000
3
1,800
1,825
875
17,500
4
1,800
1,825
900
22,500
5
2,200
1,825
525
11,000
6
2,200
1,825
150
3,000
7
1,800
1,825
3,500
2
1,600
1,825
850
17,000
3
1,800
1,825
875
17,500
4
1,800
1,825
900
22,500
5
2,200
1,825
525
11,000
6
2,200
1,825
150
3,000
7
1,800
1,825
3,500
13.3 (cont’d)
Plan A
Production
(Demand of
Previous
Inventory
Stockout
Hire
Layoff
Personnel
Period
Demand
Month)
(Units)
(Units)
(Units)
(Units)
Cost
(Dec)
1,600
200
1 (Jan)
1,400
1,600
400
2 (Feb)
1,600
1,400
200
200
$15,000 (cost to go from 1,600 in Jan to 1,400 in Feb)
3 (Mar)
1,800
1,600
200
10,000 (cost to go from 1,400 in Feb to 1,600 in Mar)
4 (Apr)
1,800
1,800
200
10,000 (cost to go from 1,600 in March to 1,800 in April)
5 (May)
2,200
1,800
400
6 (June)
2,200
2,200
400
20,000 (cost to go from 1,800 in May to 2,200 in June)
7 (July)
1,800
2,200
400
8 (Aug)
1,800
1,800
400
400
30,000 (cost to go from 2,200 in July to 1,800 in Aug)
1,400
400
$85,000 Total Personnel Cost
@ $20
@ $100
=$28,000
=$40,000
Note: December demand was 1,600, and because our strategy is chasing prior-period demand, our January production is 1,600. So 200 units remain in
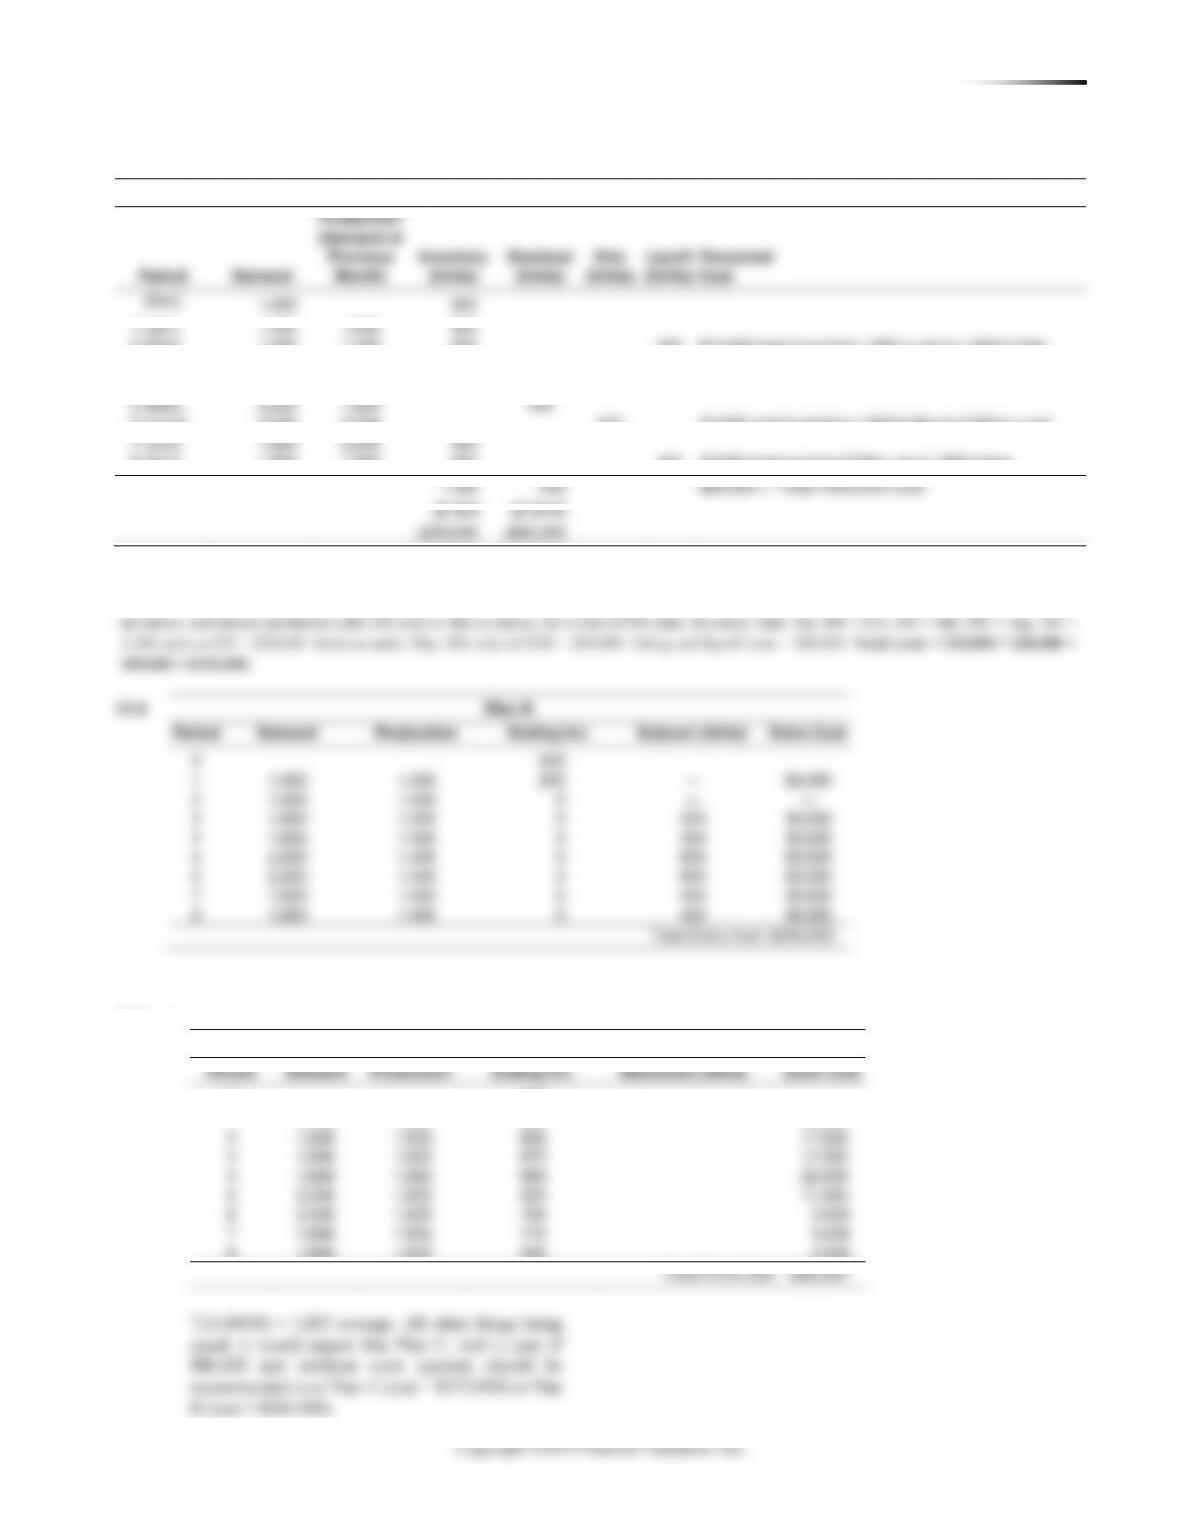
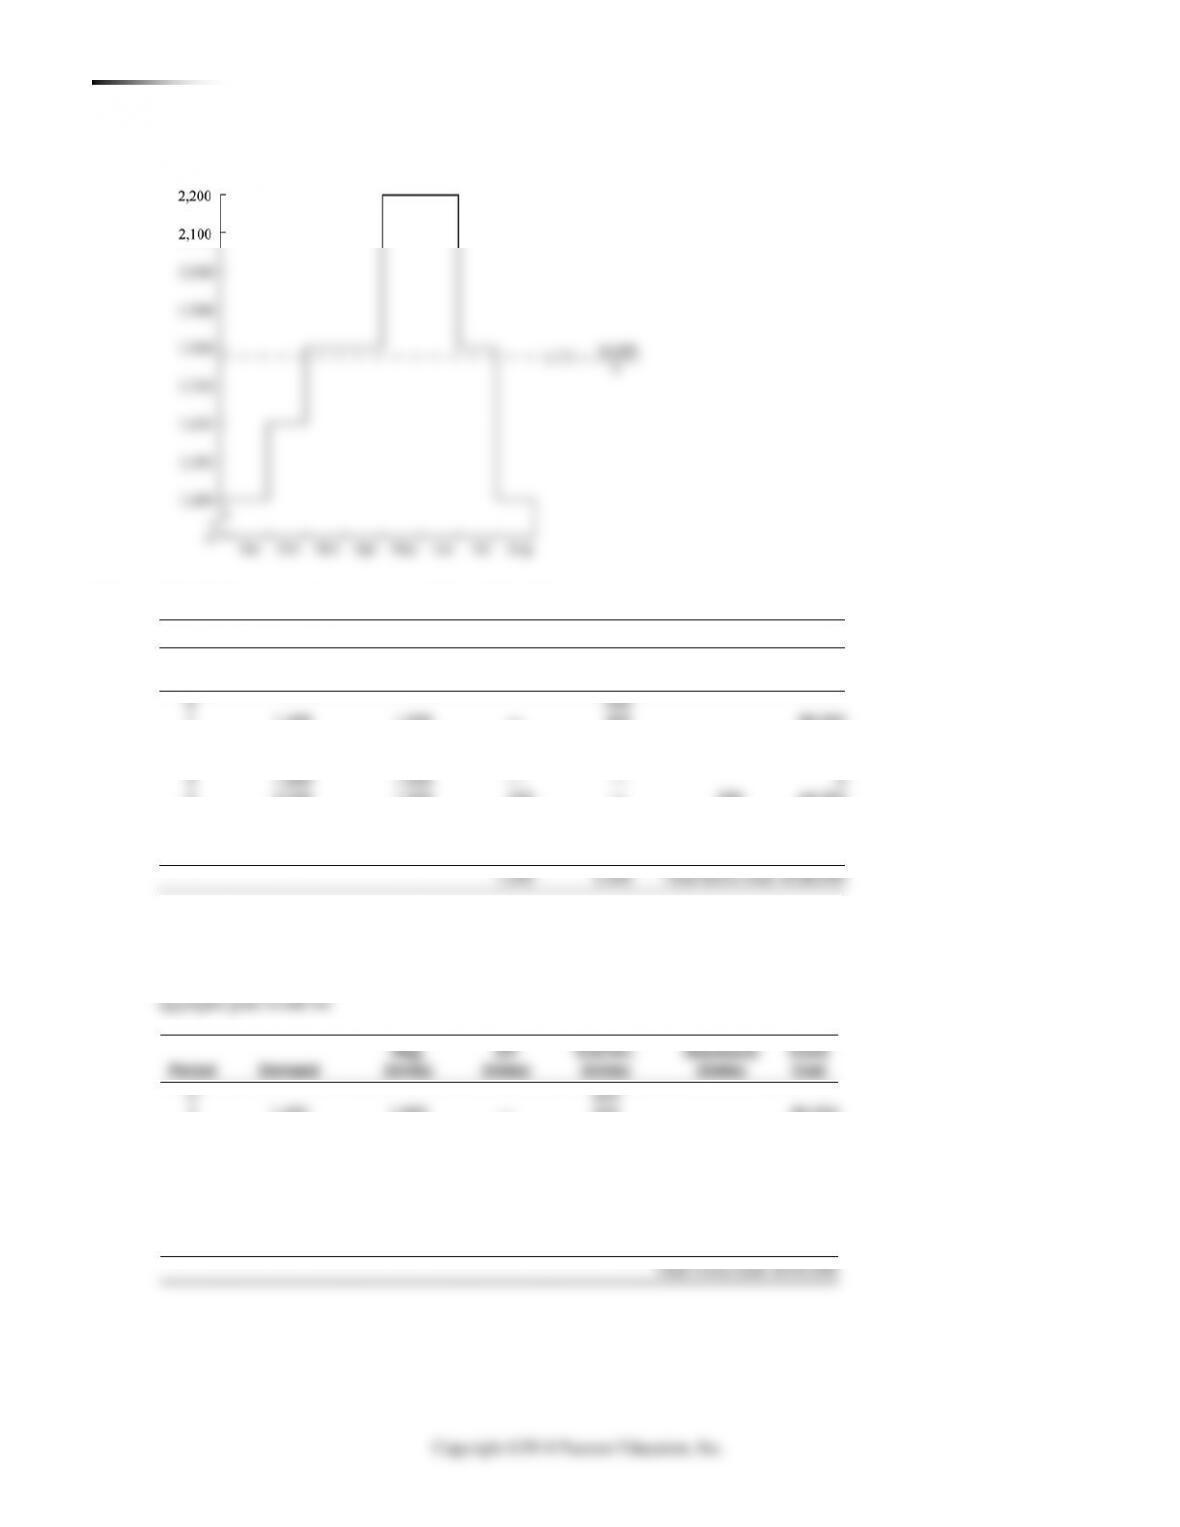
Plan C
Period
Demand
Production*
Ending Inv.
Stockouts (Units)
Extra Cost
0
200
1
1,400
1,825
625
12,500
8
1,800
1,825
200
4,000
Total Extra Cost: $86,000
*(14,600/8) = 1,825 average. All other things being
equal, it would appear that Plan C, with a cost of
$86,000 and stockout costs ignored, should be
recommended over Plan A (cost = $153,000) or Plan
B (cost = $244,000).
192 CHAPTER 13 AG G R E G A T E PLANNING
(b) Graph of Plan C
13.6 (a) Plan D: Maximum units in overtime = 0.20 1,600 = 320
Noting that the additional cost of a stockout is much
greater than the sum of the additional costs for overtime
plus inventory storage, one might “look ahead” and
schedule overtime where possible. The resulting
Stockouts
Extra
Period
Demand
(Units)
(Units)
0
200
1
400
2
400
3
280
4
320
5
320
120
6
320
160
7
200
8
200
Stockouts
Extra
Period
Demand
(Units)
(Units)
0
200
1
400
2
400
3
280
4
320
5
320
120
6
320
160
7
200
8
200
Plan D
Reg.
OT
End Inv.
Stockouts
Extra
Period
Demand
(Units)
(Units)
(Units)
(Units)
Cost
0
200
1
1,400
1,600
—
400
$8,000
2
1,600
1,600
—
400
8,000
3
1,800
1,600
—
200
4,000
4
1,800
1,600
—
—
0
5
2,200
1,600
320
—
280
44,000
6
2,200
1,600
320
—
280
44,000
7
1,800
1,600
200
—
10,000
8
1,800
1,600
200
—
10,000
1,040
1,000
Total Extra Cost: $128,000
Production
Production
Inventory Holding Cost
150
Production
Production
Inventory Holding Cost
150
or 40 disks per month.
(a) Aggregate plan, hiring/layoff only:
Beg.
Personnel
Inventory
Hours
Required
Production
Costs
Unit
Over
Units
Required
at 20 days
Personnel
Units
Over
Layoff
Hire: $40
Period
Demand
(or Short)
Required
at 4 Each
at 8 hrs
on Staff
Produced
(or Short)
Hire $40
$80
Layoff: $80
Jun
150
8
Jul
400
150
250
1,000
6.25
6
240
–10
2
$160
Aug
500
–10
510
2,040
12.75
13
520
10*
7
$280
Sep
550
10
540
2,160
13.50
14
560
20*
1
$40
Oct
700
20
680
2,720
17.00
17
680
0
3
$120
Nov
800
0
800
3,200
20.00
20
800
0
3
$120
Dec
700
0
700
2,800
17.50
18
720
20*
2
$160
Total Cost: $880
* Inventory (August = 10 and Sept. = 20 and Dec = 20): Holding cost = 50 × $8 = $400
Inventory cost = 50 × 8 = $400
Hiring/Layoff cost = 880
200
1,400
1,600
400
1,600
1,600
400
8,000
1,800
1,600
200
4,000
1,800
1,600
2,200
1,600
45,000
2,200
1,600
45,000
1,800
1,600
15,000
1,800
1,600
15,000
200
1,400
1,600
400
1,600
1,600
400
8,000
1,800
1,600
200
4,000
1,800
1,600
2,200
1,600
45,000
2,200
1,600
45,000
1,800
1,600
15,000
1,800
1,600
15,000
194 CHAPTER 13 AG G R E G A T E PLANNING
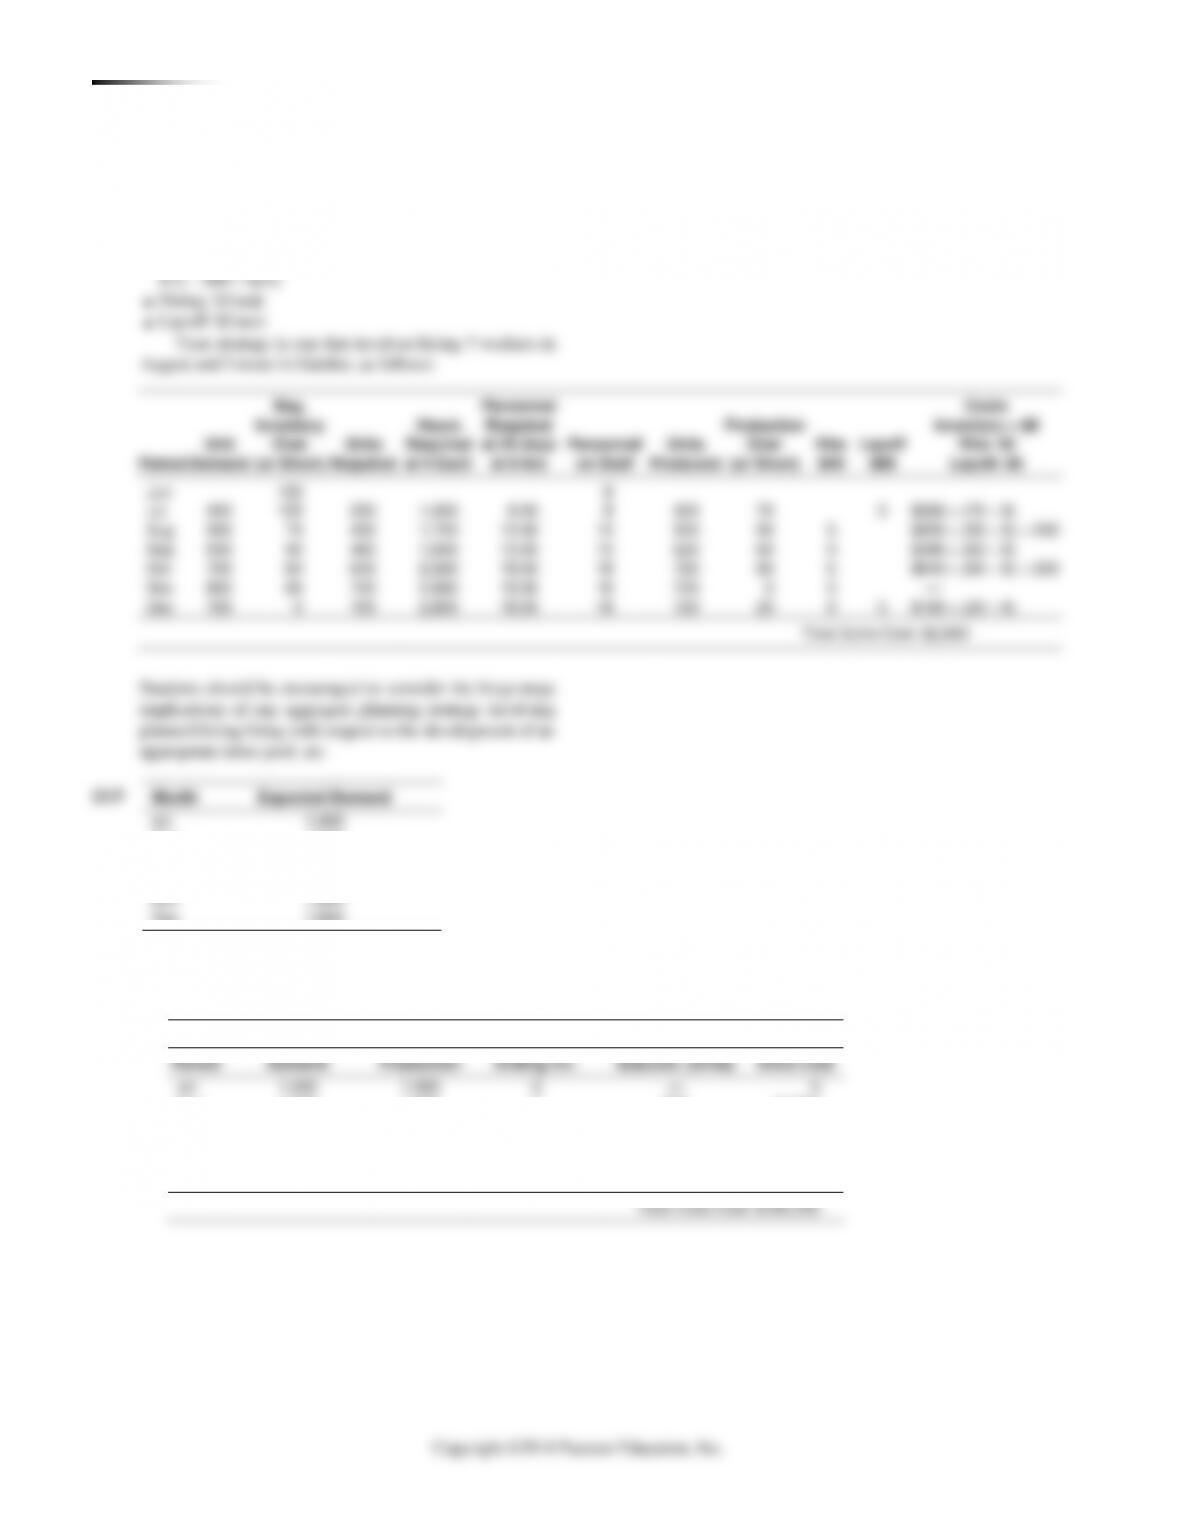
13.8 Calculating added costs for various planning options to
complement Problem 13.7:
■ Holding: $8/unit/month
■ Subcontracting: $80/unit
■ Overtime: $24/unit ($18/hour over 8 hours:
13.9
Nov
1,800
Jul
Aug
Sep
Oct
Nov
Dec
Nov
1,800
Jul
Aug
Sep
Oct
Nov
Dec
Month
Expected Demand
Jul
1,000
Aug
1,200
Sep
1,400
Oct
1,800
Copyright ©2014 Pearson Education, Inc.
196 CHAPTER 13 AG G R E G A T E PLANNING
■ Hiring: $30/unit
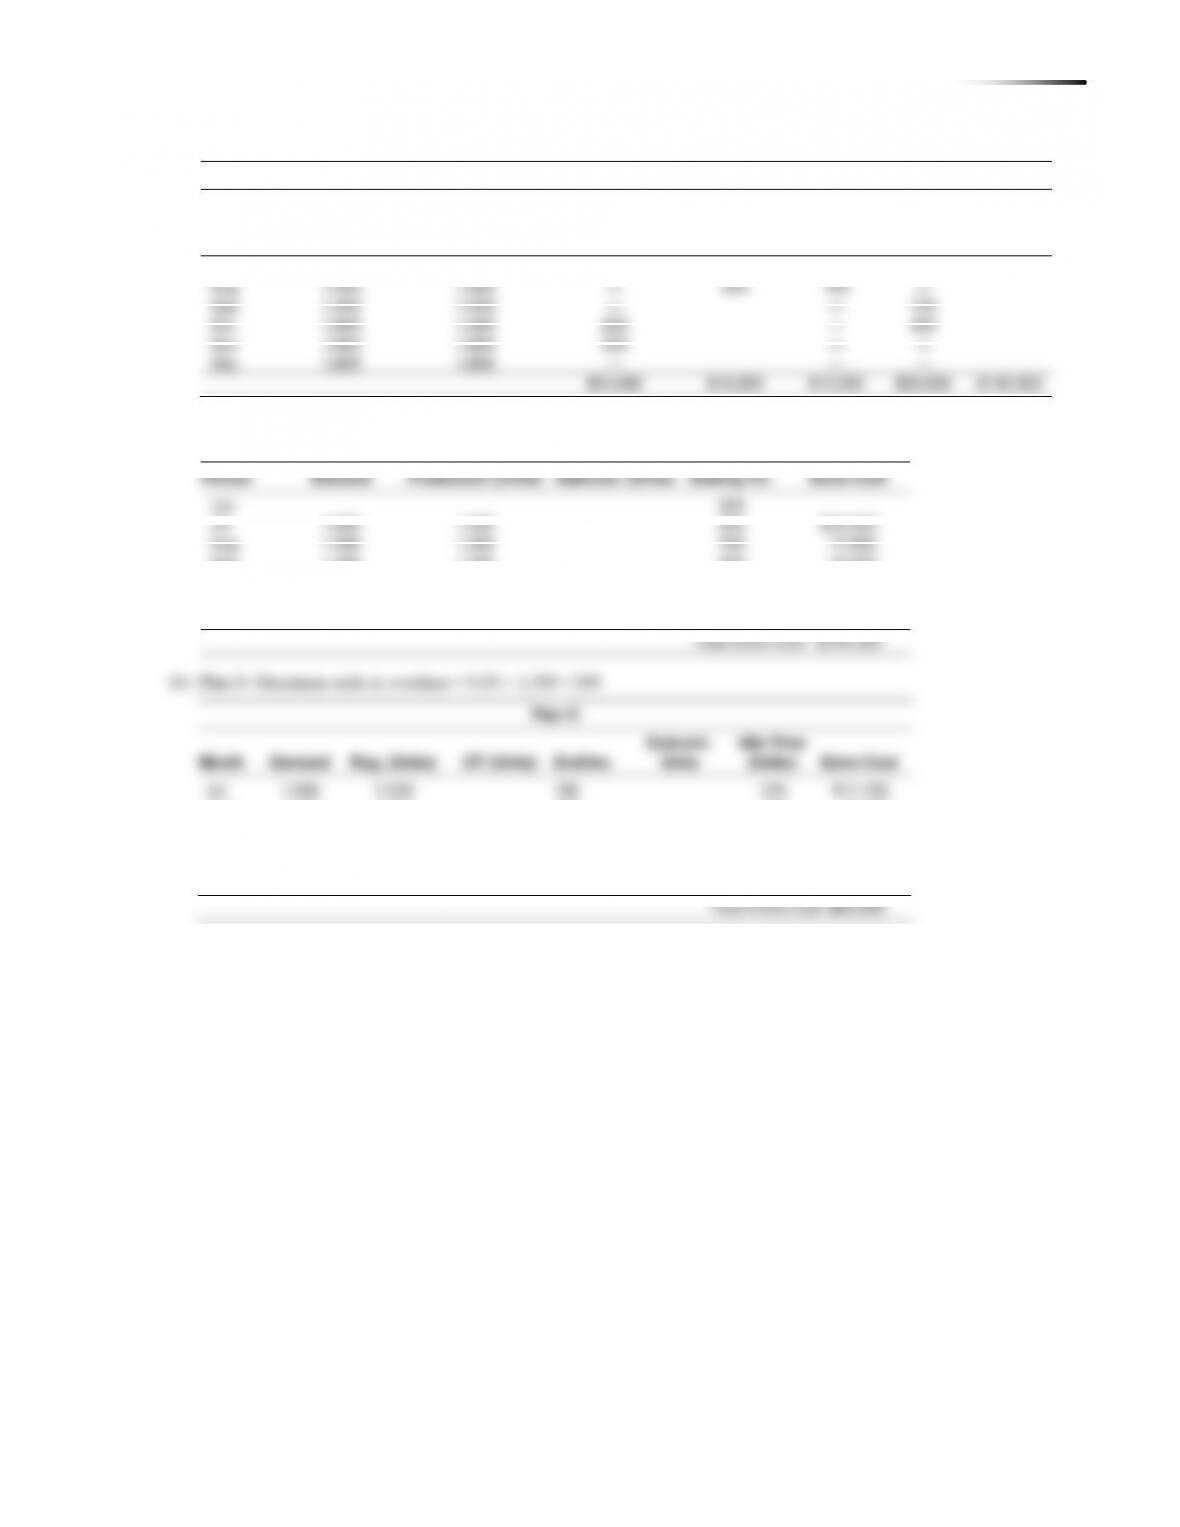
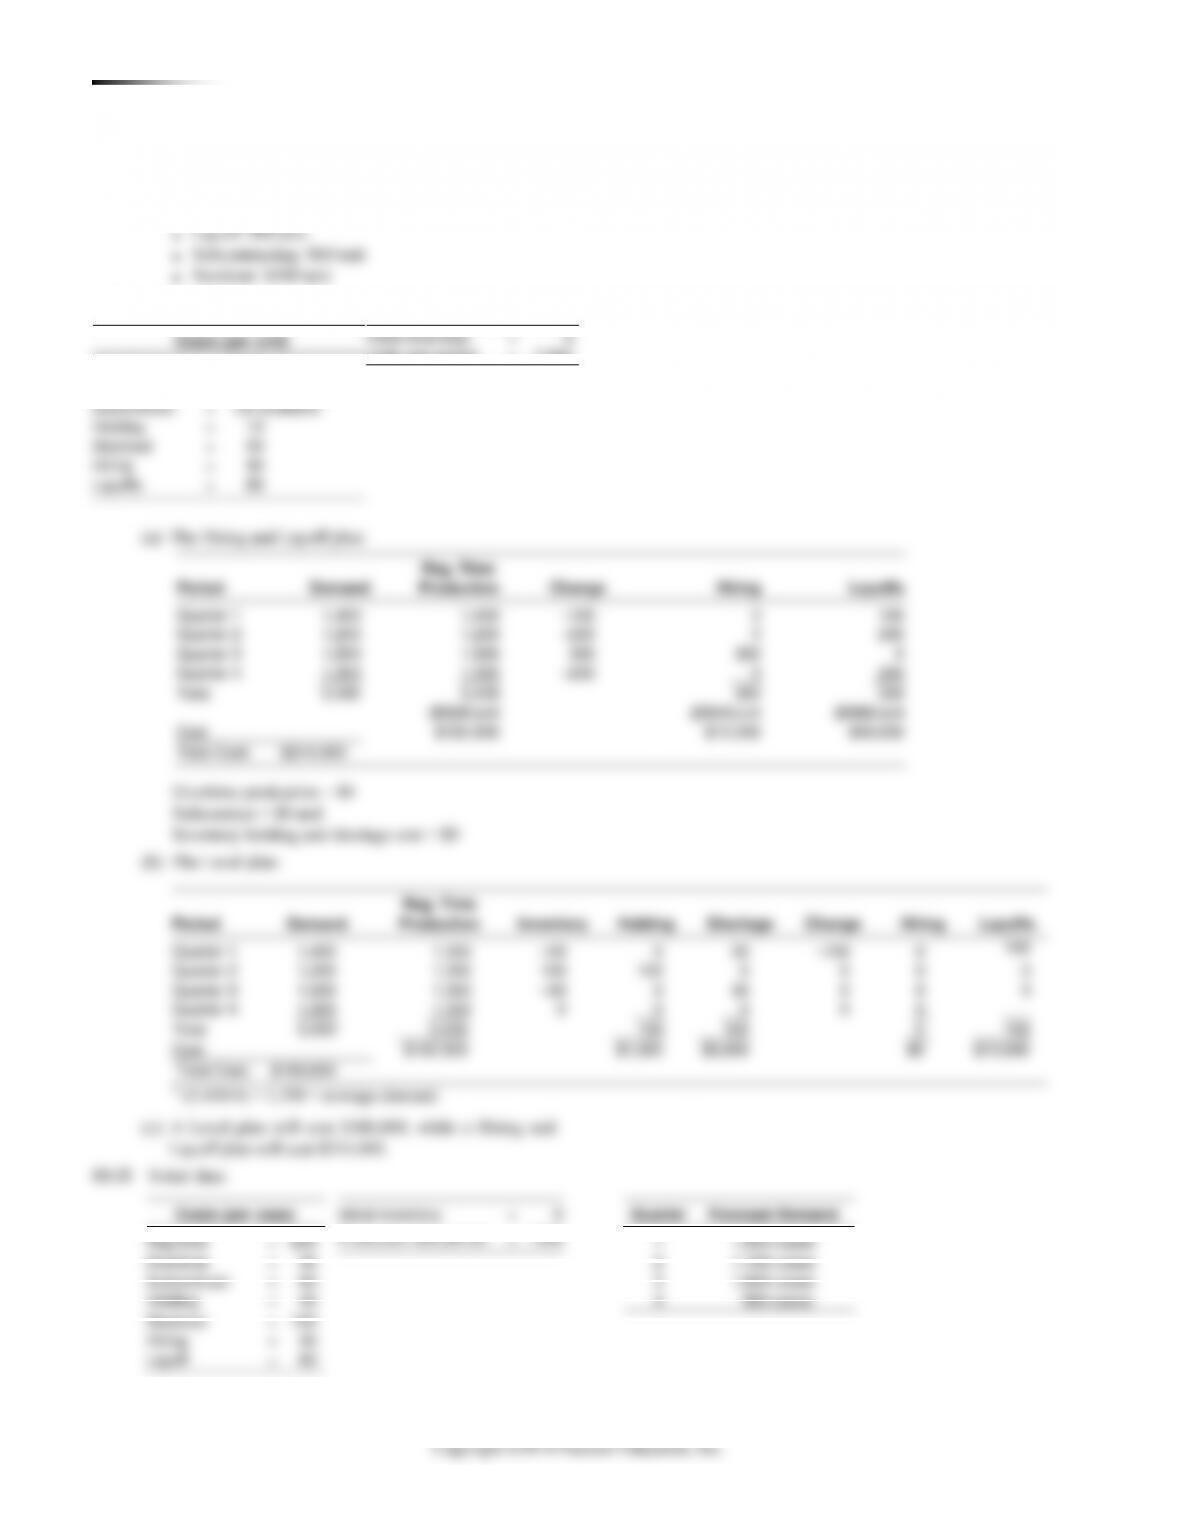
13.11 Initial data:
Subcontract
=
not available
Holding
=
Stockout
=
50
Hiring
=
40
Layoffs
=
Production
Quarter 1
Quarter 2
Quarter 3
Quarter 4
Total
0
Cost
$12,000
Quarter 1
Quarter 2
Quarter 3
Quarter 4
Total
$162,000
Total Cost: $214,000
Subcontract
=
not available
Holding
=
Stockout
=
50
Hiring
=
40
Layoffs
=
Production
Quarter 1
Quarter 2
Quarter 3
Quarter 4
Total
0
Cost
$12,000
Quarter 1
Quarter 2
Quarter 3
Quarter 4
Total
$162,000
Total Cost: $214,000
13.12 Initial data:
Subcontract
=
60
3
1,600 cases
Holding
=
40
4
Stockout
=
150
Subcontract
=
60
3
1,600 cases
Holding
=
40
4
Stockout
=
150
Costs (per unit)
Reg Time
=
$ 30
Overtime
=
$ 15 extra per unit
Initial inventory
=
0
Units last period
=
1,500
Costs (per case)
Initial inventory
=
0
Quarter
Forecast Demand
Reg time
=
$30
Production last period
=
1300
1
1,800 cases
Overtime
=
45
2
1,100 cases
188 CHAPTER 13 AG G R E G A T E PLANNING
1. From the airline’s point of view, revenue (yield)
management is crucial. Moreover, many firms, including
hotels, restaurants, and universities, practice revenue
management. A good class discussion can be generated
by asking students to discuss how other organizations
2. Most customers have come to accept revenue
management and take full advantage of the opportunities
it affords. The multiple pricing of revenue management
3. Many customers take exception to the
variation in pricing—different prices for the same
service seem inherently wrong to many people and
4. Some customers will manipulate the system by booking
tickets on flights that have a stopover in a city they
travel to, but which has a higher fare than the destination
flight. They exit the plane at the stopover city—saving
money. For instance, if the flight from New York to
Chicago is less than the flight to the stopover city—say
Pittsburgh, a customer can book the flight to Chicago
but get off in Pittsburgh. You might ask students to
discuss the ethics of this manipulation.
Copyright ©2014 Pearson Education, Inc.
1. Each worker makes five units per day. If the number of
workers is reduced from 10 to 9, dropping the daily capacity, what
happens to the cost?
2. What regular time level minimizes the total cost?
39 units
3. How low can the regular daily capacity get before overtime
will be required?
At 22 units per day (4.4 workers), overtime is required.
4. How low can the regular daily capacity get before there will
not be enough capacity to meet the demand?
At 12 units per day (2.4 workers), demand cannot be met.
END–OF-CHAPTER PROBLEMS
13.1
Month
Production
Days
Forecast
Demand
Needed
Production
Each Day
Jan
22
1,000
45.5
Feb
18
1,100
61.1
Mar
22
1,200
54.5
Apr
21
1,300
61.9
May
22
1,350
61.4
Jun
21
1,350
64.3
July
21
1,300
61.9
Aug
22
1,200
54.5
Sep
21
1,100
52.4
Oct
22
1,100
50.0
Nov
20
1,050
52.5
Dec
20
900
45.0
252
13,950
55.4
(on average)
190 CHAPTER 13 AG G R E G A T E PLANNING
13.2 (a) Plan 5
Month
Expected
Demand
Production
Days
Demand
Per Day
Jan
900
22
41
Feb
700
18
39
Mar
800
21
38
Apr
1,200
21
57
May
1,500
22
68
Jun
1,100
20
55
6,200
124
=6,200
Average daily production requirement 124
= 50 units/day
Constant workforce of 6 persons; subcontract to meet
extra demand: Subcontract cost = $20/unit
Hours/day
Production rate/day Persons Hours/unit
8
6 30 units/day
=
= =
Month
Expected
Demand
Production
(@ 35/day)
Subcontract
Jan
900
770
130
Feb
700
630
70
Mar
800
735
65
Apr
1,200
735
465
May
1,500
770
730
Jun
1,100
700
400
1,860
Plan 6 cost analysis:
Regular production:
= =7persons $80 124 $69,440
R
C
Subcontracting:
= =1,860 units $20 $37,200
SC
C
Total cost:
69,440 37,200 = $106,640
T
C=+
(c) Plan 2 is still preferable, but Plan 6 has lower cost than Plan 5.
CHAPTER 13 AG G R E G A T E PL A N N I N G 191
13.5 (a)
13.3 (cont’d)
Plan A
Production
(Demand of
Previous
Inventory
Stockout
Hire
Layoff
Personnel
Period
Demand
Month)
(Units)
(Units)
(Units)
(Units)
Cost
(Dec)
1,600
200
1 (Jan)
1,400
1,600
400
2 (Feb)
1,600
1,400
200
200
$15,000 (cost to go from 1,600 in Jan to 1,400 in Feb)
3 (Mar)
1,800
1,600
200
10,000 (cost to go from 1,400 in Feb to 1,600 in Mar)
4 (Apr)
1,800
1,800
200
10,000 (cost to go from 1,600 in March to 1,800 in April)
5 (May)
2,200
1,800
400
6 (June)
2,200
2,200
400
20,000 (cost to go from 1,800 in May to 2,200 in June)
7 (July)
1,800
2,200
400
8 (Aug)
1,800
1,800
400
400
30,000 (cost to go from 2,200 in July to 1,800 in Aug)
1,400
400
$85,000 Total Personnel Cost
@ $20
@ $100
=$28,000
=$40,000
Note: December demand was 1,600, and because our strategy is chasing prior-period demand, our January production is 1,600. So 200 units remain in
Plan C
Period
Demand
Production*
Ending Inv.
Stockouts (Units)
Extra Cost
0
200
1
1,400
1,825
625
12,500
8
1,800
1,825
200
4,000
Total Extra Cost: $86,000
*(14,600/8) = 1,825 average. All other things being
equal, it would appear that Plan C, with a cost of
$86,000 and stockout costs ignored, should be
recommended over Plan A (cost = $153,000) or Plan
B (cost = $244,000).
192 CHAPTER 13 AG G R E G A T E PLANNING
(b) Graph of Plan C
13.6 (a) Plan D: Maximum units in overtime = 0.20 1,600 = 320
Noting that the additional cost of a stockout is much
greater than the sum of the additional costs for overtime
plus inventory storage, one might “look ahead” and
schedule overtime where possible. The resulting
Plan D
Reg.
OT
End Inv.
Stockouts
Extra
Period
Demand
(Units)
(Units)
(Units)
(Units)
Cost
0
200
1
1,400
1,600
—
400
$8,000
2
1,600
1,600
—
400
8,000
3
1,800
1,600
—
200
4,000
4
1,800
1,600
—
—
0
5
2,200
1,600
320
—
280
44,000
6
2,200
1,600
320
—
280
44,000
7
1,800
1,600
200
—
10,000
8
1,800
1,600
200
—
10,000
1,040
1,000
Total Extra Cost: $128,000
or 40 disks per month.
(a) Aggregate plan, hiring/layoff only:
Beg.
Personnel
Inventory
Hours
Required
Production
Costs
Unit
Over
Units
Required
at 20 days
Personnel
Units
Over
Layoff
Hire: $40
Period
Demand
(or Short)
Required
at 4 Each
at 8 hrs
on Staff
Produced
(or Short)
Hire $40
$80
Layoff: $80
Jun
150
8
Jul
400
150
250
1,000
6.25
6
240
–10
2
$160
Aug
500
–10
510
2,040
12.75
13
520
10*
7
$280
Sep
550
10
540
2,160
13.50
14
560
20*
1
$40
Oct
700
20
680
2,720
17.00
17
680
0
3
$120
Nov
800
0
800
3,200
20.00
20
800
0
3
$120
Dec
700
0
700
2,800
17.50
18
720
20*
2
$160
Total Cost: $880
* Inventory (August = 10 and Sept. = 20 and Dec = 20): Holding cost = 50 × $8 = $400
Inventory cost = 50 × 8 = $400
Hiring/Layoff cost = 880
194 CHAPTER 13 AG G R E G A T E PLANNING
13.8 Calculating added costs for various planning options to
complement Problem 13.7:
■ Holding: $8/unit/month
■ Subcontracting: $80/unit
■ Overtime: $24/unit ($18/hour over 8 hours:
13.9
Month
Expected Demand
Jul
1,000
Aug
1,200
Sep
1,400
Oct
1,800
Copyright ©2014 Pearson Education, Inc.
196 CHAPTER 13 AG G R E G A T E PLANNING
■ Hiring: $30/unit
13.11 Initial data:
13.12 Initial data:
Costs (per unit)
Reg Time
=
$ 30
Overtime
=
$ 15 extra per unit
Initial inventory
=
0
Units last period
=
1,500
Costs (per case)
Initial inventory
=
0
Quarter
Forecast Demand
Reg time
=
$30
Production last period
=
1300
1
1,800 cases
Overtime
=
45
2
1,100 cases