Copyright ©2014 Pearson Education, Inc.
4
0.6
0.8
0.7
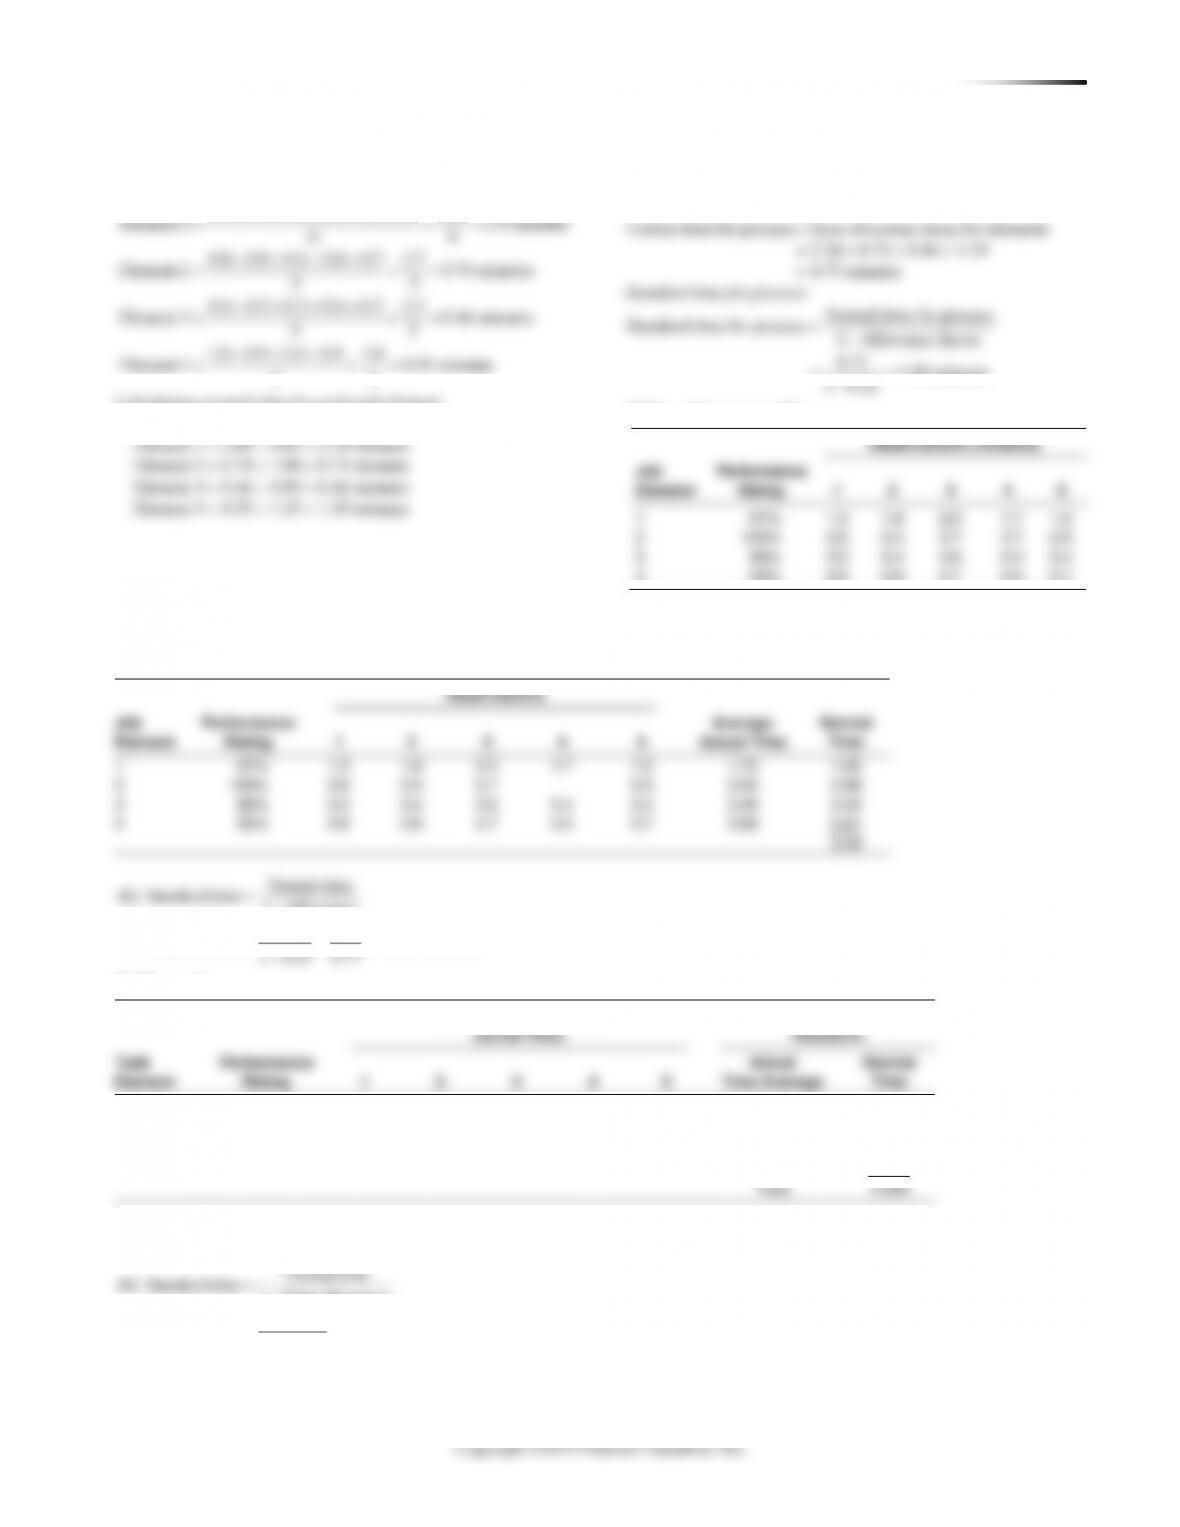
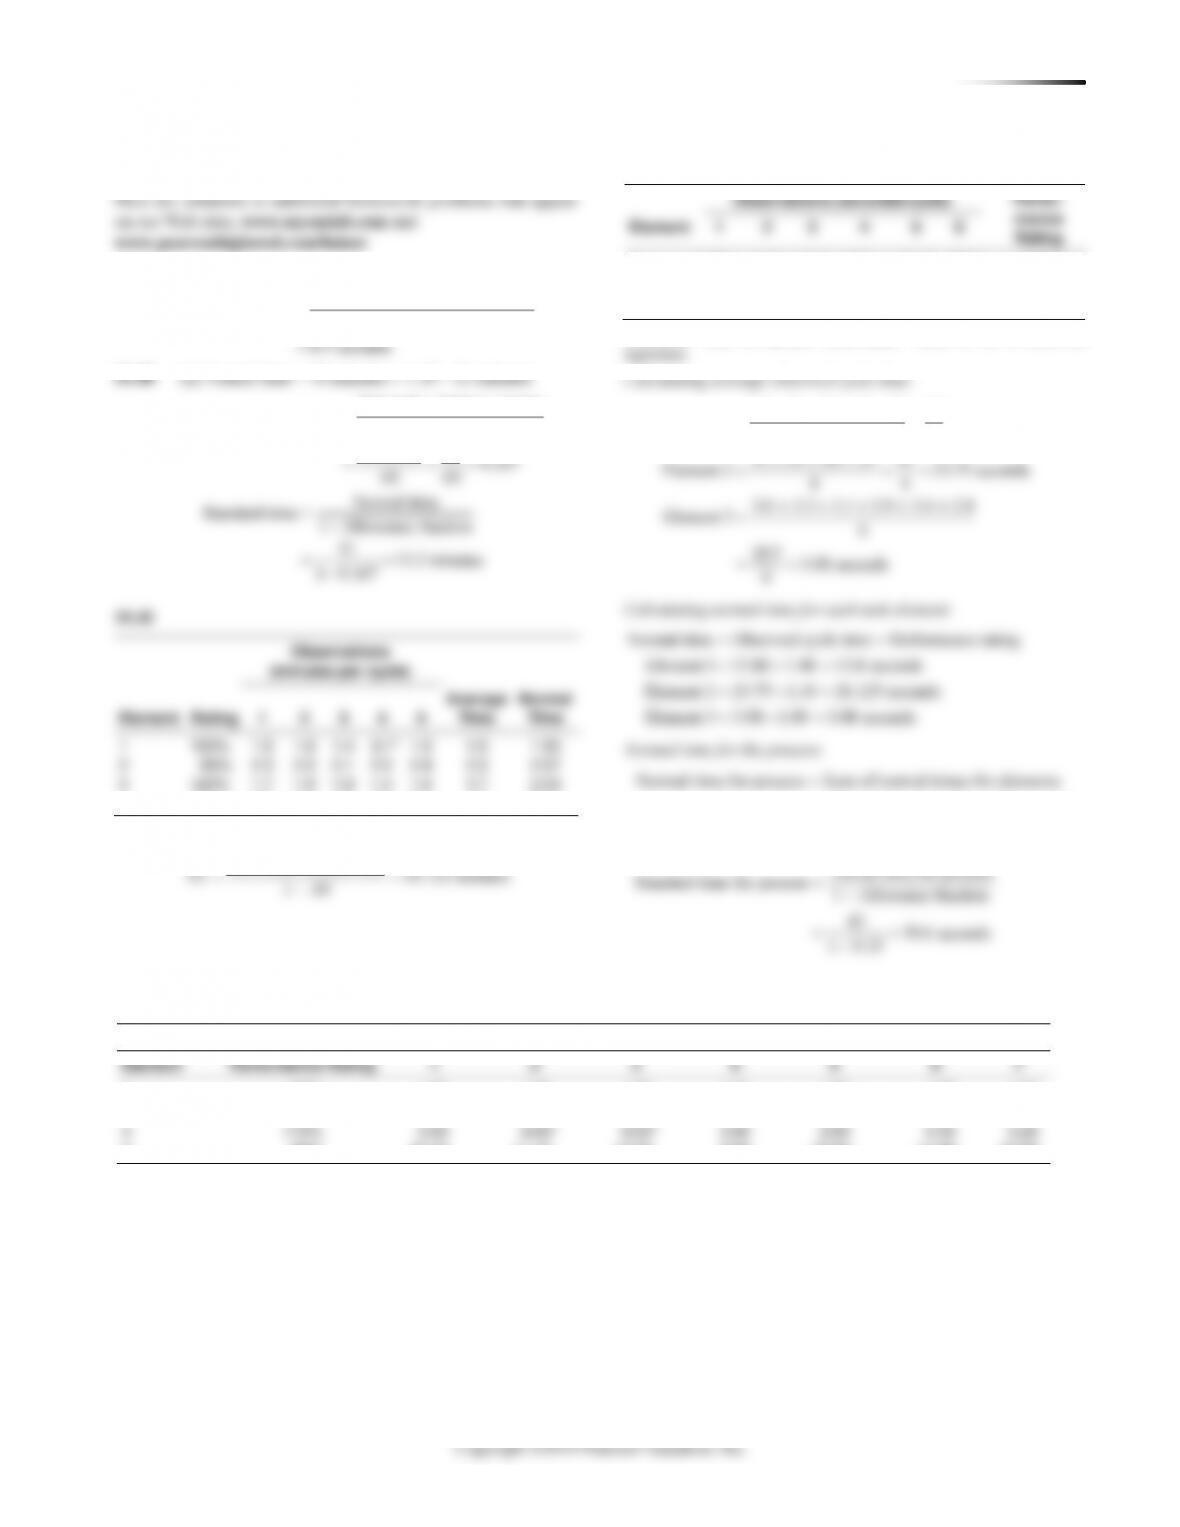
Job
Rating
1
5
Normal
Time
1
1.5
1.8
2.0
1.7
1.5
1.65
2
0.6
0.4
0.7
0.5
0.58
3
0.5
0.4
0.6
0.4
0.4
0.40
4
0.6
0.8
0.7
0.6
0.7
0.61
3.24
Task
Rating
5
Time Average
Normal
1
110%
0.5
0.4
0.4
2
95%
0.6
0.8
0.6
3
90%
0.6
0.4
0.5
4
85%
1.5
1.8
1.7
Observations (minutes)
Job
Rating
3
1
97%
1.5
1.8
1.5
2
105%
0.6
0.4
0.5
3
86%
0.5
0.4
0.4
CHAPTER 10 HUMAN RE S O U R C E S , JO B DE S I G N , AND WO R K ME A S U R E M E N T 151
152 CHAPTER 10 HUMAN RE S O U R C E S , JO B DE S I G N , A N D WO R K ME A S U R E M E N T
10.26 Initial sample: 3.5, 3.2, 4.1, 3.6, 3.9
2
22
2
2
18.3
3.5 3.2 4.1 3.6 3.9 3.66
5
(Sample observation ) 0.492
s 0.123 0.35
n 1 5 1
1.96 0.35
0.05 3.66
.686 3.76 14.13, or 15 observations.
.183
x
x
zs
nhx
= + + + + = =
−
= = = =
−−
==
= = =
= = = =
= = = =
2
22
(2.58)(1.28) 3.30
426
(0.05)(3.20) 0.16
where 2.58, 1.28, 0.05, 3.20
zs
nhx
z s h x
10.27
Sample size 45 is not adequate. They need 381 more observations.
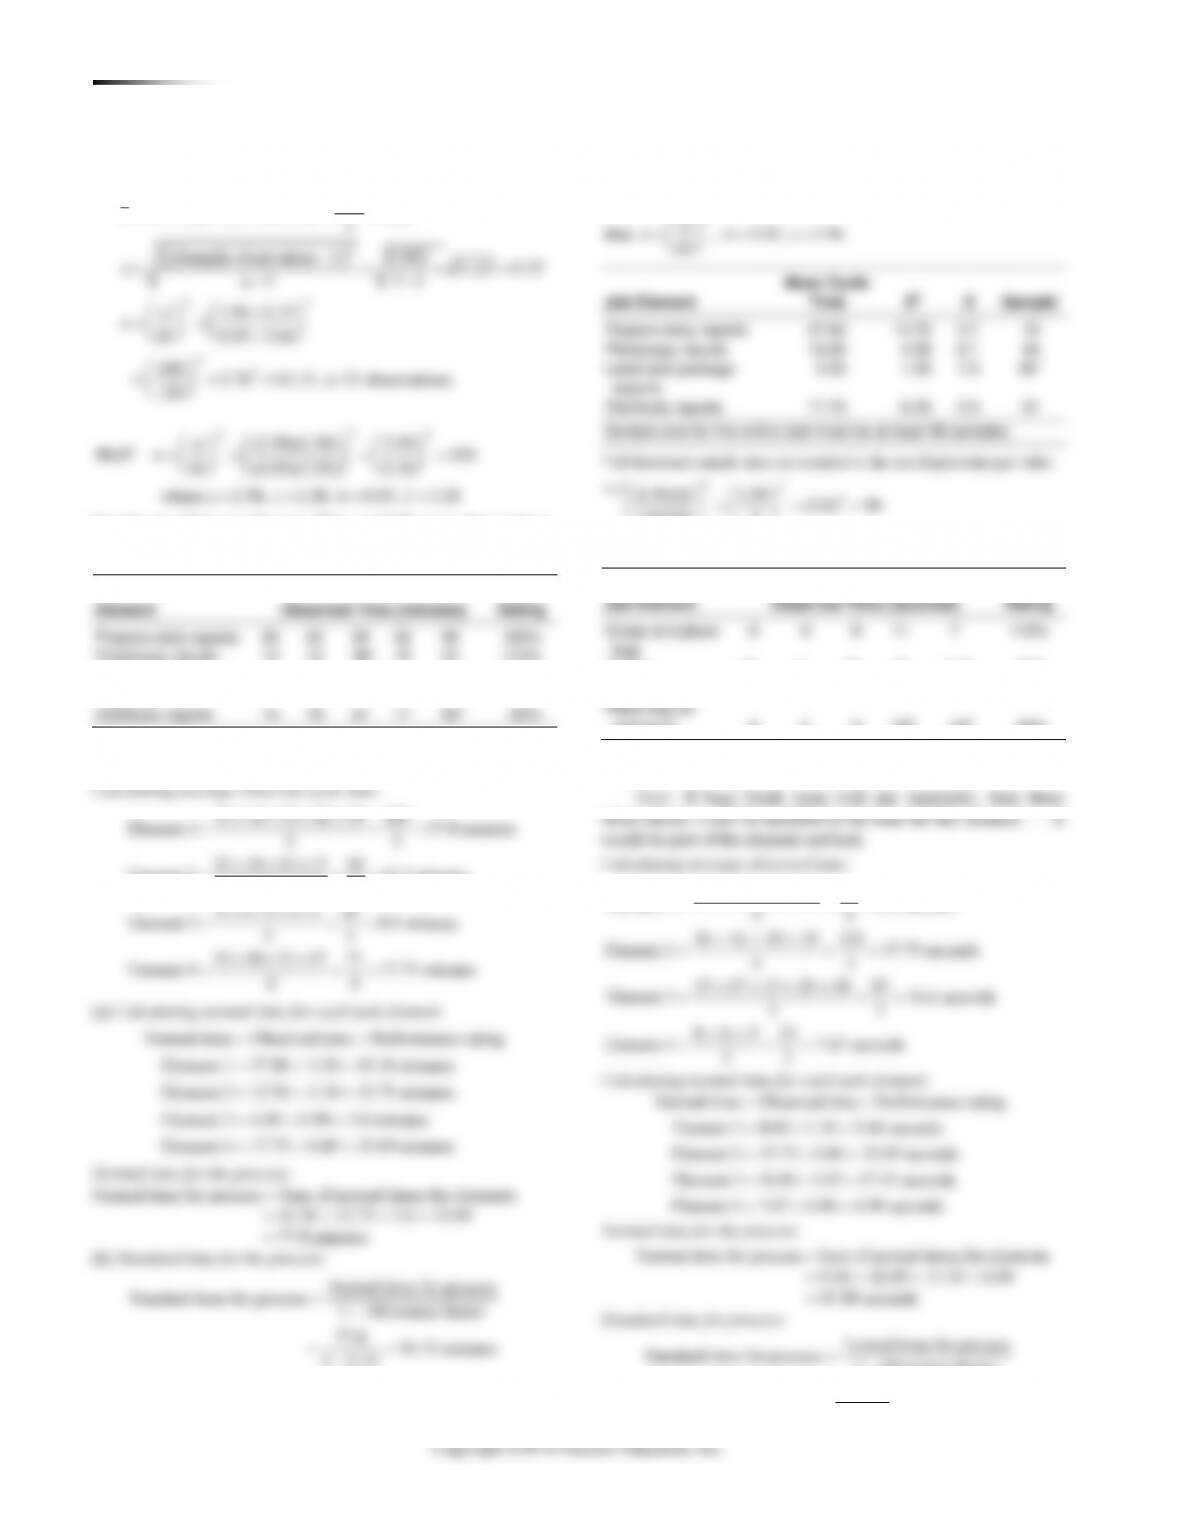
10.28
Element
Observed Time (minutes)
Perf.
Rating
Prepare daily reports
35
40
33
42
39
120%
Photocopy results
12
10
36a
15
13
110%
Label and package
reports
3
3
5
5
4
90%
Distribute reports
15
18
21
17
45b
85%
a Photocopying machine broken (included in delay factor).
b Power outage (included in delay factor).
Element 2 12.5 minutes
44
3 3 5 5 4 20
Element 3 4.0 minutes
55
15 18 21 17 71
Element 4 17.75 minutes
44
= = =
+ + + +
= = =
+++
= = =
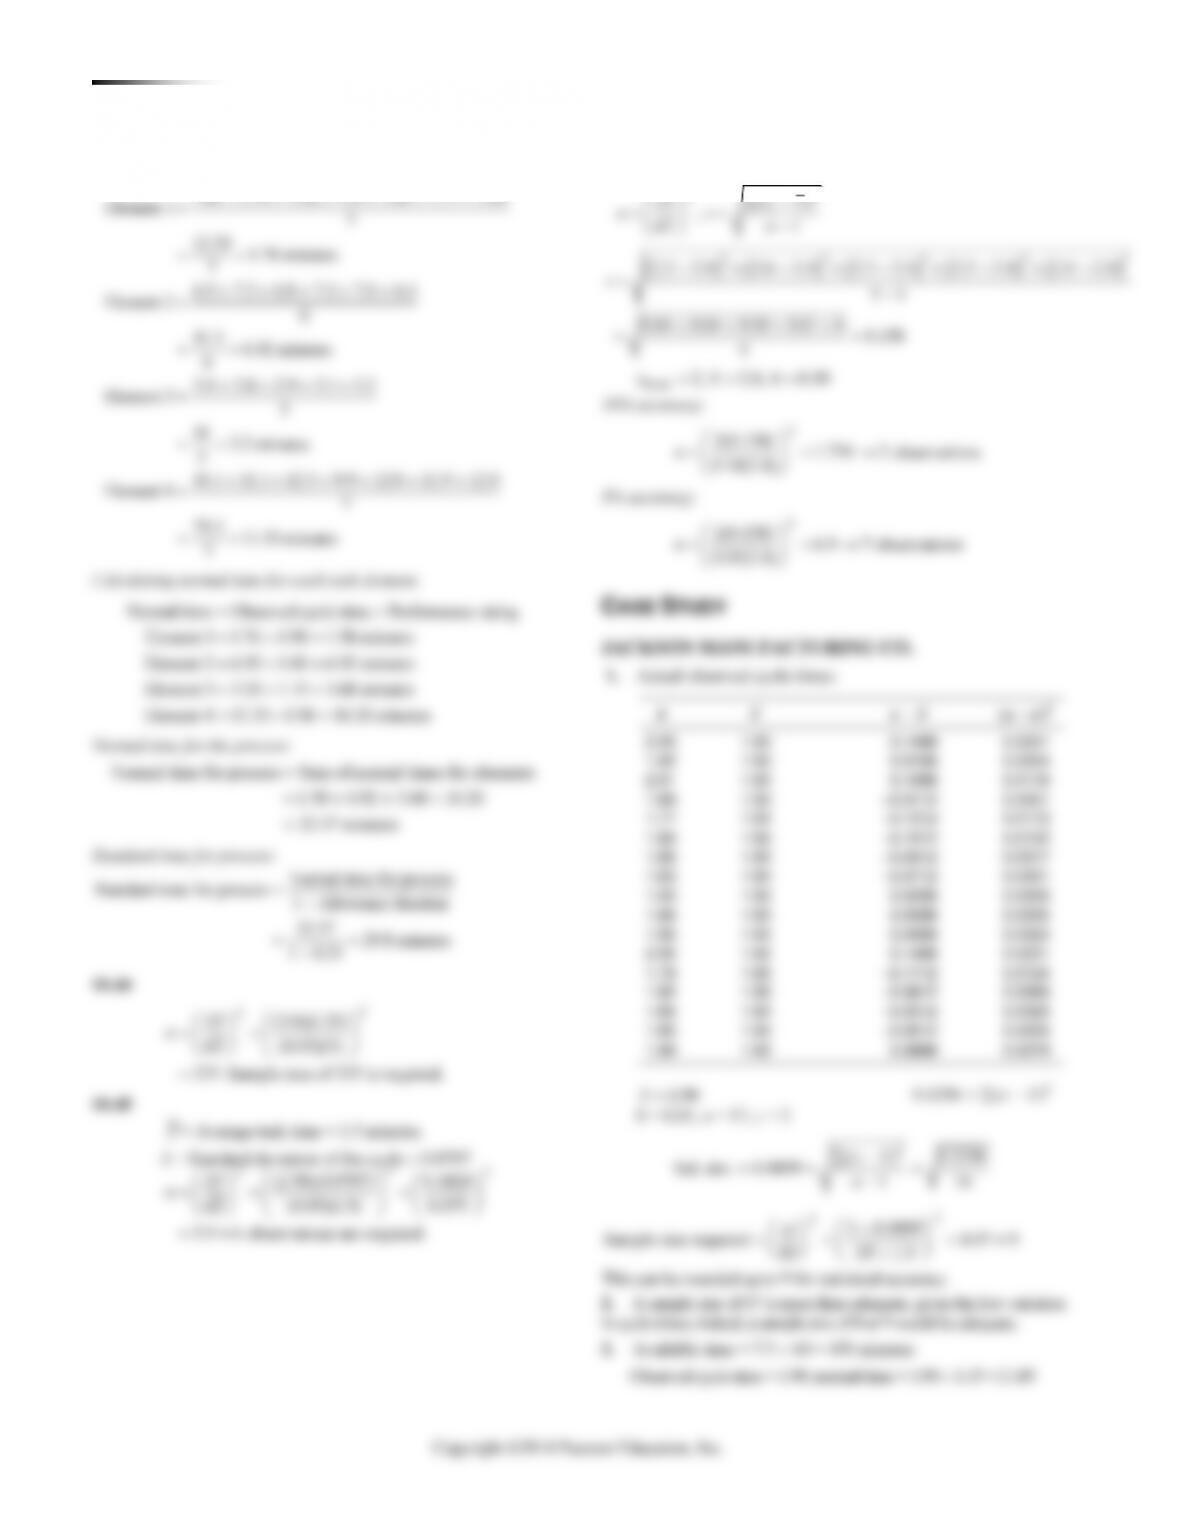
(a) Calculating normal time for each task element:
Normal time = Observed time Performance rating
Element 1 = 37.80 1.20 = 45.36 minutes
Element 2 = 12.50 1.10 = 13.75 minutes
Element 3 = 4.00 0.90 = 3.6 minutes
Element 4 = 17.75 0.85 = 15.09 minutes
Normal time for the process:
Normal time for process = Sum of normal times for elements
= 45.36 + 13.75 + 3.6 + 15.09
= 77.8 minutes
(b) Standard time for the process:
Normal time for process
Standard time for process 1 Allowance factor
77.8
91.53 minutes
1 0.15
=−
==
−
(c) Sample size:
From the equations relating to a normal distribution, we know
2
that: , 0.05, 1.96.
zs
n h z
hx
= = =
Job Element
Mean Cycle
Time
S2
S
Sample*
Prepare daily reports
37.80
13.70
3.7
15
Photocopy results
12.50
4.33
2.1
44
Label and package
reports
4.00
1.00
1.0
96**
Distribute reports
17.75
6.25
2.5
31
Sample size for the entire task must be at least 96 samples.
*All fractional sample sizes are rounded to the next highest integer value.
22
2
** (1.96)(1) 1.96 (9.8) 96
(.05)(4) .2
= = =
10.29 (a)
Job Element
Observed Time (seconds)
Perf.
Rating
Grasp and place
bag
8
9
8
11
7
110%
Fill bag
36
41
39
35
112a
85%
Seal bag
15
17
13
20
18
105%
Place bag on
conveyor
8
6
9
30b
35b
90%
a Bag breaks open, include as part of delay in allowance factor.
b Conveyor jams, include as part of delay in allowance factor.
Note: If bags break open with any regularity, then these
8 9 8 11 7 43
Element 1 8.6 seconds
55
36 41 39 35 151
Element 2 37.75 seconds
44
15 17 13 20 18 83
Element 3 16.6 seconds
55
8 6 9 23
Element 4 7.67 seconds
33
+ + + +
= = =
+ + +
= = =
+ + + +
= = =
++
= = =
Calculating normal time for each task element:
Normal time Observed time Performance rating
Element 1 8.60 1.10 9.46 seconds
Element 2 37.75 0.85 32.09 seconds
Element 3 16.60 1.05 17.43 seconds
Element 4 7.67 0.90 6.90 seconds
=
= =
= =
= =
= =
Normal time for the process:
Normal time for process = Sum of normal times for elements
= 9.46 + 32.09 + 17.43 + 6.90
= 65.88 seconds
Standard time for process:
Normal time for process
Standard time for process 1 Allowance factor
65.88
85.56 seconds
1 0.23
=−
==
−
2
2
2
Sam ple size required
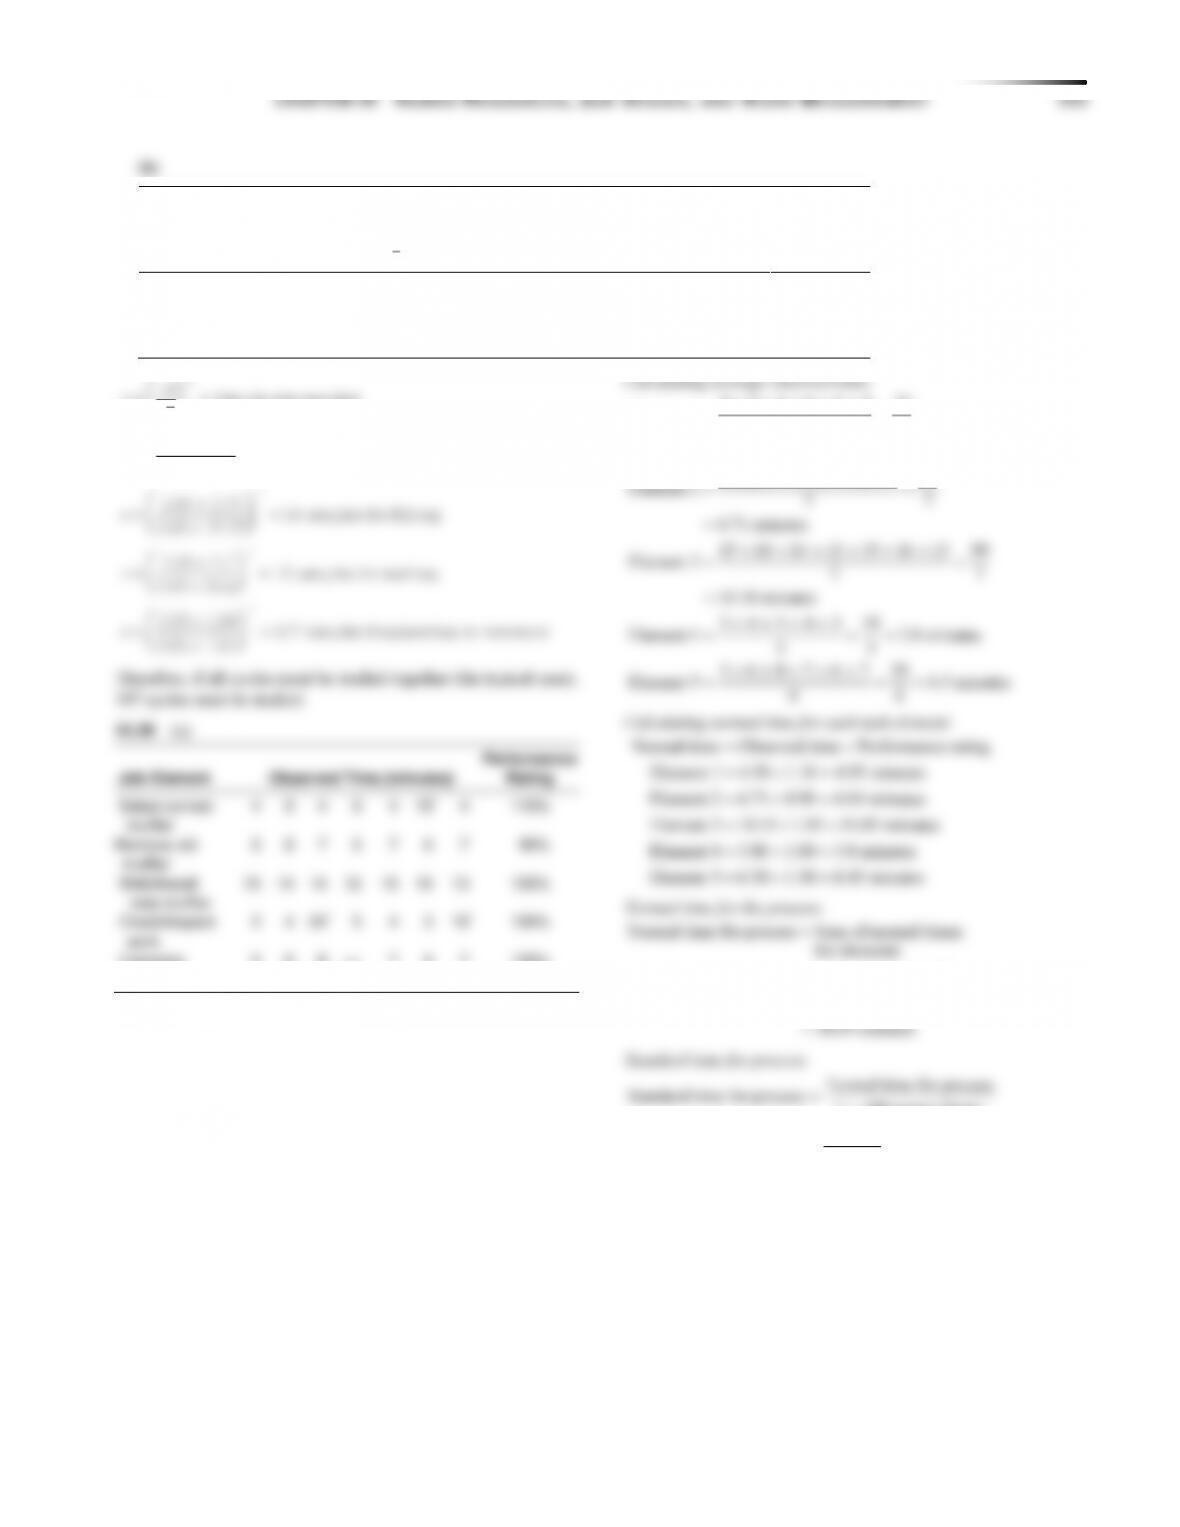
2.58 1.52 83 sam ples for grasp and place bag
0.05 8.6
2.58 2.75 14 sam ples for fill bag
0.05 37.75
2.58 2.7 70 sam ples for seal bag
0.05 16.6
2
zs
n
hx
n
n
n
n
==
==
==
==
=
2
.58 1.54 107 sam ples for place bag on conveyor
0.05 7.67
=
Therefore, if all cycles must be studied together (the typical case),
107 cycles must be studied.
10.30 (a)
Job Element
Observed Time (minutes)
Performance
Rating
Select correct
muffler
4
5
4
6
4
15*
4
110%
Remove old
muffler
6
8
7
6
7
6
7
90%
Weld/Install
new muffler
15
14
14
12
15
16
13
105%
Check/inspect
work
3
4
24*
5
4
3
18*
100%
Complete
paperwork
5
6
8
—
7
6
7
130%
*Employee stopped to talk to boss—exclude (personal time).
4 5 4 6 4 4 27
Element 1 66
4.5 minutes
6 8 7 6 7 6 7 47
Element 2 77
6.71 minutes
15 14 14 12 15 16 13 99
Element 3 77
14.14 minutes
3 4 5 4 3 19
Element 4 3.8 minutes
55
5 6 8 7 6 7 39
Element 5 6.5 minut
66
+ + + + +
==
=
+ + + + + +
==
=
++++++
==
=
+ + + +
= = =
+ + + + +
= = = es
Calculating normal time for each task element:
=
= =
= =
= =
= =
= =
Normal time Observed time Performance rating
Element 1 4.50 1.10 4.95 minutes
Element 2 6.71 0.90 6.04 minutes
Element 3 14.14 1.05 14.85 minutes
Element 4 3.80 1.00 3.8 minutes
Element 5 6.50 1.30 8.45 minutes
Normal time for the process:
Normal time for process Sum of normal times
for elements
4.95 6.04 14.85
3.8 8.45
9
38.0 minutes
=
= + +
++
=
Standard time for process:
Normal time for process
Standard time for process 1 Allowance factor
38.09 47.6 minutes (rounded)
1 0.20
=−
==
−
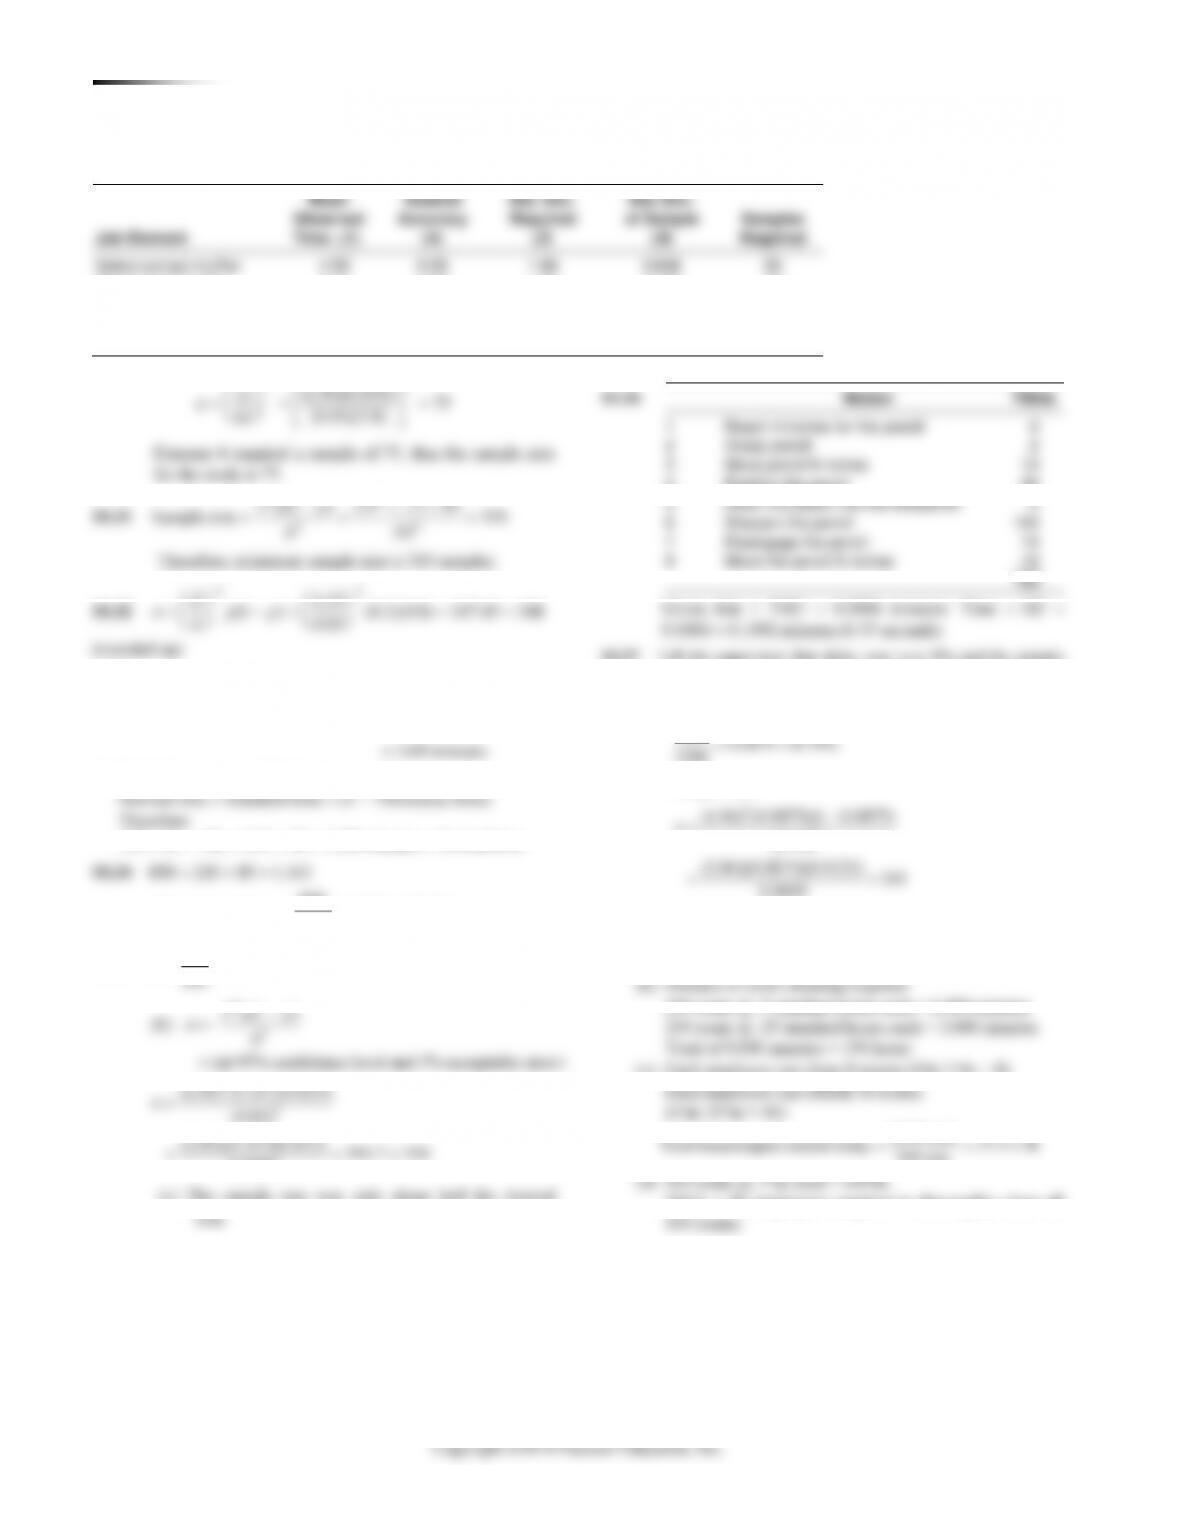
Calculating Sample Size
Job Element
Mean
()X
Desired
Accuracy
(h)
Std. Dev.
Required
(Z)
Std. Dev. of
Sample
(S)
Samples
Required
Grasp and place bag
8.60
0.05
2.58
1.52
83
Fill bag
37.75
0.05
2.58
2.75
14
Seal bag
16.60
0.05
2.58
2.70
70
Place bag on conveyor
7.67
0.05
2.58
1.54
107
154 CHAPTER 10 HUMAN RE S O U R C E S , JO B DE S I G N , A N D WO R K ME A S U R E M E N T
(b) Calculating sample size:
2
2(1.96)(0.836) 75
(0.05)(3.8)
zs
nx
h
= = =
Element 4 required a sample of 75, thus the sample size
for the study is 75.
10.31
22
22
(1 ) 2.0 .15 .85
Sample size 319.
.04
Z p p
h
−
= = =
Therefore, minimum sample size is 319 samples.
10.32
22
2.33
(1 ) (0.2)(0.8) 347.45 348
0.05
Z
n p p
h
= − = = =
(rounded up)
10.33
(a) Standard time in minutes per chair = 480 minutes per day/
130 chairs
= 3.69 minutes
(b) Total allowances = 18% (6 + 6 + 6 = 18)
3.69 (1 − .18) = 3.69 .82 = 3.026 minutes = Normal time
10.34 858 + 220 + 85 = 1,163
= = =
858
% spent working 0.738 73.8%
1,163
10.35 (a)
250 .833 83.3%
2
2
(1 )
(b)
(at 95% confidence level and 3% acceptable error)
Z p p
nh
−
=
=
2
(0.03)
(3.84)(0.167)(0.833)
593.7 594
0.0009
= =
(c) The sample size was only about half the desired
size.
10.36
Motion
TMUs
1
Reach 4 inches for the pencil
6
2
Grasp pencil
2
3
Move pencil 6 inches
10
4
Position the pencil
20
5
Insert the pencil into the sharpener
4
6
Sharpen the pencil
120
7
Disengage the pencil
10
8
Move the pencil 6 inches
10
182
Given that 1 TMU = 0.0006 minutes: Time = 182
0.0006 = 0.1092 minutes (6.55 seconds)
10.37 Tell the supervisor that delay was over 8% and the sample
size was adequate (for a 95% confidence and 3% acceptable error):
Delay:
105 0.0875 8.75%
1200 ==
Sample size:
2
(0.03)
(3.84)(0.0875)(0.9125)
341
0.0009
n−
=
==
10.38
(a) Minutes available per day = 6 hours − 2 hours
= 4 60 min. = 240 min.
200 room @ .5 standard hours each = 6,000 minutes
200 room @ .25 standard hours each = 3,000 minutes
Total of 9,000 minutes = 150 hours
(c) Each employee can clean 8 rooms (4 hr/.5 hr = 8)
9,000 min.
Total housekeepers needed today 37.5 38
240 min.
= =
200/4 = 50 employees required to thoroughly clean all
400 rooms.
Job Element
Mean
Observed
Time
()X
Desired
Accuracy
(h)
Std. Dev.
Required
(Z)
Std. Dev.
of Sample
(S)
Samples
Required
Select correct muffler
4.50
0.05
1.96
0.836
53
Remove old muffler
6.71
0.05
1.96
0.755
20
Weld/Install new muffler
14.14
0.05
1.96
1.345
14
Check/inspect work
3.80
0.05
1.96
0.836
75
Complete paperwork
6.50
0.05
1.96
1.048
40
CHAPTER 10 HUMAN RE S O U R C E S , JO B DE S I G N , AND WO R K ME A S U R E M E N T 155
ADDITIONAL HOMEWORK PROBLEMS
Observations (seconds/cycle)
Observations (seconds/cycle)
10.39
+ + + + +
=
=
8.4 8.6 8.3 8.5 8.7 8.5
Avg observed cycle time 6
8.5 seconds
Personal Fatigue Extra
(b) Allowance fraction 60 minutes
5 3 2 10 0.167
60 60
++
=
++
= = =
Normal time
Standard time = 1 Allowance fraction
11 13.2 minutes
1 0.167
−
==
−
10.41
1.5 2.07 2.04 3.5
+ + +
10.43 Measurement data:
10.42 Measurement data:
*Disregard—may be unusual observations—check to see if times are
legitimate.
13 11 14 16 15 69
Element 1 13.8 seconds
55
21 25 26 23 95
Element 2 23.75 seconds
44
3.0 3.3 3.1 2.9 3.4 2.8
Element 3 6
18.5 3.08 seconds
6
+ + + +
= = =
+ + +
= = =
+ + + + +
=
==
Calculating normal time for each task element:
Normal time Observed cycle time Performance rating
Element 1 13.80 1.00 13.8 seconds
Element 2 23.75 1.10 26.125 seconds
Element 3 3.08 1.00 3.08 seconds
=
= =
= =
==
Normal time for the process:
=
= + + =
Normal time for process Sum of normal times for elements
13.8 26.125 3.08 43.0 seconds
Standard time for process:
3
115%
3.00
9.00*
9.50*
3.80
2.90
3.10
3.20
4
10.10
*Disregard—unusual observation (reevaluate prior to including)
3
115%
3.00
9.00*
9.50*
3.80
2.90
3.10
3.20
4
10.10
*Disregard—unusual observation (reevaluate prior to including)
1
13.0
11.0
14.0
16.0
51.0*
15.0
100%
2
3.0*
21.0
25.0
73.0*
26.0
23.0
110%
3
3.0
3.3
3.1
2.9
3.4
2.8
100%
Observations
(minutes per cycle)
Element
Rating
1
2
3
4
5
Average
Time
Normal
Time
1
100%
1.5
1.6
1.4
0.1*
1.5
1.5
1.50
2
90%
2.3
2.5
2.1
2.2
2.4
2.3
2.07
3
120%
1.7
1.9
1.9
1.4
1.6
1.7
2.04
4
100%
3.5
3.6
3.6
3.6
3.2
3.5
3.50
*Disregard—possible error
Total
9.11
Observations (seconds/cycle)
Element
Performance Rating
1
2
3
4
5
6
7
1
90%
1.80
1.70
1.66
1.91
1.85
1.77
1.60
2
100%
6.90
7.30
6.80
7.10
15.30*
7.00
6.40
156 CHAPTER 10 HUMAN RE S O U R C E S , JO B DE S I G N , A N D WO R K ME A S U R E M E N T
Calculating average observed cycle time:
1.80 1.70 1.66 1.91 1.85 1.77 1.60
Element 1 7
12.29 1.76 minutes
7
6.9 7.3 6.8 7.1 7.0 6.4
Element 2 6
41.5 6.92 minutes
6
3.0 3.8 2.9 3.1 3.2
Element 3 5
16 3.2 minutes
5
10.1 11.1 12.3 9.9 12.0 11
Element 4
+ + + + + +
=
==
+ + + + +
=
==
+ + + +
=
==
+ + + + +
=.9 12.0
7
79.3 11.33 minutes
7
+
==
Calculating normal time for each task element:
Normal time Observed cycle time Performance rating
Element 1 1.76 0.90 1.58 minutes
Element 2 6.92 1.00 6.92 minutes
Element 3 3.20 1.15 3.68 minutes
Element 4 11.33 0.90 10.20 minutes
=
= =
= =
= =
= =
Normal time for the process:
=
= + + +
=
Normal time for process Sum of normal times for elements
1.58 6.92 3.68 10.20
22.37 minutes
Standard time for process:
Normal time for process
Standard time for process 1 Allowance fraction
22.37 29.8 minutes
1 0.25
=−
==
−
10.44
2
2(3.0)(1.25)
(0.05)(5)
225. Sample size of 225 is required.
ZS
nhX
==
=
10.45
5.9 6 observations are required.
=
10.46
22
()
; 1
i
xx
ZS
ns
hX n
−
==
−
+ + + +
==
0.04 0.04 0.01 0.01 0 0.158
4
95.45 2, 2.4, 0.10z x h= = =
10% accuracy:
2
2(0.158) 1.734 2 observations
0.10(2.4)
n
= = →
5% accuracy:
2
2(0.158) 6.9 7 observations
0.05(2.4)
n
= = →
CASE STUDY
JACKSON MANUFACTURING CO.
1. Actual observed cycle times:
x
x
−xx
−2
()xx
2.05
1.90
0.1488
0.0221
1.92
1.90
0.0188
0.0004
2.01
1.90
0.1088
0.0118
1.89
1.90
−0.0112
0.0001
1.77
1.90
−0.1312
0.0172
1.80
1.90
−0.1012
0.0102
1.86
1.90
−0.0412
0.0017
1.83
1.90
−0.0712
0.0051
1.93
1.90
0.0288
0.0008
1.96
1.90
0.0588
0.0035
1.95
1.90
0.0488
0.0024
2.05
1.90
0.1488
0.0221
1.79
1.90
−0.1112
0.0124
1.82
1.90
−0.0812
0.0066
1.85
1.90
−0.0512
0.0026
1.85
1.90
−0.0512
0.0026
1.99
1.90
0.0888
0.0079
1.90x=
2
0.1296 ( )xx= −
h = 0.05, n = 17, z = 3
= = =
2
23 0.0899
Sample size required 8.07 9
zs
( ) ( ) ( ) ( ) ( )
2 2 2 2 2
2.2 2.4 2.6 2.4 2.3 2.4 2.5 2.4 2.4 2.4
51
s− + − + − + − + −
=−
158 CHAPTER 10 HUMAN RE S O U R C E S , JO B DE S I G N , A N D WO R K ME A S U R E M E N T
1. How does the work culture in the United States differ from
that in Germany?
Human resource management (HRM) refers to the activities
directed at attracting, developing, and maintaining an effec-
Most students will probably suggest that the German work
system is preferable than the American work system. Students
taking this perspective will probably point out that American
workers frequently appear to be stressed out on the job and do
Can you imagine an analytical approach to documenting the prob-

Copyright ©2014 Pearson Education, Inc.
152 CHAPTER 10 HUMAN RE S O U R C E S , JO B DE S I G N , A N D WO R K ME A S U R E M E N T
10.26 Initial sample: 3.5, 3.2, 4.1, 3.6, 3.9
2
22
2
2
18.3
3.5 3.2 4.1 3.6 3.9 3.66
5
(Sample observation ) 0.492
s 0.123 0.35
n 1 5 1
1.96 0.35
0.05 3.66
.686 3.76 14.13, or 15 observations.
.183
x
x
zs
nhx
= + + + + = =
−
= = = =
−−
==
= = =
= = = =
= = = =
2
22
(2.58)(1.28) 3.30
426
(0.05)(3.20) 0.16
where 2.58, 1.28, 0.05, 3.20
zs
nhx
z s h x
10.27
Sample size 45 is not adequate. They need 381 more observations.
10.28
Element
Observed Time (minutes)
Perf.
Rating
Prepare daily reports
35
40
33
42
39
120%
Photocopy results
12
10
36a
15
13
110%
Label and package
reports
3
3
5
5
4
90%
Distribute reports
15
18
21
17
45b
85%
a Photocopying machine broken (included in delay factor).
b Power outage (included in delay factor).
Element 2 12.5 minutes
44
3 3 5 5 4 20
Element 3 4.0 minutes
55
15 18 21 17 71
Element 4 17.75 minutes
44
= = =
+ + + +
= = =
+++
= = =
(a) Calculating normal time for each task element:
Normal time = Observed time Performance rating
Element 1 = 37.80 1.20 = 45.36 minutes
Element 2 = 12.50 1.10 = 13.75 minutes
Element 3 = 4.00 0.90 = 3.6 minutes
Element 4 = 17.75 0.85 = 15.09 minutes
Normal time for the process:
Normal time for process = Sum of normal times for elements
= 45.36 + 13.75 + 3.6 + 15.09
= 77.8 minutes
(b) Standard time for the process:
Normal time for process
Standard time for process 1 Allowance factor
77.8
91.53 minutes
1 0.15
=−
==
−
(c) Sample size:
From the equations relating to a normal distribution, we know
2
that: , 0.05, 1.96.
zs
n h z
hx
= = =
Job Element
Mean Cycle
Time
S2
S
Sample*
Prepare daily reports
37.80
13.70
3.7
15
Photocopy results
12.50
4.33
2.1
44
Label and package
reports
4.00
1.00
1.0
96**
Distribute reports
17.75
6.25
2.5
31
Sample size for the entire task must be at least 96 samples.
*All fractional sample sizes are rounded to the next highest integer value.
22
2
** (1.96)(1) 1.96 (9.8) 96
(.05)(4) .2
= = =
10.29 (a)
Job Element
Observed Time (seconds)
Perf.
Rating
Grasp and place
bag
8
9
8
11
7
110%
Fill bag
36
41
39
35
112a
85%
Seal bag
15
17
13
20
18
105%
Place bag on
conveyor
8
6
9
30b
35b
90%
a Bag breaks open, include as part of delay in allowance factor.
b Conveyor jams, include as part of delay in allowance factor.
Note: If bags break open with any regularity, then these
8 9 8 11 7 43
Element 1 8.6 seconds
55
36 41 39 35 151
Element 2 37.75 seconds
44
15 17 13 20 18 83
Element 3 16.6 seconds
55
8 6 9 23
Element 4 7.67 seconds
33
+ + + +
= = =
+ + +
= = =
+ + + +
= = =
++
= = =
Calculating normal time for each task element:
Normal time Observed time Performance rating
Element 1 8.60 1.10 9.46 seconds
Element 2 37.75 0.85 32.09 seconds
Element 3 16.60 1.05 17.43 seconds
Element 4 7.67 0.90 6.90 seconds
=
= =
= =
= =
= =
Normal time for the process:
Normal time for process = Sum of normal times for elements
= 9.46 + 32.09 + 17.43 + 6.90
= 65.88 seconds
Standard time for process:
Normal time for process
Standard time for process 1 Allowance factor
65.88
85.56 seconds
1 0.23
=−
==
−
2
2
2
Sam ple size required
2.58 1.52 83 sam ples for grasp and place bag
0.05 8.6
2.58 2.75 14 sam ples for fill bag
0.05 37.75
2.58 2.7 70 sam ples for seal bag
0.05 16.6
2
zs
n
hx
n
n
n
n
==
==
==
==
=
2
.58 1.54 107 sam ples for place bag on conveyor
0.05 7.67
=
Therefore, if all cycles must be studied together (the typical case),
107 cycles must be studied.
10.30 (a)
Job Element
Observed Time (minutes)
Performance
Rating
Select correct
muffler
4
5
4
6
4
15*
4
110%
Remove old
muffler
6
8
7
6
7
6
7
90%
Weld/Install
new muffler
15
14
14
12
15
16
13
105%
Check/inspect
work
3
4
24*
5
4
3
18*
100%
Complete
paperwork
5
6
8
—
7
6
7
130%
*Employee stopped to talk to boss—exclude (personal time).
4 5 4 6 4 4 27
Element 1 66
4.5 minutes
6 8 7 6 7 6 7 47
Element 2 77
6.71 minutes
15 14 14 12 15 16 13 99
Element 3 77
14.14 minutes
3 4 5 4 3 19
Element 4 3.8 minutes
55
5 6 8 7 6 7 39
Element 5 6.5 minut
66
+ + + + +
==
=
+ + + + + +
==
=
++++++
==
=
+ + + +
= = =
+ + + + +
= = = es
Calculating normal time for each task element:
=
= =
= =
= =
= =
= =
Normal time Observed time Performance rating
Element 1 4.50 1.10 4.95 minutes
Element 2 6.71 0.90 6.04 minutes
Element 3 14.14 1.05 14.85 minutes
Element 4 3.80 1.00 3.8 minutes
Element 5 6.50 1.30 8.45 minutes
Normal time for the process:
Normal time for process Sum of normal times
for elements
4.95 6.04 14.85
3.8 8.45
9
38.0 minutes
=
= + +
++
=
Standard time for process:
Normal time for process
Standard time for process 1 Allowance factor
38.09 47.6 minutes (rounded)
1 0.20
=−
==
−
Calculating Sample Size
Job Element
Mean
()X
Desired
Accuracy
(h)
Std. Dev.
Required
(Z)
Std. Dev. of
Sample
(S)
Samples
Required
Grasp and place bag
8.60
0.05
2.58
1.52
83
Fill bag
37.75
0.05
2.58
2.75
14
Seal bag
16.60
0.05
2.58
2.70
70
Place bag on conveyor
7.67
0.05
2.58
1.54
107
154 CHAPTER 10 HUMAN RE S O U R C E S , JO B DE S I G N , A N D WO R K ME A S U R E M E N T
(b) Calculating sample size:
2
2(1.96)(0.836) 75
(0.05)(3.8)
zs
nx
h
= = =
Element 4 required a sample of 75, thus the sample size
for the study is 75.
10.31
22
22
(1 ) 2.0 .15 .85
Sample size 319.
.04
Z p p
h
−
= = =
Therefore, minimum sample size is 319 samples.
10.32
22
2.33
(1 ) (0.2)(0.8) 347.45 348
0.05
Z
n p p
h
= − = = =
(rounded up)
10.33
(a) Standard time in minutes per chair = 480 minutes per day/
130 chairs
= 3.69 minutes
(b) Total allowances = 18% (6 + 6 + 6 = 18)
3.69 (1 − .18) = 3.69 .82 = 3.026 minutes = Normal time
10.34 858 + 220 + 85 = 1,163
= = =
858
% spent working 0.738 73.8%
1,163
10.35 (a)
250 .833 83.3%
2
2
(1 )
(b)
(at 95% confidence level and 3% acceptable error)
Z p p
nh
−
=
=
2
(0.03)
(3.84)(0.167)(0.833)
593.7 594
0.0009
= =
(c) The sample size was only about half the desired
size.
10.36
Motion
TMUs
1
Reach 4 inches for the pencil
6
2
Grasp pencil
2
3
Move pencil 6 inches
10
4
Position the pencil
20
5
Insert the pencil into the sharpener
4
6
Sharpen the pencil
120
7
Disengage the pencil
10
8
Move the pencil 6 inches
10
182
Given that 1 TMU = 0.0006 minutes: Time = 182
0.0006 = 0.1092 minutes (6.55 seconds)
10.37 Tell the supervisor that delay was over 8% and the sample
size was adequate (for a 95% confidence and 3% acceptable error):
Delay:
105 0.0875 8.75%
1200 ==
Sample size:
2
(0.03)
(3.84)(0.0875)(0.9125)
341
0.0009
n−
=
==
10.38
(a) Minutes available per day = 6 hours − 2 hours
= 4 60 min. = 240 min.
200 room @ .5 standard hours each = 6,000 minutes
200 room @ .25 standard hours each = 3,000 minutes
Total of 9,000 minutes = 150 hours
(c) Each employee can clean 8 rooms (4 hr/.5 hr = 8)
9,000 min.
Total housekeepers needed today 37.5 38
240 min.
= =
200/4 = 50 employees required to thoroughly clean all
400 rooms.
Job Element
Mean
Observed
Time
()X
Desired
Accuracy
(h)
Std. Dev.
Required
(Z)
Std. Dev.
of Sample
(S)
Samples
Required
Select correct muffler
4.50
0.05
1.96
0.836
53
Remove old muffler
6.71
0.05
1.96
0.755
20
Weld/Install new muffler
14.14
0.05
1.96
1.345
14
Check/inspect work
3.80
0.05
1.96
0.836
75
Complete paperwork
6.50
0.05
1.96
1.048
40
CHAPTER 10 HUMAN RE S O U R C E S , JO B DE S I G N , AND WO R K ME A S U R E M E N T 155
ADDITIONAL HOMEWORK PROBLEMS
10.39
+ + + + +
=
=
8.4 8.6 8.3 8.5 8.7 8.5
Avg observed cycle time 6
8.5 seconds
Personal Fatigue Extra
(b) Allowance fraction 60 minutes
5 3 2 10 0.167
60 60
++
=
++
= = =
Normal time
Standard time = 1 Allowance fraction
11 13.2 minutes
1 0.167
−
==
−
10.41
1.5 2.07 2.04 3.5
+ + +
10.43 Measurement data:
10.42 Measurement data:
*Disregard—may be unusual observations—check to see if times are
legitimate.
13 11 14 16 15 69
Element 1 13.8 seconds
55
21 25 26 23 95
Element 2 23.75 seconds
44
3.0 3.3 3.1 2.9 3.4 2.8
Element 3 6
18.5 3.08 seconds
6
+ + + +
= = =
+ + +
= = =
+ + + + +
=
==
Calculating normal time for each task element:
Normal time Observed cycle time Performance rating
Element 1 13.80 1.00 13.8 seconds
Element 2 23.75 1.10 26.125 seconds
Element 3 3.08 1.00 3.08 seconds
=
= =
= =
==
Normal time for the process:
=
= + + =
Normal time for process Sum of normal times for elements
13.8 26.125 3.08 43.0 seconds
Standard time for process:
1
13.0
11.0
14.0
16.0
51.0*
15.0
100%
2
3.0*
21.0
25.0
73.0*
26.0
23.0
110%
3
3.0
3.3
3.1
2.9
3.4
2.8
100%
Observations
(minutes per cycle)
Element
Rating
1
2
3
4
5
Average
Time
Normal
Time
1
100%
1.5
1.6
1.4
0.1*
1.5
1.5
1.50
2
90%
2.3
2.5
2.1
2.2
2.4
2.3
2.07
3
120%
1.7
1.9
1.9
1.4
1.6
1.7
2.04
4
100%
3.5
3.6
3.6
3.6
3.2
3.5
3.50
*Disregard—possible error
Total
9.11
Observations (seconds/cycle)
Element
Performance Rating
1
2
3
4
5
6
7
1
90%
1.80
1.70
1.66
1.91
1.85
1.77
1.60
2
100%
6.90
7.30
6.80
7.10
15.30*
7.00
6.40
156 CHAPTER 10 HUMAN RE S O U R C E S , JO B DE S I G N , A N D WO R K ME A S U R E M E N T
Calculating average observed cycle time:
1.80 1.70 1.66 1.91 1.85 1.77 1.60
Element 1 7
12.29 1.76 minutes
7
6.9 7.3 6.8 7.1 7.0 6.4
Element 2 6
41.5 6.92 minutes
6
3.0 3.8 2.9 3.1 3.2
Element 3 5
16 3.2 minutes
5
10.1 11.1 12.3 9.9 12.0 11
Element 4
+ + + + + +
=
==
+ + + + +
=
==
+ + + +
=
==
+ + + + +
=.9 12.0
7
79.3 11.33 minutes
7
+
==
Calculating normal time for each task element:
Normal time Observed cycle time Performance rating
Element 1 1.76 0.90 1.58 minutes
Element 2 6.92 1.00 6.92 minutes
Element 3 3.20 1.15 3.68 minutes
Element 4 11.33 0.90 10.20 minutes
=
= =
= =
= =
= =
Normal time for the process:
=
= + + +
=
Normal time for process Sum of normal times for elements
1.58 6.92 3.68 10.20
22.37 minutes
Standard time for process:
Normal time for process
Standard time for process 1 Allowance fraction
22.37 29.8 minutes
1 0.25
=−
==
−
10.44
2
2(3.0)(1.25)
(0.05)(5)
225. Sample size of 225 is required.
ZS
nhX
==
=
10.45
5.9 6 observations are required.
=
10.46
22
()
; 1
i
xx
ZS
ns
hX n
−
==
−
+ + + +
==
0.04 0.04 0.01 0.01 0 0.158
4
95.45 2, 2.4, 0.10z x h= = =
10% accuracy:
2
2(0.158) 1.734 2 observations
0.10(2.4)
n
= = →
5% accuracy:
2
2(0.158) 6.9 7 observations
0.05(2.4)
n
= = →
CASE STUDY
JACKSON MANUFACTURING CO.
1. Actual observed cycle times:
x
x
−xx
−2
()xx
2.05
1.90
0.1488
0.0221
1.92
1.90
0.0188
0.0004
2.01
1.90
0.1088
0.0118
1.89
1.90
−0.0112
0.0001
1.77
1.90
−0.1312
0.0172
1.80
1.90
−0.1012
0.0102
1.86
1.90
−0.0412
0.0017
1.83
1.90
−0.0712
0.0051
1.93
1.90
0.0288
0.0008
1.96
1.90
0.0588
0.0035
1.95
1.90
0.0488
0.0024
2.05
1.90
0.1488
0.0221
1.79
1.90
−0.1112
0.0124
1.82
1.90
−0.0812
0.0066
1.85
1.90
−0.0512
0.0026
1.85
1.90
−0.0512
0.0026
1.99
1.90
0.0888
0.0079
1.90x=
2
0.1296 ( )xx= −
h = 0.05, n = 17, z = 3
= = =
2
23 0.0899
Sample size required 8.07 9
zs
( ) ( ) ( ) ( ) ( )
2 2 2 2 2
2.2 2.4 2.6 2.4 2.3 2.4 2.5 2.4 2.4 2.4
51
s− + − + − + − + −
=−
158 CHAPTER 10 HUMAN RE S O U R C E S , JO B DE S I G N , A N D WO R K ME A S U R E M E N T
1. How does the work culture in the United States differ from
that in Germany?
Human resource management (HRM) refers to the activities
directed at attracting, developing, and maintaining an effec-
Most students will probably suggest that the German work
system is preferable than the American work system. Students
taking this perspective will probably point out that American
workers frequently appear to be stressed out on the job and do
Can you imagine an analytical approach to documenting the prob-
Copyright ©2014 Pearson Education, Inc.