
Q102
T1 128.7748
LHS 468378.5
RHS 468378.5
difference -0.0062
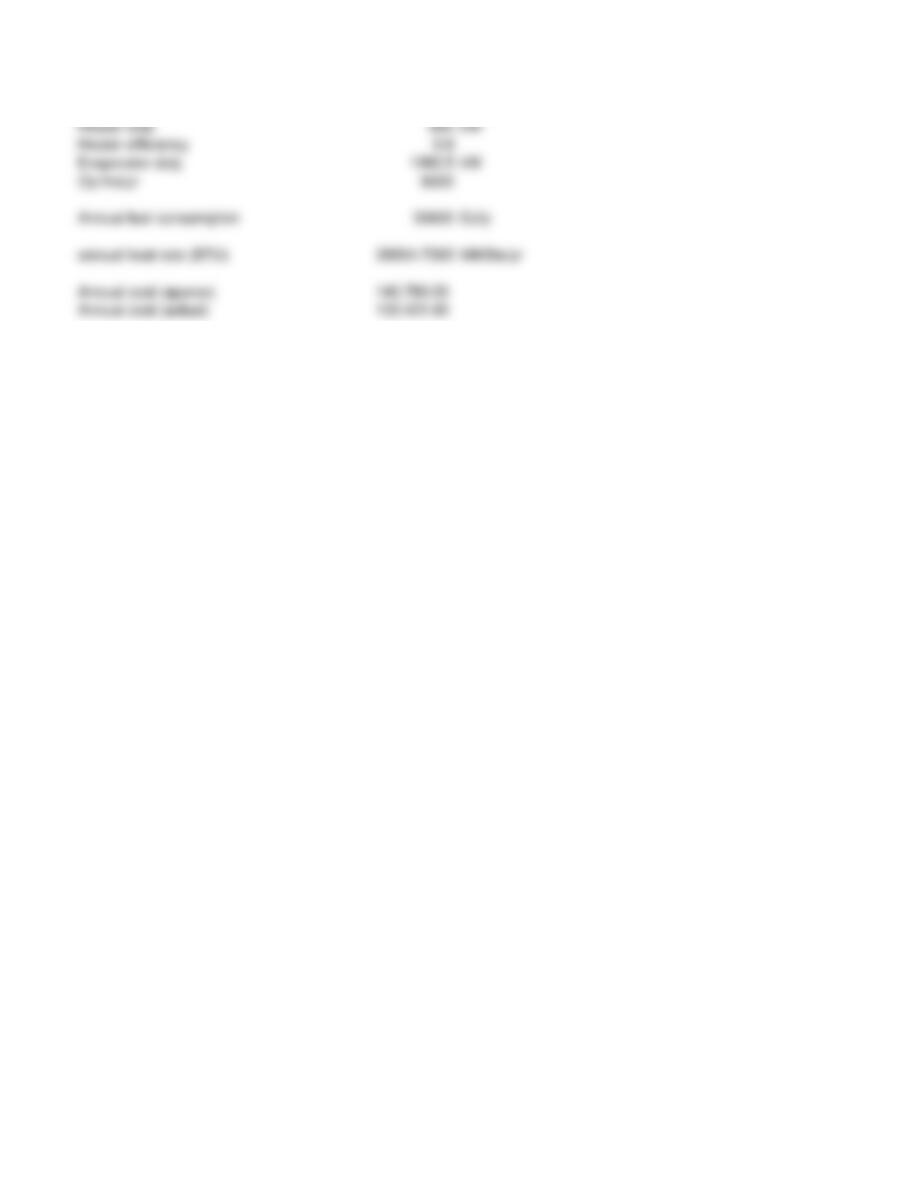
Energy cost 4.6 $/MMBtu
Heater duty 850 kW
Heater efficiency 0.8
Evaporator duty 1062.5 kW
Op hrs/yr 8000
Annual fuel consumption 30600 GJ/y
annual heat rate (BTU) 29004.7393 MMBtu/yr
Annual cost (approx) 140,760.00
Annual cost (actual) 133,421.80
1
2
3
4
5
6
7
8
9
10
11
12
13
14
15
16
17
18
19
20
21
22
23
24
25
A B C D E F G
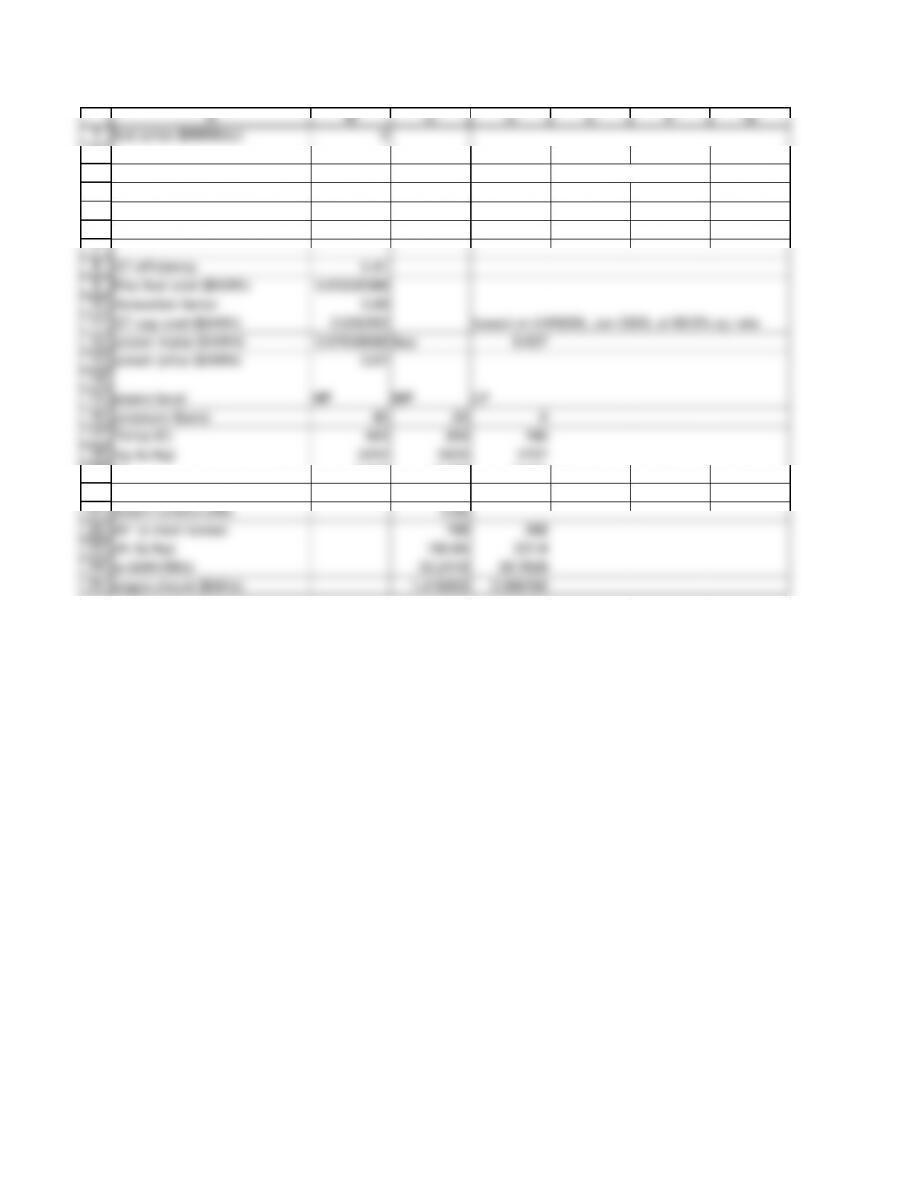
fuel price ($/MMbtu) 4
boiler efficiency 0.8 Frxn back pressure
steam ($/Mlb) HP 4.32 ($/MMbtu) 5
steam ($/Mlb) MP 2.903067 ($/MMbtu) 3.3756593 1
steam ($/Mlb) LP 0.893871 ($/MMbtu) 1.03938488 1
GT efficiency 0.41
Elec fuel cost ($/kWh) 0.03509388
Annualizn factor 0.68
GT cap cost ($/kWh) 0.035292 based on LM6000, Jan 2000, at 99.9% op rate
power make ($/kWh) 0.07038588 buy 0.037
power price ($/kWh) 0.07
steam level HP MP LP
pressure (bara) 40 20 6
Temp (C) 400 300 160
hg (kJ/kg) 3214 3025 2757
sg 6.769 6.768 6.761
steam turbine effic 0.85
dh’ to next lowest 189 268
dh (kJ/kg) 160.65 227.8
w (kWh/Mlb) 20.2419 28.7028
cogen discnt ($/Mlb) 1.416933 2.009196
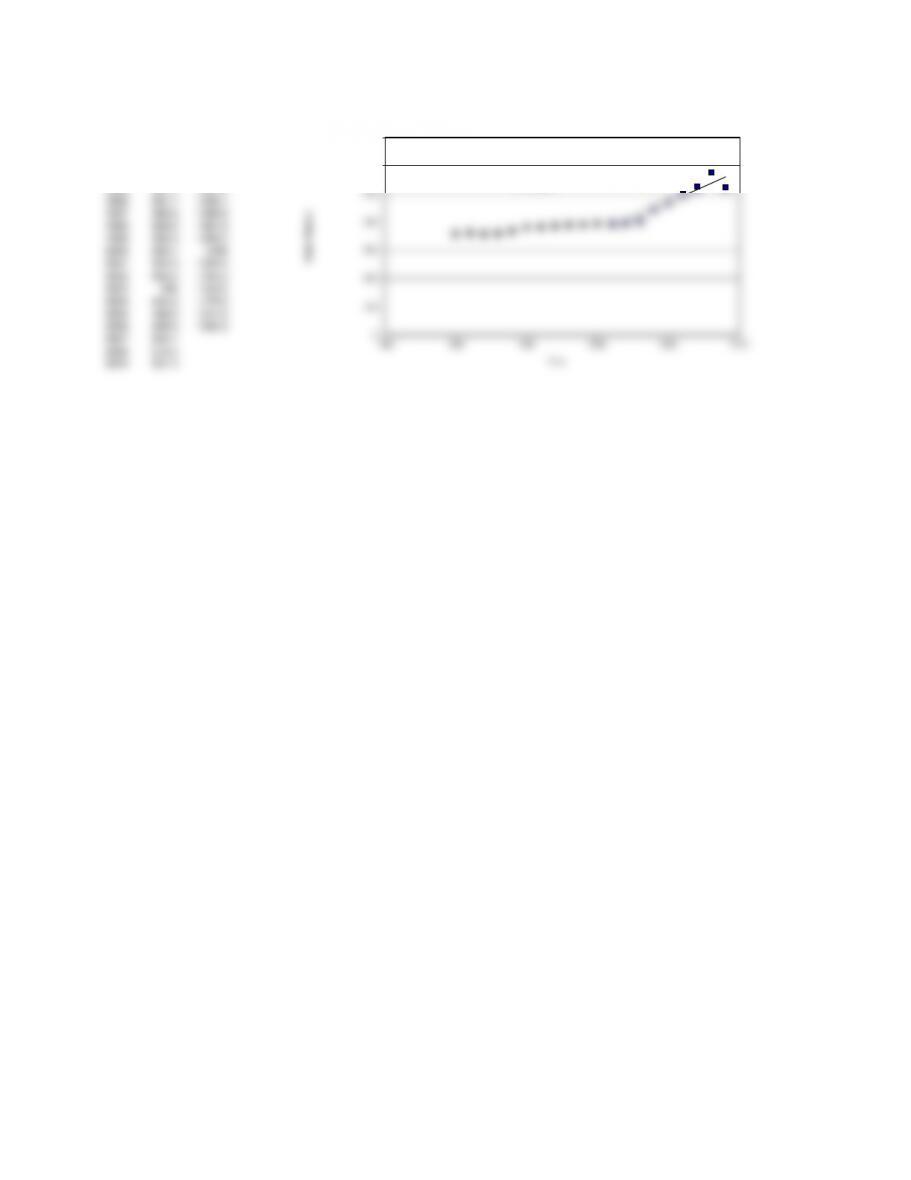
Year CE MS
1990 357.6 915.1
1991 361.3 930.6
1992 358.2 943.1
1993 359.2 964.2
1994 368.1 993.4
1995 381.1 1027.5
1996 381.7 1039.1
1997 386.5 1056.8
1998 389.5 1061.9
1999 390.6 1068.3
2000 394.1 1089
2001 394.3 1093.9
2002 395.6 1104.2
2003 402 1123.6
2004 444.2 1178.5
2005 468.2 1244.5
2006 499.6 1302.3
2007 525.4
2008 575.4
2009 521.9
y = 22.533x – 44710
R² = 0.8881
0
100
200
300
400
500
600
700
1985 1990 1995 2000 2005 2010
Index Value a
Year

Installed capital costs (from Aspen ICARUS)
k$
Tower + packing, 0.5 x 4 m 74,800
Storage tank, 5 m325,600
Pump, 0.08 L/s 18,100
Pump, 0.08 L/s 18,100
Pump, 0.08 L/s 18,100
Pump, 0.08 L/s 18,100
Pump, 0.08 L/s, spare 3,700
Total 176,500
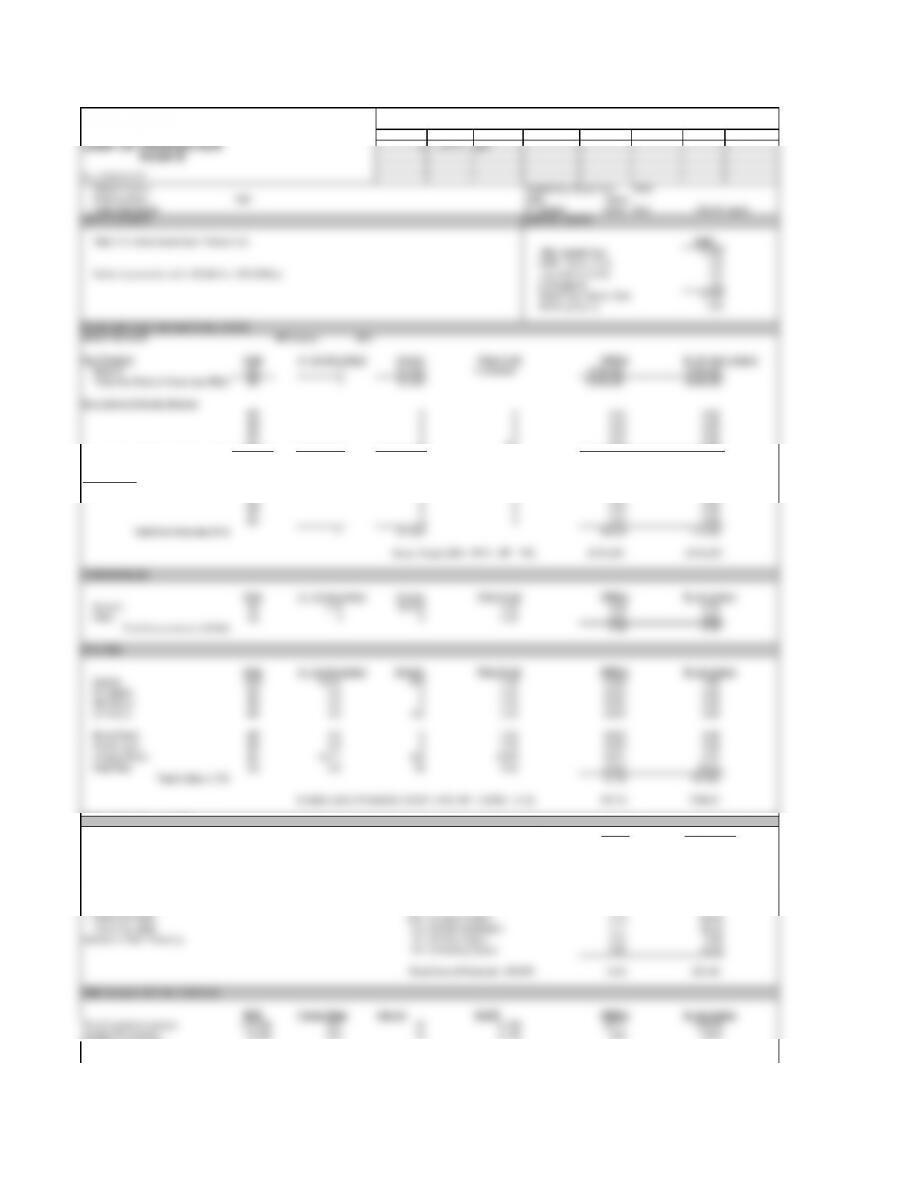
Project Name
Project Number Sheet 1
REV DATE BY REV DATE BY
COST OF PRODUCTION 112.21.11 GPT
Nylon 6
Owner’s Name
Plant Location Units Metric
Case Description On Stream 8,000 hr/yr 333.33 day/yr
Yield information taken from Problem 8.2 $MM
ISBL Capital Cost 114.0
OSBL Capital Cost 0.0
Scale of production set to 60 kMTA = 132 MMlb/yr Engineering Costs 0.0
Contingency 0.0
Total Fixed Capital Cost
114.0
Working Capital 14.3
MASS BALANCE MB closure 98%
Key Products Units Units/Unit product Units/yr Price $/unit $MM/yr $/unit main product
Nylon 6 MT 1 60,000 Not known #VALUE! #VALUE!
Total Key Product Revenues (REV) MT 1 60,000 #VALUE! #VALUE!
By-products & Waste Streams
MT 0 0 0.00 0.00
MT 0 0 0.00 0.00
MT 0 0 0.00 0.00
MT 0 0.0 0.00 0.00
Total Byproducts and Wastes (BP) MT 0 0 0.00 0.00
Raw Materials
Caprolactam MT 1.02 61,200 1700 104.04 1734.00
MT 0 0 0.00 0.00
MT 0 0 0.00 0.00
MT 0 0 0.00 0.00
Total Raw Materials (RM) 1 61,200 104.04 1734.00
Gross Margin (GM = REV + BP – RM) #VALUE! #VALUE!
Units Units/Unit product Units/yr Price $/unit $MM/yr $/unit product
Solvent kg 0.70 42,000 1.00 0.04 0.70
Other kg 0 0 0.00 0.00 0.00
Total Consumables (CONS) 0.04 0.70
Units Units/Unit product Units/hr Price $/unit $MM/yr $/unit product
Electric kWh 130.0 975 0.06 0.468 7.80
HP Steam MT 0.0 0 0.00 0.000 0.00
MP Steam MT 0.0 0 0.00 0.000 0.00
LP Steam MT 0.0 0.0 0.00 0.000 0.00
Boiler Feed MT 0.0 0 0.00 0.000 0.00
Condensate MT 0.0 0 0.00 0.000 0.00
Cooling Water MT 121.1 908 0.029 0.211 3.51
Fuel Fired GJ 9.0 68 4.50 2.430 40.50
Total Utilities (UTS) 3.109 51.812
Variable Cost of Production (VCOP = RM – BP + CONS + UTS) 107.19 1786.51
$MM/yr $/unit product
Labor
4.8 Operators per Shift Position
Number of shift positions 9 30,000 $/yr each 1.30 21.60
Supervision 25% of Operating Labor 0.32 5.40
Direct Ovhd. 45% of Labor & Superv. 0.73 12.15
Maintenance 3% of ISBL Investment 3.42 57.00
Overhead Expense
Plant Overhead 65% of Labor & Maint. 3.75 62.50
Tax & Insurance 2% of Fixed Investment 1.71 28.50
Interest on Debt Financing 0% of Fixed Capital 0.00 0.00
6% of Working Capital 0.86 14.30
Fixed Cost of Production (FCOP) 12.09 201.45
$MM Interest Rate Life (yr) ACCR $MM/yr $/unit product
Fixed Capital Investment 114.000 15% 10 0.199 22.71 378.58
Royalty Amortization 15.000 15% 10 0.199 2.99 49.81
Inventory Amortization
Catalyst 1 0.000 15% 3 0.438 0.00 0.00
ANNUALIZED CAPITAL CHARGES
UTILITIES
FIXED OPERATING COSTS
CONSUMABLES
TBD
YIELD ESTIMATE
CAPITAL COSTS
REVENUES AND RAW MATERIAL COSTS
Form XXXXX-YY-ZZ
Capital Cost Basis Year
2010
Company Name
Nylon 6 (problem 8.2)
Address
APVD
APVD
Catalyst 2 0.000 15% 3 0.438 0.00 0.00
Adsorbent 1 0.000 15% 3 0.438 0.00 0.00
Equipment 1 0.000 15% 5 0.298 0.00 0.00
Equipment 2 0.000 15% 5 0.298 0.00 0.00
Total Annual Capital Charge 25.70 428.39
$MM/yr $/unit product
107.19 1786.51
12.09 201.45
119.28 1987.96
#VALUE! #VALUE!
144.98 2416.36
Fixed Cost of Production
Cash Cost of Production
Gross Profit
Total Cost of Production
SUMMARY
Variable Cost of Production
Project Name
Project Number Sheet 1
REV DATE BY REV DATE BY
COST OF PRODUCTION 112.20.11 GPT
Methyl Ethyl Ketone
Owner’s Name
Plant Location Units Metric
Case Description On Stream 8,000 hr/yr 333.33 day/yr
Yield information taken from Problem 6.10 $MM
ISBL Capital Cost 21.5
OSBL Capital Cost 0.0
Scale of production set to 10 kMTA = 22 MMlb/yr Engineering Costs 2.5
Contingency 0.0
Total Fixed Capital Cost
24.0
Working Capital 2.1
MASS BALANCE MB closure 100%
Key Products Units Units/Unit product Units/yr Price $/unit $MM/yr $/unit main product
MEK MT 1 10,000 1800 18.00 1800.00
Total Key Product Revenues (REV) MT 1 10,000 18.00 1800.00
By-products & Waste Streams
MT 0 0 0.00 0.00
Off-gas MT 0700 0.00 0.00
Organic Waste (Fuel value) MT 450 300 0.14 13.50
Aqueous Waste MT 0 -1.5 0.00 0.00
Total Byproducts and Wastes (BP) MT 0450 0.14 13.50
Raw Materials
2-Butanol MT 1.045 10,450 800 8.36 836.00
MT 0 0 0.00 0.00
MT 0 0 0.00 0.00
MT 0 0 0.00 0.00
Total Raw Materials (RM) 1 10,450 8.36 836.00
Gross Margin (GM = REV + BP – RM) 9.78 977.50
Units Units/Unit product Units/yr Price $/unit $MM/yr $/unit product
Solvent kg 0.70 7,000 1.00 0.01 0.70
Other kg 0 0 0.00 0.00 0.00
Total Consumables (CONS) 0.01 0.70
Units Units/Unit product Units/hr Price $/unit $MM/yr $/unit product
Electric kWh 800.0 1,000 0.05 0.400 40.00
HP Steam MT 0.0 0 14.30 0.000 0.00
MP Steam MT 0.0 0 12.00 0.000 0.00
LP Steam MT 0.96 1.2 8.90 0.085 8.54
Boiler Feed MT 0.0 0 1.10 0.000 0.00
Condensate MT 0.0 0 0.80 0.000 0.00
Cooling Water MT 96.0 120 0.024 0.023 2.30
Fuel Fired GJ 13.5 17 6.00 0.810 81.00
Total Utilities (UTS) 1.318 131.848
Variable Cost of Production (VCOP = RM – BP + CONS + UTS) 9.55 955.05
$MM/yr $/unit product
Labor
4.8 Operators per Shift Position
Number of shift positions 9 30,000 $/yr each 1.30 129.60
Supervision 25% of Operating Labor 0.32 32.40
Direct Ovhd. 45% of Labor & Superv. 0.73 72.90
Maintenance 3% of ISBL Investment 0.72 72.00
Overhead Expense
Plant Overhead 65% of Labor & Maint. 1.99 199.49
Tax & Insurance 2% of Fixed Investment 0.36 36.00
Interest on Debt Financing 0% of Fixed Capital 0.00 0.00
6% of Working Capital 0.13 12.65
Fixed Cost of Production (FCOP) 5.55 555.04
$MM Interest Rate Life (yr) ACCR $MM/yr $/unit product
Fixed Capital Investment 24.000 15% 10 0.199 4.78 478.20
Royalty Amortization 15.000 15% 10 0.199 2.99 298.88
Inventory Amortization
Catalyst 1 0.000 15% 3 0.438 0.00 0.00
CAPITAL COSTS
YIELD ESTIMATE
UTILITIES
CONSUMABLES
Capital Cost Basis Year
2010
Northeast Asia
REVENUES AND RAW MATERIAL COSTS
ANNUALIZED CAPITAL CHARGES
FIXED OPERATING COSTS
Address
Company Name
Form XXXXX-YY-ZZ
APVD
Methyl Ethyl Ketone (Problem 8.3)
APVD
Catalyst 2 0.000 15% 3 0.438 0.00 0.00
Adsorbent 1 0.000 15% 3 0.438 0.00 0.00
Equipment 1 0.000 15% 5 0.298 0.00 0.00
Equipment 2 0.000 15% 5 0.298 0.00 0.00
Total Annual Capital Charge 7.77 777.08
$MM/yr $/unit product
9.55 955.05
5.55 555.04
15.10 1510.09
2.90 289.91
22.87 2287.17
Gross Profit
Total Cost of Production
Variable Cost of Production
Fixed Cost of Production
Cash Cost of Production
SUMMARY
Back to Contents
Data 1: United States Natural Gas Industrial Price (Dollars per Thousand Cubic Feet)
Sourcekey N3035US3
Date
United States
Natural Gas
Industrial Price
(Dollars per
Thousand Cubic
Feet)
Jan-2001 8.84
Feb-2001 7.21
Mar-2001 6.3
Apr-2001 6.08
May-2001 5.46
Jun-2001 4.75
Jul-2001 4.1
Aug-2001 3.99
Sep-2001 3.5
Oct-2001 3.18
Nov-2001 3.88
Dec-2001 3.69
Jan-2002 4.05
Feb-2002 3.7
Mar-2002 3.78
Apr-2002 3.64
May-2002 4.07
Jun-2002 3.86
Jul-2002 3.8
Aug-2002 3.62
Sep-2002 3.89
Oct-2002 4.18
Nov-2002 4.72
Dec-2002 4.92
Jan-2003 5.65
Feb-2003 6.4
Mar-2003 8.27
Apr-2003 5.96
May-2003 5.78
Jun-2003 6.59
Jul-2003 5.69
Aug-2003 5.28
Sep-2003 5.32
Oct-2003 4.93
Nov-2003 5.19
Dec-2003 5.9
Jan-2004 6.72
Feb-2004 6.52
Mar-2004 5.97
Apr-2004 6.06
May-2004 6.34
Jun-2004 6.82
Jul-2004 6.41
Aug-2004 6.36
Sep-2004 5.68
Oct-2004 6.03
Nov-2004 7.64
Dec-2004 7.54
Jan-2005 7.06
Feb-2005 7.15
Mar-2005 7.12
Apr-2005 7.71
May-2005 7.19
Jun-2005 6.91
Jul-2005 7.4
Aug-2005 7.98
Sep-2005 10.18
Oct-2005 12.06
Nov-2005 12.11
Dec-2005 11.17
Jan-2006 10.85
Feb-2006 9.38
Mar-2006 8.24
Apr-2006 7.93
May-2006 7.63
Jun-2006 6.92
Jul-2006 6.78
Aug-2006 7.36
Sep-2006 7.21
Oct-2006 5.62
Nov-2006 7.74
Dec-2006 8.23
Jan-2007 7.36
Feb-2007 8.25
Mar-2007 8.42
Apr-2007 8.14
May-2007 8.11
Jun-2007 7.92
Jul-2007 7.51
Aug-2007 6.72
Sep-2007 6.28
Oct-2007 7.06
Nov-2007 7.87
Dec-2007 8.18
Jan-2008 8.29
Feb-2008 8.96
Mar-2008 9.61
Apr-2008 10.03
May-2008 11.35
Jun-2008 12.11
Jul-2008 13.06
Aug-2008 10.1
Sep-2008 9.13
Oct-2008 8.1
Nov-2008 7.34
0
2
4
6
8
10
12
14
Dec-1999 Dec-2001 Dec-2003 Dec-2005 Dec-2007 Dec-2009 Dec-2011 Dec-2013
Natural Gas Price ($/Mscf)

Dec-2008 7.86
Jan-2009 7.5
Feb-2009 6.43
Mar-2009 5.69
Apr-2009 5.04
May-2009 4.4
Jun-2009 4.56
Jul-2009 4.68
Aug-2009 4.37
Sep-2009 3.88
Oct-2009 4.82
Nov-2009 5.44
Dec-2009 5.97
Jan-2010 6.86
Feb-2010 6.69
Mar-2010 5.91
Apr-2010 4.99
May-2010 4.99
Jun-2010 4.95
Jul-2010 5.38
Aug-2010 5.27
Sep-2010 4.52
Oct-2010 4.65
Nov-2010 4.51
Dec-2010 5.42
Jan-2011 5.55
Feb-2011 5.56
Mar-2011 5.11
Apr-2011 5.23
May-2011 5.08
Jun-2011 5.06
Jul-2011 4.95
Aug-2011 5.12
Sep-2011 4.74
Sulfuric Caustic Carbon
2000 60.32 146 2.14
2001 61.32 271 1.79
2002 54.98 101 1.84
2003 58.11 160 2.09
2004 55.81 261 1.98
2005 53.42 408 1.92
2006 62.28 358 1.98
2007 57.12 375 2.09
2008 74.65 772 2.36
2009 443 2.43
2010 371
2011 55
0
10
20
30
40
50
60
70
80
1998 2000 2002 2004 2006 2008 2010 2012
$ per metric ton
Sulfuric acid
0
100
200
300
400
500
600
700
800
900
1998 2000 2002 2004 2006 2008 2010 2012
$ per metric ton
Sodium Hydroxide
y = 0.0452x – 88.566
R² = 0.4338
0
0.5
1
1.5
2
2.5
3
1998 2000 2002 2004 2006 2008 2010 2012
$ per kg
Activated carbon
Rundate: 6/26/2020 11:23 PM CMAI Price Database Price Data Last Updated: December 10, 2010
PRODUCT Benzene Ethylene Styrene
MARKET Northeast Asia Northeast Asia Northeast Asia
TYPE Contract-Market Contract-Market Domestic Average Spot Posting
UNIT PRICE US$/Metric Ton US$/Metric Ton US$/Metric Ton
INCO TERM C&F S. Korea Delivered S. Korea FOB S. Korea
MONTHLY
Period Benzene Ethylene Styrene GM Smoothed GM Full data set Smoothed data
Jan-1999 219.98 342.00 415.00 1H99 218.98 355.67 403.02 137.007 137.0 Bin Frequency
Feb-1999 211.00 342.00 402.50
2H99 262.86 481.00 603.81 269.3555 269.4 0 0 Column1 Column1
Mar-1999 196.03 337.00 363.00
1H00 366.38 520.67 838.58 414.3481 0 25 0
Apr-1999 196 .03 354.00 410.00
2H00 404.54 587.83 684.75 212.7055 212.7 25 50 1 Mean 188.2902 Mean 184.3303
May-1999 255.90 375.00 430.63
1H01 338.19 534.50 529.21 122.5251 122.5 50 75 0 Standard Error 14.52625 Standard Error 9.948728
Jun-1999 234.95 384.00 397.00
2H01 216.70 467.50 416.08 120.4888 120.5 75 100 0 Median 176.9902 Median 176.9902
Jul-1999 216.47 40 7.00 430.00
1H02 293.30 450.67 570.92 221.8226 221.8 100 125 2 Mode #N/A Mode #N/A
Aug-1999 231.43 432 .00 478.75
2H02 375.11 516.50 659.23 229.5266 229.5 125 150 5 Standard Deviation 71.1638 Standard Deviation 46.66367
Sep-1999 2 61.37 492.00 558.00
1H03 483.86 580.00 677.75 147.6189 147.6 150 175 4 Sample Variance 5064.287 Sample Variance 2177.498
Oct-1999 291 .30 505.00 764.38
2H03 415.99 558.17 709.96 237.5213 237.5 175 200 2 Kurtosis 3.49029 Kurtosis -1.26782
1H04 638.07 669.17 870.61 198.3171 198.3 200 225 4 Skewness 1.165206 Skewness 0.2723
1H05 925.58 829.67 1087.93 152.1797 152.2 250 275 2 Minimum 49.3515 Minimum 120.4888
2H05 785.97 950.00 1021.90 158.5671 158.6 275 300 0 Maximum 414.3481 Maximum 269.3555
1H06 815.33 1025.83 1075.45 168.563 168.6 300 325 0 Sum 4518.966 Sum 4055.266
2H08 846.33 1435.17 1094.41 49.3515 425 450 0
2H09 845.93 1096.83 1077.45 127.4305 127.4
1H10 949.62 1252.17 1226.10 153.7815 153.8
2H10 907.75 1221.07 1176.12 144.333 144.3
Sep-2007 9 89.38 1,195.00 1,351.00
Oct-2007 1,029.60 1,258.00 1,342.60
Nov-2007 1,051 .63 1 ,338.00 1,361.38
Dec-2007 991.50 1 ,468.00 1,33 1.56
Jan-2008 1,019.40 1,493.00 1,330 .70
Feb-2008 1,072.38 1,491.00 1,370.50
Mar-2008 1,093.69 1,496.00 1,428.13
Apr-2008 1,112.20 1,537.00 1,424.40
May-2008 1,253.75 1,606.00 1,523.13
Jun-2008 1,320.38 1,742.00 1,630.63
Jul-2008 1,32 3.30 1,917.00 1,627 .70
Aug-2008 1,194 .63 1,962.00 1,490.75
Sep-2008 1 ,117.00 1,718.00 1,410.00
Oct-2008 756 .50 1 ,485.00 976.70
Nov-2008 369.25 944 .00 522.50
Dec-2008 317.30 585.00 538.80
Jan-2009 362.38 574.00 619.38
Feb-2009 413.75 714.00 718.75
Mar-2009 454.00 770.00 838.00
Apr-2009 615 .90 766.00 949.80
May-2009 642.13 814.00 889.00
Jun-2009 750.75 891.00 1,01 8.75
Jul-2009 844.60 1,053.00 1,064.50
Aug-2009 842.75 1,010.00 1,130.00
Sep-2009 7 81.88 1,116.00 1,034.50
Oct-2009 768 .40 1 ,075.00 979.00
Nov-2009 869.75 1,119.00 1,072.50
Dec-2009 968.20 1 ,208.00 1,18 4.20
Jan-2010 1,048.63 1,228.00 1,308 .13
Feb-2010 953.00 1,263.00 1,306.25
Mar-2010 947.10 1,197.00 1,256.10
Apr-2010 1,007.25 1,271.00 1,278.13
May-2010 921.25 1,304.00 1,165.00
Jun-2010 820.50 1,250.00 1,043.00
Jul-2010 800.38 1,174.00 1,046.00
Aug-2010 869.63 1,115.00 1,087.50
Sep-2010 8 76.10 1,177.00 1,148.10
Oct-2010 964 .50 1 ,197.00 1,25 3.00
Nov-2010 957.88 1,312.00 1,246.13
Dec-2010 978.00 1,351.43 1,276.00
Jan-2011 1,407.91
Feb-2011 1,358.65
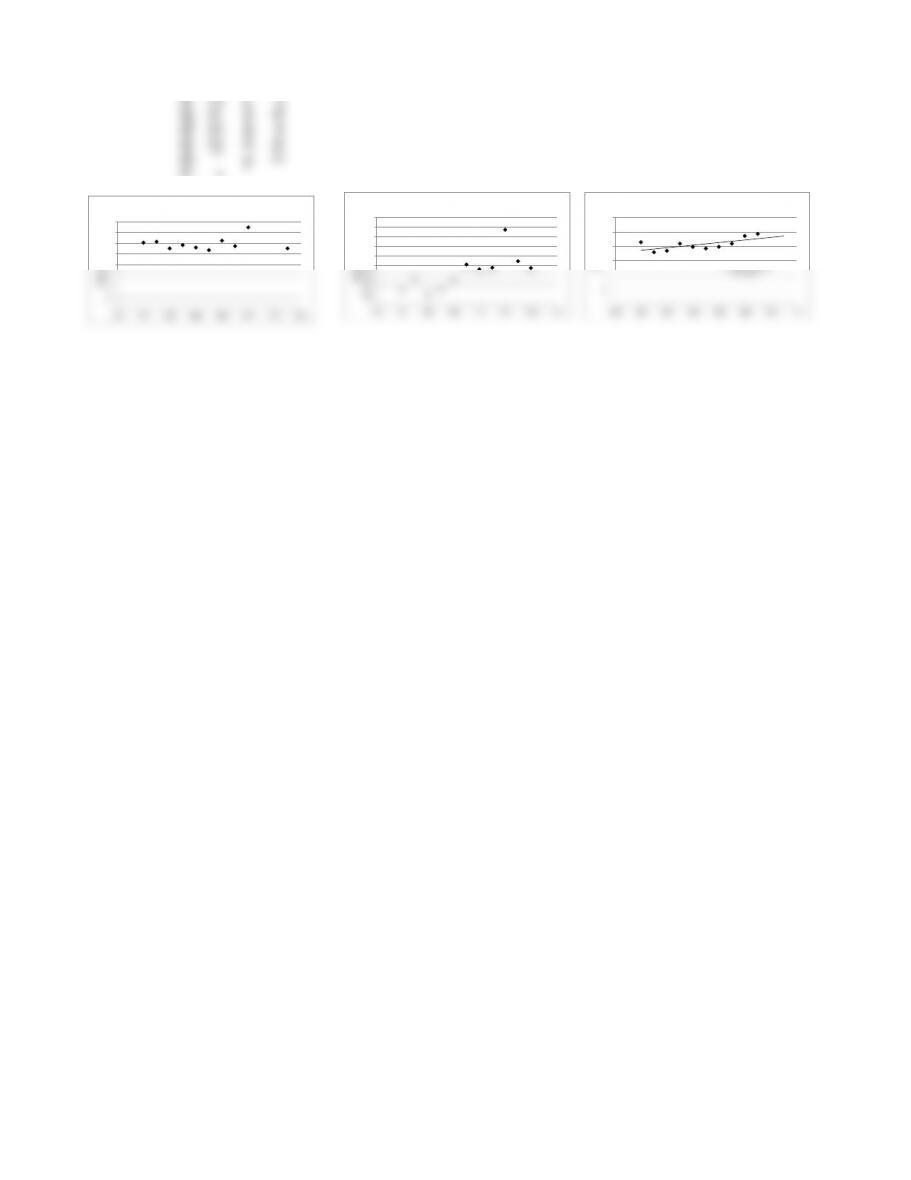
y = -3.8683x + 236.64
R² = 0.1477
300
350
400
450
3
4
5
6
©2010 CMAI, All Rights Reserved
All CMAI General Warranties and Disclaimers Apply
To view visit http://www.cmaiglobal.com/Warranty.htm
13 of 32

Rundate: 6/26/2020 11:23 PM CMAI Price Database Price Data Last Updated: December 10, 2010
Mar-2011 1,307.65
Apr-2011 1,276.00
May-2011 1,257.12
Jun-2011 1,267.65
Jul-2011 1,260.68
Aug-2011 1,258.12
Sep-2011 1,261.74
Oct-2011 1,249.51
Nov-2011 1,253.35
Dec-2011 1,261.96
Jan-2012 1,266.21
Feb-2012 1,269.84
Mar-2012 1,263.05
Apr-2012 1,255.64
May-2012 1,267.13
Jun-2012 1,286.42
Jul-2012 1,281.31
Aug-2012 1,280.44
Sep-2012 1,285.83
Oct-2012 1,275.23
Nov-2012 1,280.83
Dec-2012 1,291.38
Year
Gross
profit
(MM$)
Depreciation
charge (MM$)
Taxable
income
(MM$)
Taxes
paid
(MM$)
Cash Flow
(MM$)
Discount
factor
Present
value of CF
(MM$)
0 0 0 0 0 -11.5 1 -11.5 7yrMACRS
1 0 0 0 0 -11.5 0.893 -10.27
210 3.29 6.7133 0 10.00 0.797 7.97 14.29
310 5.63 4.3673 2.35 7.65 0.712 5.45 24.49
410 4.02 5.9773 1.53 8.47 0.636 5.38 17.49
510 2.87 7.1273 2.09 7.91 0.567 4.49 12.49
610 2.05 7.9461 2.49 7.51 0.507 3.80 8.93
710 2.05 7.9484 2.78 7.22 0.452 3.27 8.92
810 2.05 7.9461 2.78 7.22 0.404 2.92 8.93
910 1.03 8.9742 2.78 7.22 0.361 2.60 4.46
10 10 010 3.14 6.86 0.322 2.21
11 10 010 3.50 6.50 0.287 1.87
12 10 010 3.50 6.50 0.257 1.67
Interest rate 12.00%
Total = Net present value = 19.85
Project Capex Fuel saved Savings
Simple
Payback
Included? Capex Savings
(MM$) (MMBtu/h) (MM$/y) (y)
A1.5 15 0.756 1.98 11.5 0.756
B0.6 90.454 1.32 10.6 0.4536
C1.8 16 0.806 2.23 11.8 0.8064
D2.2 17 0.857 2.57 12.2 0.8568
E0.3 80.403 0.74 10.3 0.4032
Total 6.4 3.276
Year
Gross
profit
(MM$)
Depreciation
charge (MM$)
Taxable
income
(MM$)
Taxes paid
(MM$)
Cash Flow
(MM$)
Discount
factor
Present
value of CF
(MM$)
1 0 0 0 0 -6.4 0.870 -5.57 5 yr MACRS
23.276 1.28 1.996 03.28 0.756 2.48 20
33.276 2.05 1.228 0.70 2.58 0.658 1.69 32
43.276 1.23 2.0472 0.43 2.85 0.572 1.63 19.2
53.276 0.74 2.53872 0.72 2.56 0.497 1.27 11.52
63.276 0.74 2.53872 0.89 2.39 0.432 1.03 11.52
73.276 0.37 2.90736 0.89 2.39 0.376 0.90 5.76
83.276 0.00 3.276 1.02 2.26 0.327 0.74
93.276 0.00 3.276 1.15 2.13 0.284 0.61
10 3.276 03.276 1.15 2.13 0.247 0.53
Interest rate 15.00%
Total = Net present value = 5.31
0.82907276
5