
New Products Management 11e / Crawford & Di Benedetto Toolbox Exercises
The PRICING Model
For Use with the PRICING Excel Spreadsheet
PRICING is a product line pricing model incorporating each product in the product line. It
allows “what-if” analysis of the effects of various price changes on the contribution to profit for
a given product or proposed new product. When the new product pricing is incorporated into the
entire product line, the “what-if” analysis shows not only the effect on contribution to profit, but
also the extent to which price changes in a particular product cannibalize other products in the
product line or take market share away from competitors’ products. In other words, prices can be
investigated for their effect on quantity sold, where that quantity sold comes from (our own
product line or our competitors’), and what the impact is on each individual product’s
contribution to profit as well as total company profit.
This model allows you to evaluate the effect of a price change on the demand for the good in
question, as well as other goods in the product line, by estimating and using price elasticities,
defined as follows:
Elasticity (e) = % change in quantity demanded / % change in price.
INPUT
Manufacturer’s Selling Price—This is the unit price for the product to be investigated
(Spreadsheet 1) as well as the other products in the product line (Spreadsheet 2).
Quantity Sold—This is the estimated unit sales in thousands for the new product (Spreadsheet
1) as well as the unit sales of the other products in the product line expressed as a function of the
new product.
Variable Costs—Enter here the per unit variable cost for the new product (Spreadsheet 2).
Fixed Costs—Enter the total fixed costs in dollars allocated to the new product (Spreadsheet 1)
as well as for all products in the line (Spreadsheet 2).
Indirect Overhead—In Spreadsheet 2, the total company dollar amount of indirect overhead
(the remainder of the overhead not allocated to a particular product) is entered.
141

New Products Management 11e / Crawford & Di Benedetto Toolbox Exercises
Price Elasticity of Demand—In Spreadsheet 2 you must enter the elasticity of demand of the
new product with respect to price. This represents the percent change in quantity demanded for a
1% change in price. Since most goods have a downsloping demand curve, one would expect this
figure to be negative; a price decrease stimulates increased sales. An elasticity between –1 and 0
indicates inelastic demand: demand increases somewhat when price is cut but not enough to
stimulate a revenue increase. If elasticity has an absolute value above 1 (for example, -2, -3, and
so on), demand is said to be elastic. Additional demand stimulated by the price cut is more than
enough to offset the reduced price and result in greater revenue for the firm.
Cross-Elasticity of Demand—In Spreadsheet 2 you also enter the effect of a price change of the
new product on demand for two other products in the product line. This is referred to as the
price cross-elasticity of demand. If the two other goods are substitutes, one would expect
cross-elasticity of demand to be positive: cutting price of the new good stimulates sales of the
new good at the expense of the other goods. Should the other goods be complements,
cross-elasticities would be expected to be negative.
OUTPUT
Contribution to Profit—This is the amount that each product contributes to the total profit of
the company. Variations in this figure can be observed by varying the price of the product.
Company Profit—This is found in Spreadsheets 2 and 3 and is the total of the contributions of
all products in the line. “What-if” variations of the product price produce changes in the
contributions of all products and this relationship can be seen in terms of its effect on total profit.
Average Fixed Costs (AFC) per Unit—The “what-if” price analysis produces changes in the
quantity of each unit sold and the effect on the per-unit fixed costs and per-unit total costs can be
seen here. These figures apply only to the new product.
PRICING Exercise
Titanic Products, manufacturer of kitchen gadgetry, makes two models of crock pots, the
Standard and the Deluxe. Standard is priced at $35 to retailers (manufacturer’s selling price),
and Deluxe at $40. Manufacturer’s variable costs are $25 and $28 per unit respectively, and
fixed costs directly attributable to each model are $1 million and $1.4 million respectively. Last
year, Titanic sold 350,000 Standard and 300,000 Deluxe models. The company is thinking of
launching a new top-of-the-line model, the Stupendous, featuring super-quality pottery liner and
designer colors. It is anticipating a selling price to retailers of $50, and projects variable and
direct fixed costs at $35 per unit and $1.2 million respectively. It also believes that at this price it
can sell 150,000 units of the Stupendous. Most retailers always add on the same dollar margin
on this item, so a price increase to retailers is passed on to the consumer.
142
New Products Management 11e / Crawford & Di Benedetto Toolbox Exercises
Through extensive consumer testing, it was determined that the demand for the new Stupendous
line was quite sensitive to price. Price elasticity of demand was estimated at –2. The Standard,
Deluxe, and Stupendous models are all substitutes for one another, and cross-elasticities were
estimated at 1.2 for the Standard and 1.3 for the Deluxe. Indirect overheads for the crock pot
line are $4.2 million.
(a) What is the projected contribution to profit of each line if the $50 manufacturer’s selling
price is chosen for the Stupendous model?
(b) How are quantities sold, contribution to profit, and product line profit (identified in the
spreadsheet at Company Profit”) affected by a slight price increase on the Stupendous? A
slight price decrease?
(c) Considering only the profit contribution of the Stupendous, would you recommend a price
increase? Considering overall product line profit, would you recommend a different price
increase? If your recommendation changed, explain why.
Answer:
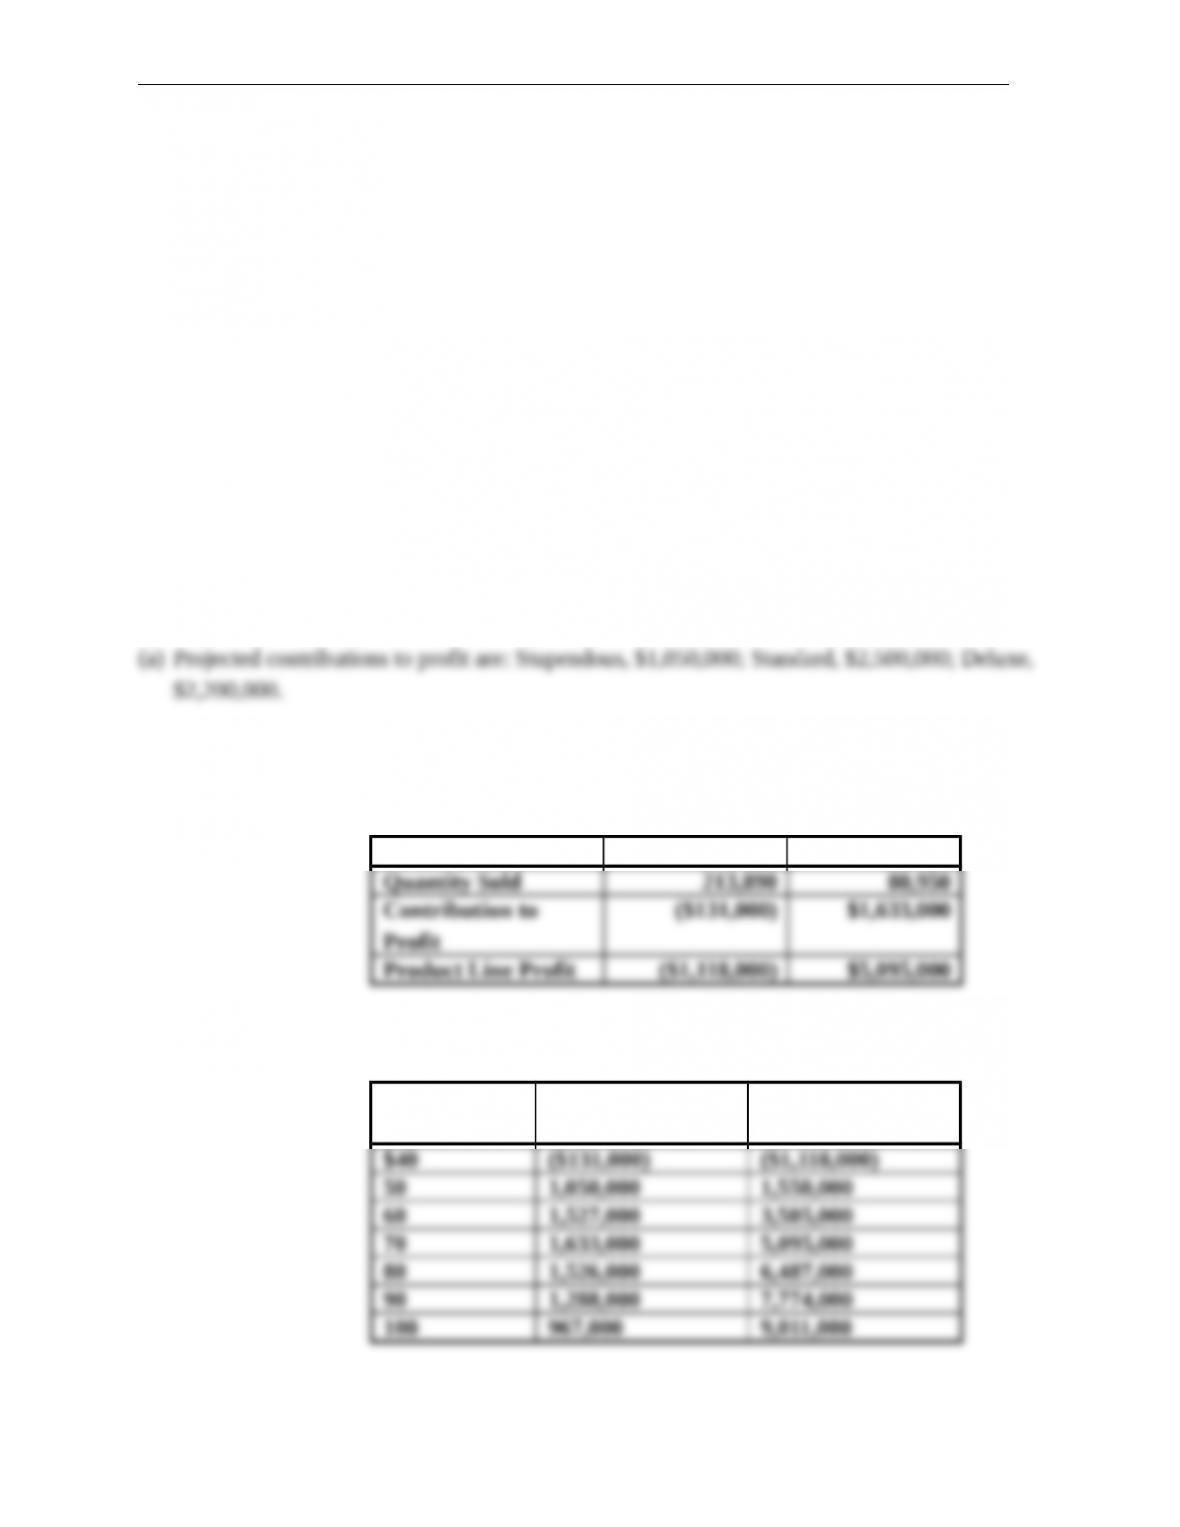
(b) One possibility is to try a price increase to $70, and a price decrease to $40 (other price levels
also acceptable).
Price $40 Price $70
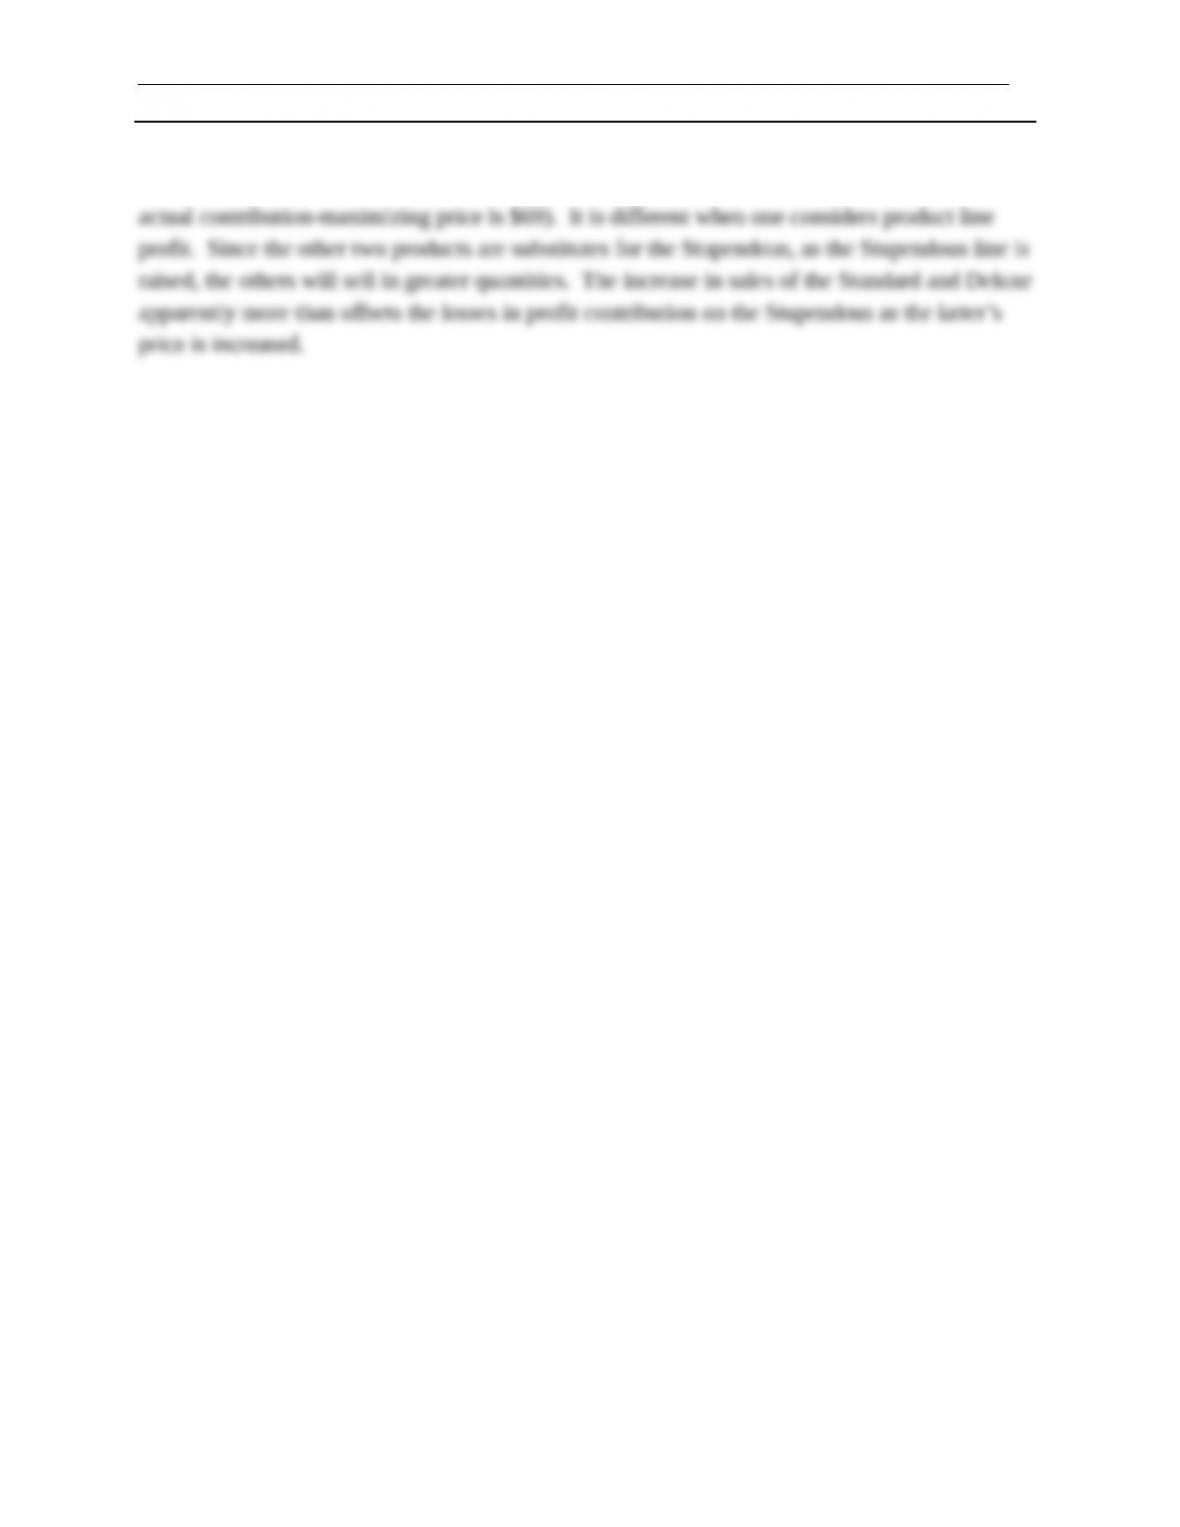
(c)
Price Contrib. To Profit Product Line
Profit
143
New Products Management 11e / Crawford & Di Benedetto Toolbox Exercises
If one were to base the Stupendous pricing decision strictly on maximizing the new product’s
contribution to profit, one would choose a price of about $70 according to the above table (the
144