The PERCEPTOR Model
For Use with the PERCEPTOR Excel Spreadsheet
The PERCEPTOR model was originally developed by Glen Urban in 1975. This model is
designed to make projections of long-run market share based on positions of existing and
proposed brands and ideal points. Long-run market shares are estimated using squared distances
from the ideal brand, managerial assessment of awareness and availability of the brand, and
probabilities of trial and repeat purchase.
The model as represented here also estimates the extent of market share draw from competing
brands. A positioning map can be drawn from the input data for easy comparison of alternative
positioning strategies. PERCEPTOR allows you to investigate the effect of various positions for
your product relative to competitors and relative to the ideal preferences of various market
segments.
The position of competitive products can be compared with consumers’ ideal preferences to see
how well competitors have preempted the positions of the most preferred attributes. The new
brand can then be positioned on a trial basis to determine how much market share it will obtain
based on its position relative to competitors and ideal preference positions for each segment.
The objective is to determine which attributes to emphasize and which segments to target to
product the maximum market share for the new product.
The PERCEPTOR model provided here allows the user to model either a three-brand or a
four-brand industry.
INPUT
Attribute Coordinates by Segment for Ideal Brands—These are locations on the perceptual
map of the attribute preferences (ideal brands) for each market segment. They are input as
coordinates representing the positive or negative distances from the origin along each attribute
(dimension).
Brand Positions—These are the locations on the perceptual map for the new product (Your
Brand) and for competitors’ products. The brand positions for competitors’ brands represent the
coordinates on the perceptual map for each competing brand according to consumers’ ratings on
the attribute dimensions. Coordinates for your brand can be entered according to the distance
you want to position your brand from the origin along each attribute dimension. You may
conduct “what-if” analysis by changing the position of your product and observing the effect on
market share.
Total Market Sales—This is the estimated size of the potential market for the product class.
Size of Segment Relative to Market—These values represent the relative size of each segment
and should add to 1.
OUTPUT
Market Share Analysis—Based on the position of the new brand in relation to the position of
the other brands and the consumer attribute preferences, the market share percentage captured by
each brand will be calculated.
PERCEPTOR Exercise
A locally based pharmaceutical company manufactures a headache remedy, Feelgood. You have
been hired to assess the current positioning of Feelgood relative to major competitors, as
perceived by consumers, and to make recommendations for repositioning if necessary.
Consumers consider two attributes to be of prime importance when selecting a headache remedy:
gentleness and effectiveness. In fact, these benefits define three segments that exist in this
market: consumers who want the most effective brand (about 20% of the market), those who
want the gentlest brand (about 50% of the market), and those who want a balance between the
two benefits (the remainder). These are referred to as Segments 1 through 3 respectively.
Feelgood, and Brand B, are the gentlest brands on the market, whole C and D are judged to be
more effective by consumers. You have the following information about segment preferences and
perceived brand positions:
Attribute 1
(Gentleness)
Attribute 2
(Effectiveness)
Segment 1’s Ideal -1 2
Segment 2’s Ideal 2 -1
Segment 3’s Ideal 1.5 1.5
Attribute 1
(Gentleness)
Attribute 2
(Effectiveness)
Feelgood’s Position 1 -1.25
Brand B’s Position 1.75 -0.5
Brand C’s Position -1.5 0.5
Brand D’s Position -0.5 1.5
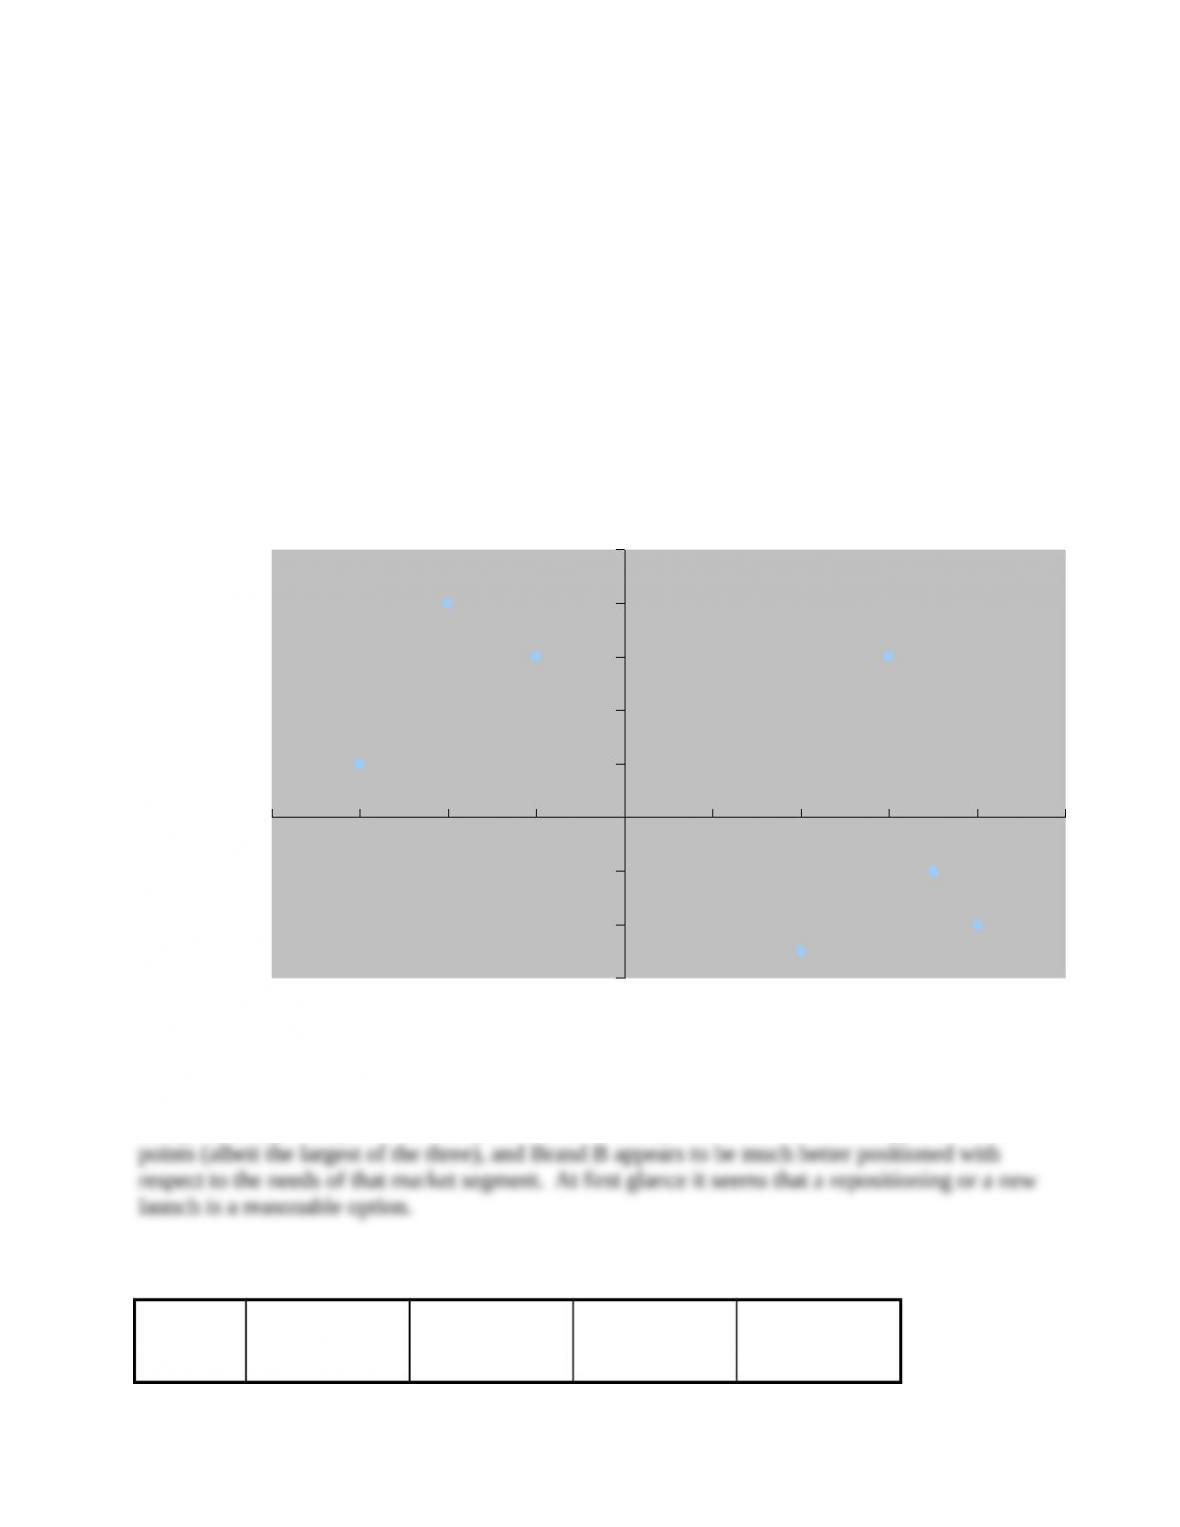
(a) Obtain a perceptual map that reflects current perceived positions. What can you say about
Feelgood’s position? Is it well situated in this market?
(b) What is the current market share of the Feelgood brand? Try several other positions for
Feelgood, justifying each one (i.e., try to move close to ideal segments, away from
competitors, and so on). Would you recommend any of these positions as particularly good
from Feelgood’s point of view?
(c) What other considerations should go into your repositioning recommendations?
(d) Suppose Brand B defensively repositions itself closer to the gentleness-seeking segment
(Segment 2). Choose a position close to (but not right at!) this segment’s ideal point for
Brand B’s new position and determine what the effect is on Feelgood’s market share.
Answer:
-2 -1.5 -1 –0.5 0 0.5 1 1.5 2 2.5
-1.5
-1
-0.5
0
0.5
1
1.5
2
2.5
Attribute 1
Attribute 2
(a) Current perceived positions:
Feelgood is apparently not that well positioned. It is only near one of the three segments’ ideal
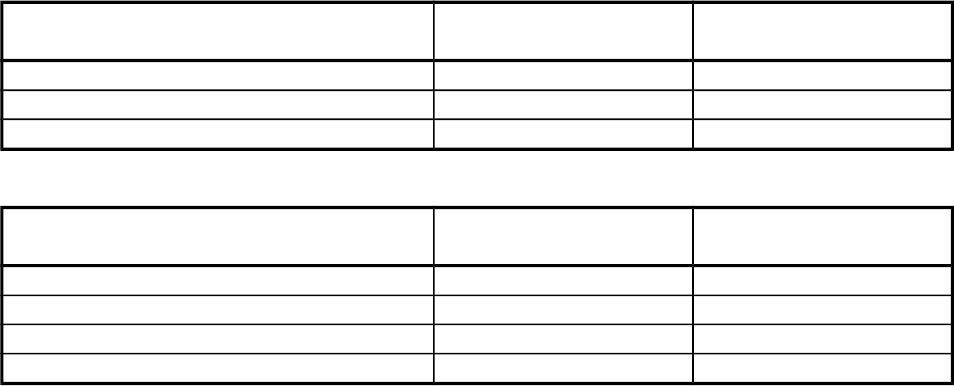
(b) The current market share is 23.14% (see table below).
BRAND SHARE IN
SEGMENT 1
SHARE IN
SEGMENT 2
SHARE IN
SEGMENT 3
TOTAL
MARKET
SHARE
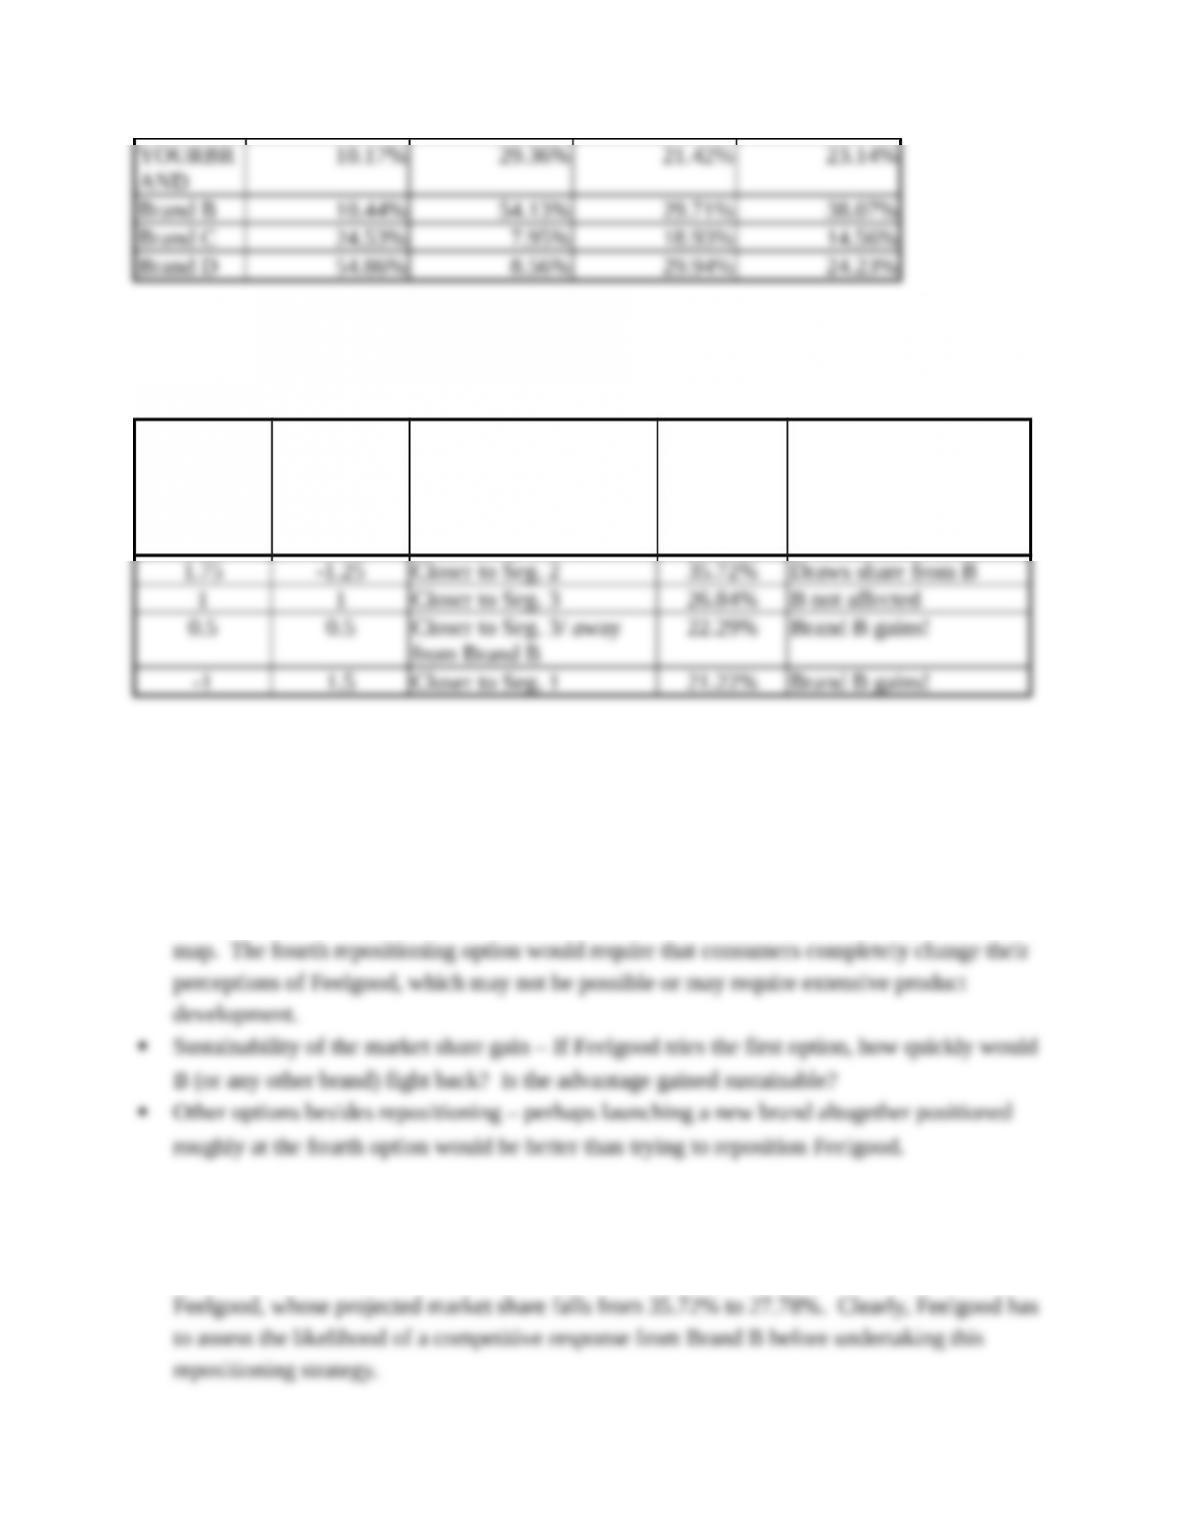
Several other reasonable positions for Feelgood, and forecasted market shares, appear below.
Clearly, there are many other possible solutions to this question.
(c) Other considerations would include:
Repositioning costs – these escalate rapidly as the distance increases.
Likelihood of achieving desired perceptual position – Feelgood is best known for being
gentle and does not have a strong reputation for effectiveness, judging from the positioning
(d) Say that Feelgood tries the first option given above (1.75, -1.25), and Brand B defends itself
by moving to (2, -0.75), which is closer to Segment 2’s ideal point. Brand B can potentially
increase market share from 28.32% to 37.14%, with most of that gain drawn directly from
POSITION
ON ATT. 1
POSITION
ON ATT. 2
STRATEGY RESULTIN
G MKT.
SHARE
(FEELGOO
D)
COMMENTS