The FINANCIAL Model
For Use with the FINANCIAL Excel Spreadsheet
This basic financial worksheet is similar in form to the one accompanying the Bay City
Electronics case in the New Products Management textbook. It allows a wide range of flexibility
in inputs – for example, you must calculate depreciation separately and enter your figures here –
yet at the same time can calculate realistic five-year projections and useful diagnostics to assess
the financial viability of a new product proposal.
INPUT
The Market or Category—The market for the new product is defined carefully, and the growth
rate assumption is noted. Also, the current total market unit and dollar volumes are recorded.
Product Life—The number of years used in the economic analysis of new products is usually set
by company policy, but any particular project may be an exception.
Pricing—Start with the end-user list price, work back through the various trade discounts to get
a factory net, then deduct any planned special discounts and allowances. The average dollars per
unit sold is the price used in worksheet calculations.
Production Costs—Is anything unusual being done on this project? Actual anticipated cost goes
directly onto the financial worksheet.
Future Special Expenditures—These typically include factory facilities, licensing rights, the
one-time introductory marketing cost, up-front payments to suppliers, further R&D on
improvements and line extensions, and plant expansions as volume grows. These are all
investment outflows.
Working Capital—This estimates cash, inventories, and receivables needed to support the sales
volumes. How are they to be recovered?
Applicable Overheads—Some firms assign only direct overheads–those caused by the new
product (such as an expanded sales force or a new quality function). Other firms believe
overheads tend to grow as functions of volume and should be included.
Net Loss on Cannibalized Sales—These are dollar sales lost as the new product steals sales
from current products. This is to be deducted from revenue. Some experts believe if we don’t do
this a competitor will, so they omit it.

Future Costs/Revenues of Project Abandonment—Along the way, the project may have
accumulated facilities, people, patent rights, inventories, and so on. If abandoned now, disposal
of these will produce revenue, money that is actually a cost of abandoning the project. In some
cases (e.g., expensive disposal of radioactive chemicals), there may be a revenue of going ahead.
Tax Credits—Federal or state incentives for activity in the public interest.
Applicable Depreciation Rate—Policy question, set by management.
Federal and State Income Tax Rate—Company figure, provided.
Required Rate of Return—This tells us the cash flow discount rate to be used, and can be
complex and political. Theoretically, the figure to use is the weighted average cost of capital,
including the three sources of capital–debt, preferred stock, and retained earnings. Often is
simply the firm’s current borrowing rate. May be the rate of earnings from current operations.
Basic Sales and Cost Forecasts—The primary data inputs: the number of units to be sold, the
direct production cost per unit, and the total marketing expenditures.
OUTPUT
Net Present Value (NPV)—The sum of the discounted cash flows over the life of the product.
FINANCIAL Exercise1
Financial analysis of new products at Bay City Electronics had always been rather informal. Bill
Roberts, who founded the firm in 1970, knew residential electronics because he had worked for
almost seven years for another firm specializing in home security systems. But, he had never
been trained in financial analysis. In fact, all he knew was what the bank had asked for every
time he went to discuss his line of credit.
Bay City had about 45 full-time employees (plus a seasonal factory work force) and did in the
neighborhood of $18 million in sales. His products all related to home security and were sold by
his sales manager, who worked with a group of manufacturers’ reps, who in turn called on
wholesalers, hardware and department store chains, and other large retailer. He did some
consumer advertising, but not much.
Bill was inventive, however, and had built the business primarily by coming up with new
techniques. His latest device was a remote-controlled electronic closure for any door in the
home. The closure was effected by a special ringing of the telephone: for example, if a user
wanted to leave a back door open until 9:00 p.m. it was simple to call the house at 9:00 and wait
for 10 rings, after which the electronic device would switch the door to a locked position. A
similar call would reopen the door.
1 This is a condensed version of the Bay City Electronics case in the New Products Management text by Crawford
and Di Benedetto.
The bank liked the idea but wanted Bill to do a better job of financial analysis. Based on his
understanding of this market, Bill filled out the FINANCIAL worksheet as appears at the end of
the exercise. To date, Bay City had spent $85,000 in expense money for supplies and labor
developing the closure and had invested $15,000 in a machine (asset). If the company decided to
go ahead, it would have to invest $50,000 more in a new facility, continue R&D to validate and
improve the product, and–if things went according to expectations–invest another $45,000 in
year 3 to expand production capability.
(a) Use the given data to calculate the NPV for the electronic closure product. Do the numbers
look good?
(b) How is NPV affected if the following contingencies occur? (Assess each of these separately.)
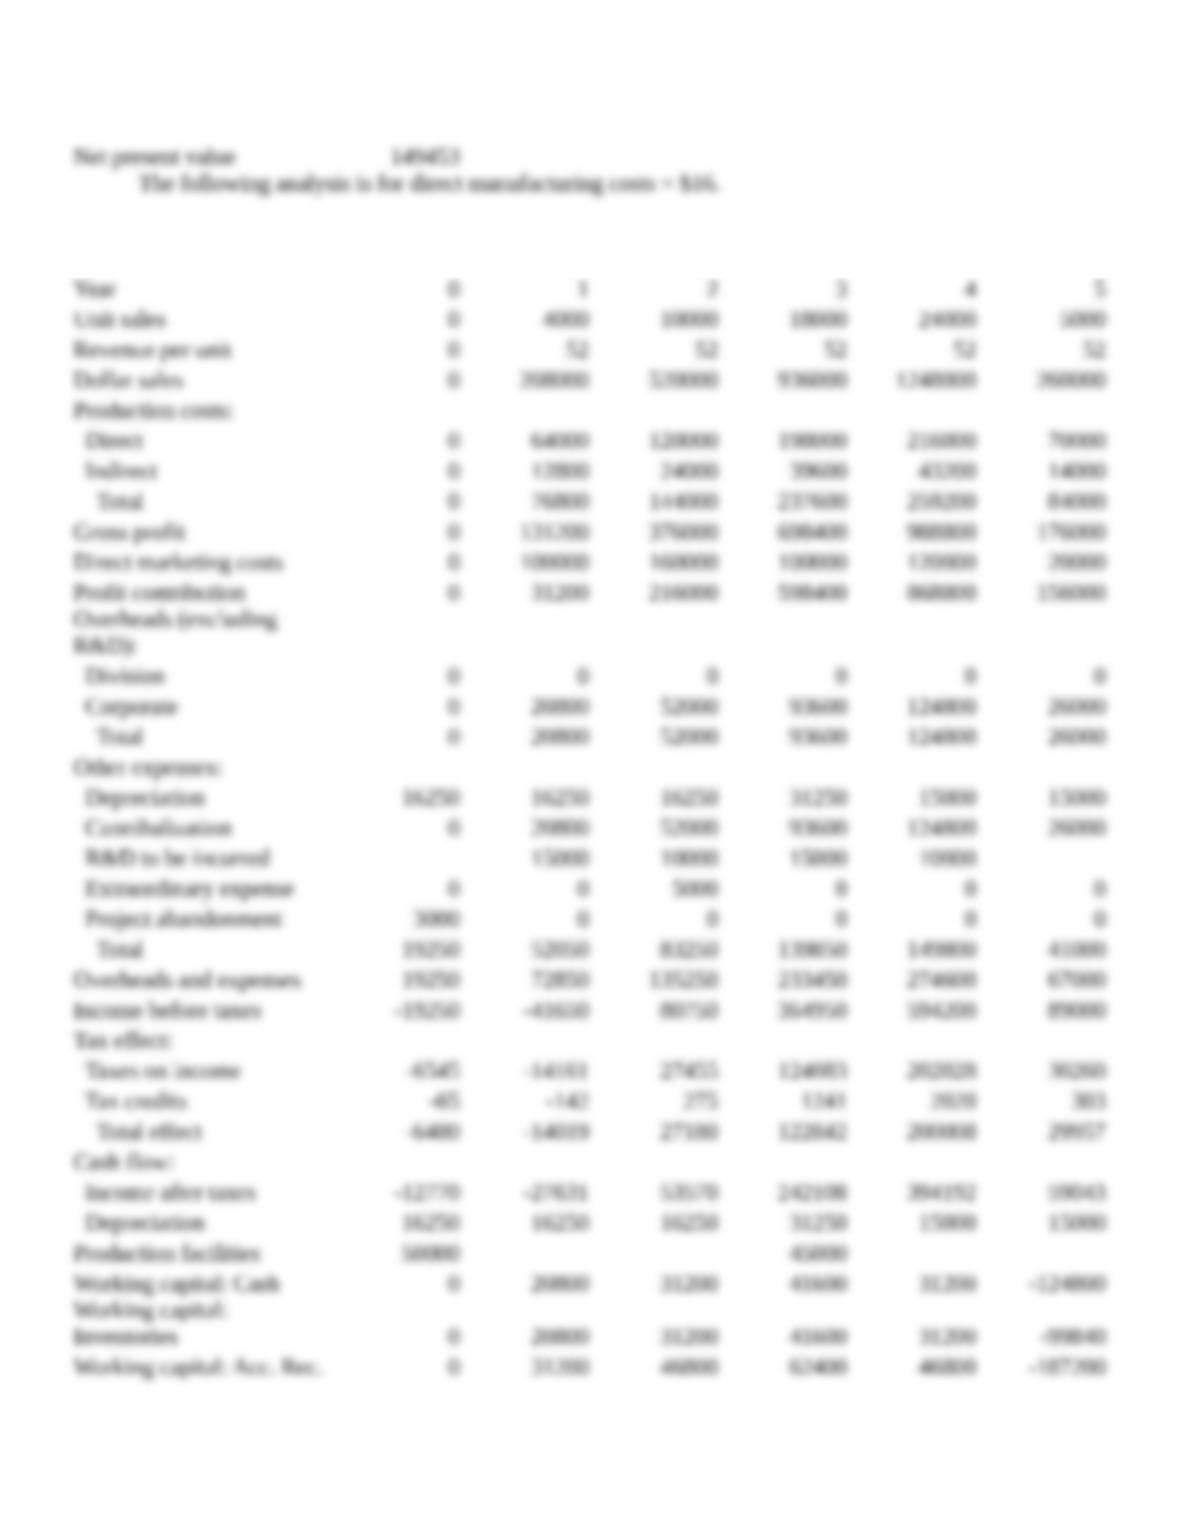
1. Direct manufacturing cost estimate may be overly optimistic, and may never get below
the original $16.
2. Competition may force higher marketing costs – what if starting in year 2 the level that
must be spent is exactly twice what was forecasted above?
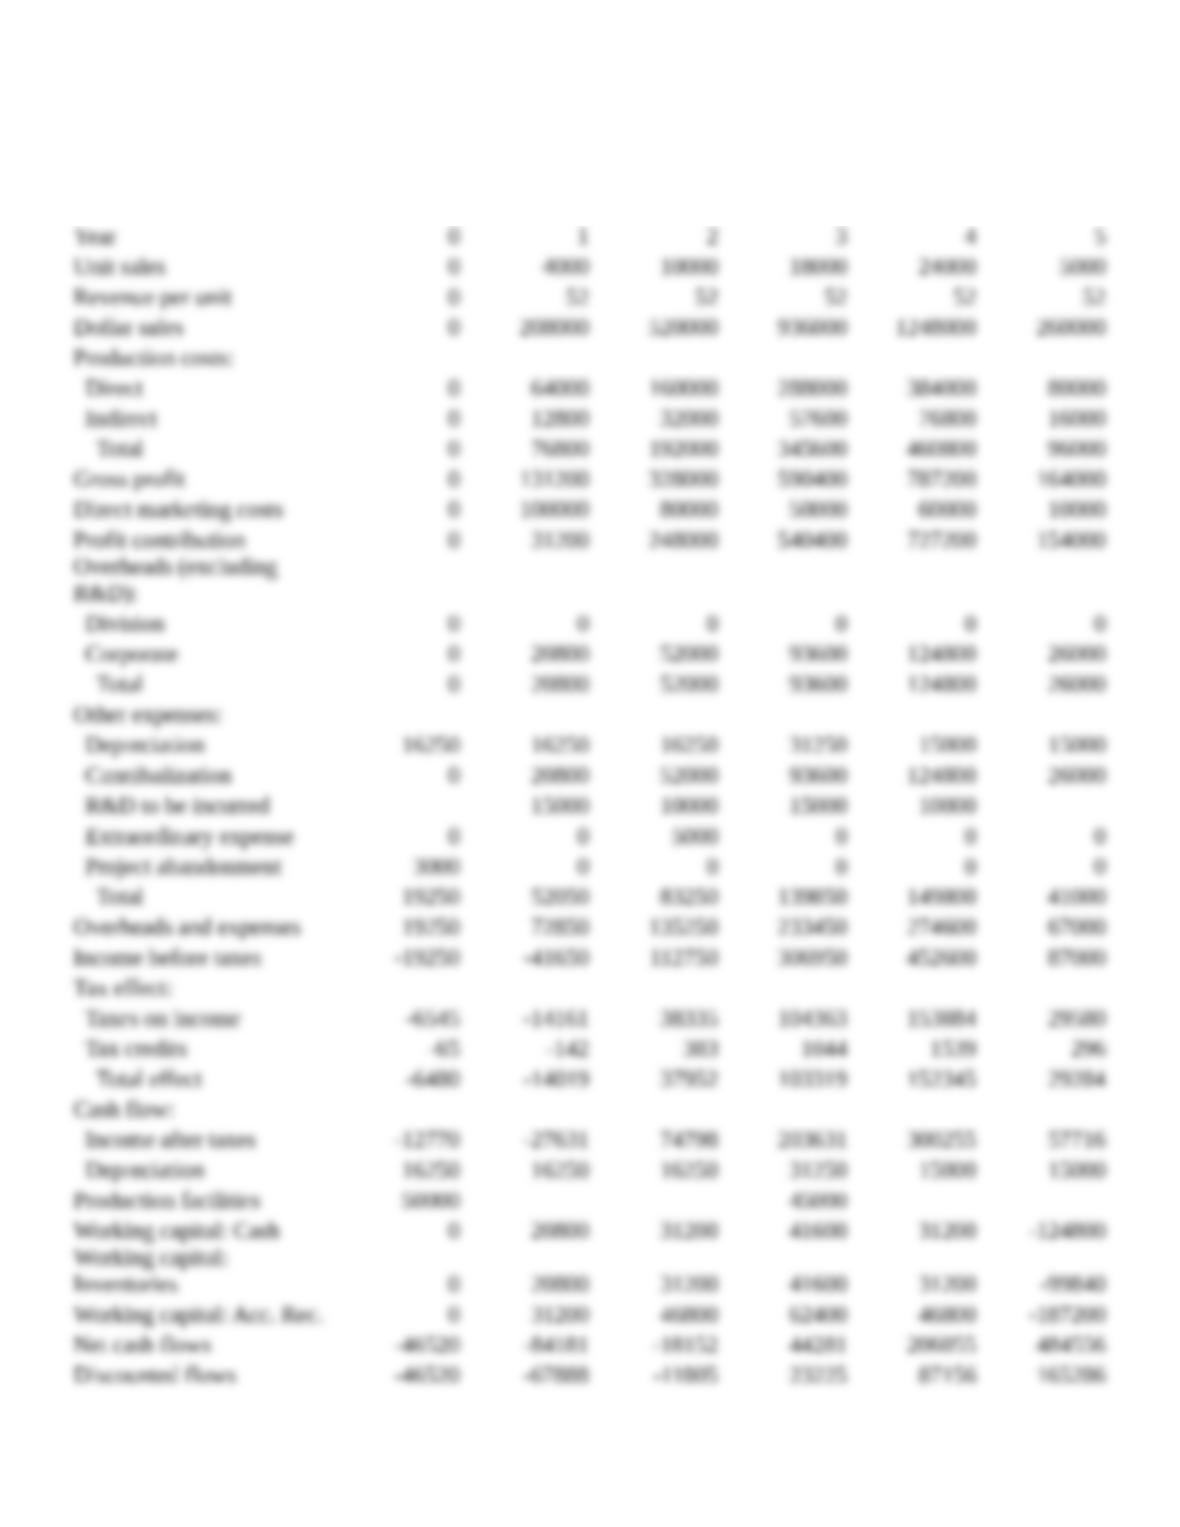
Year 0 1 2 3 4 5
Unit sales 0 4000 10000 18000 24000 5000
Revenue per unit 0 52 52 52 52 52
Dollar sales 0 208000 520000 936000 1248000 260000
Production costs:
Direct 0 64000 120000 198000 216000 70000
Indirect 0 12800 24000 39600 43200 14000
Total 0 76800 144000 237600 259200 84000
Gross profit 0 131200 376000 698400 988800 176000
Direct marketing costs 0 100000 80000 50000 60000 10000
Profit contribution 0 31200 296000 648400 928800 166000
Overheads (excluding
R&D):
Division 0 0 0 0 0 0
Corporate 0 20800 52000 93600 124800 26000
Total 0 20800 52000 93600 124800 26000
Other expenses:
Depreciation 16250 16250 16250 31250 15000 15000
Cannibalization 0 20800 52000 93600 124800 26000
R&D to be incurred 15000 10000 15000 10000
Extraordinary
expense 0 0 5000 0 0 0
Project abandonment 3000 0 0 0 0 0
Total 19250 52050 83250 139850 149800 41000
Overheads and
expenses 19250 72850 135250 233450 274600 67000
Income before taxes -19250 -41650 160750 414950 654200 99000
Tax effect:
Taxes on income -6545 -14161 54655 141083 222428 33660
Tax credits -65 -142 547 1411 2224 337
Total effect -6480 -14019 54108 139672 220204 33323
Cash flow:
Income after taxes -12770 -27631 106642 275278 433996 65677
Depreciation 16250 16250 16250 31250 15000 15000
Production facilities 50000 45000
Working capital: Cash 0 20800 31200 41600 31200 -124800
Working capital:
Inventories 0 20800 31200 41600 31200 -99840
Working capital: Acc.
Rec. 0 31200 46800 62400 46800 -187200
Net cash flows -46520 -84181 13692 115928 339796 492517
Discounted flows -46520 -67888 8904 60803 143725 168001
Assumptions:
Tax Rate: 34%
Tax Credits (as % of tax rate): 1%
Cost of Capital: 24%
Working Capital:
Cash as % of Sales 10%
Invent. as % of Sales 10%
Accounts Receivable as % of
Sales 15%
WC Recovery in Year 5
% of Cash 100%
% of Inventory 80%
% of Accounts Rec. 100%
Answer:
(b) 1. If direct manufacturing cost stays at $16, NPV is $149,453, as shown on the next page: