The DEFENDER Model
For Use with the DEFENDER Excel Spreadsheet
DEFENDER is a positioning model first presented in a 1983 article by Hauser and Shugan. It
was originally designed to model the consequences of an attack by a new brand in a stable
market, but can be applied to other strategic positioning decisions. The DEFENDER model uses
a per-dollar map – that is, brand positions on attributes are scaled by price. The model takes
these positions and translates them into market shares by considering the Taste Distribution
Function of the intended market. This is rather technical in nature, but is related to the concept
of segmentation. For example, in choosing a running shoe, many customers might seek a
high-performance shoe, many might seek a fashionable shoe, but relatively few might look for a
product which is both high-performance and fashionable. In this case, there are two benefit
segments in the market, and this would be considered by the DEFENDER model in projecting
market shares.
INPUT
Attribute 1 and Attribute 2—Enter each brand’s rating on both attributes.
Price—Enter each brand’s selling price.
Fixed Costs—Enter each brand’s (estimated) yearly fixed costs.
Variable Costs—Enter each brand’s (estimated) variable costs per unit.
OUTPUT
Market Share—The DEFENDER model predicts likely long-run market share for each brand
given the positions on the per-dollar map provided above.
Unit Sales—Given the total size of the market, the model translates market share into unit sales.
Contribution Margin—Given variable costs, prices, and unit sales, the model calculates the
contribution margin generated by the sale of that brand.
Contribution to Profit—Subtracting fixed costs from contribution margin results in the
contribution of that brand to corporate profits.
DEFENDER Exercise
Defiant Telephone and Telegraph (DTT) makes several products sold in the long-distance
telecommunications market. One item it sells is a switching unit, selling for about $10,000 to
large and medium-sized companies. DTT faces two larger competitors for this market, and in
fact controls only about 15% of the market at the present time. The table below shows the
position of the three brands on the two key attributes, Speed and Flexibility. DTT’s yearly fixed
costs are $4 million and it is assumed that competitors face about the same level of fixed costs.
Each brand (including DTT) is sold at a price of $10,000. Variable costs are half of the selling
price.
Attribute 1
(Speed)
Attribute 2
(Flexibility)
Brand 1 35 10
Brand 2 (DTT) 26 21
Brand 3 10 33
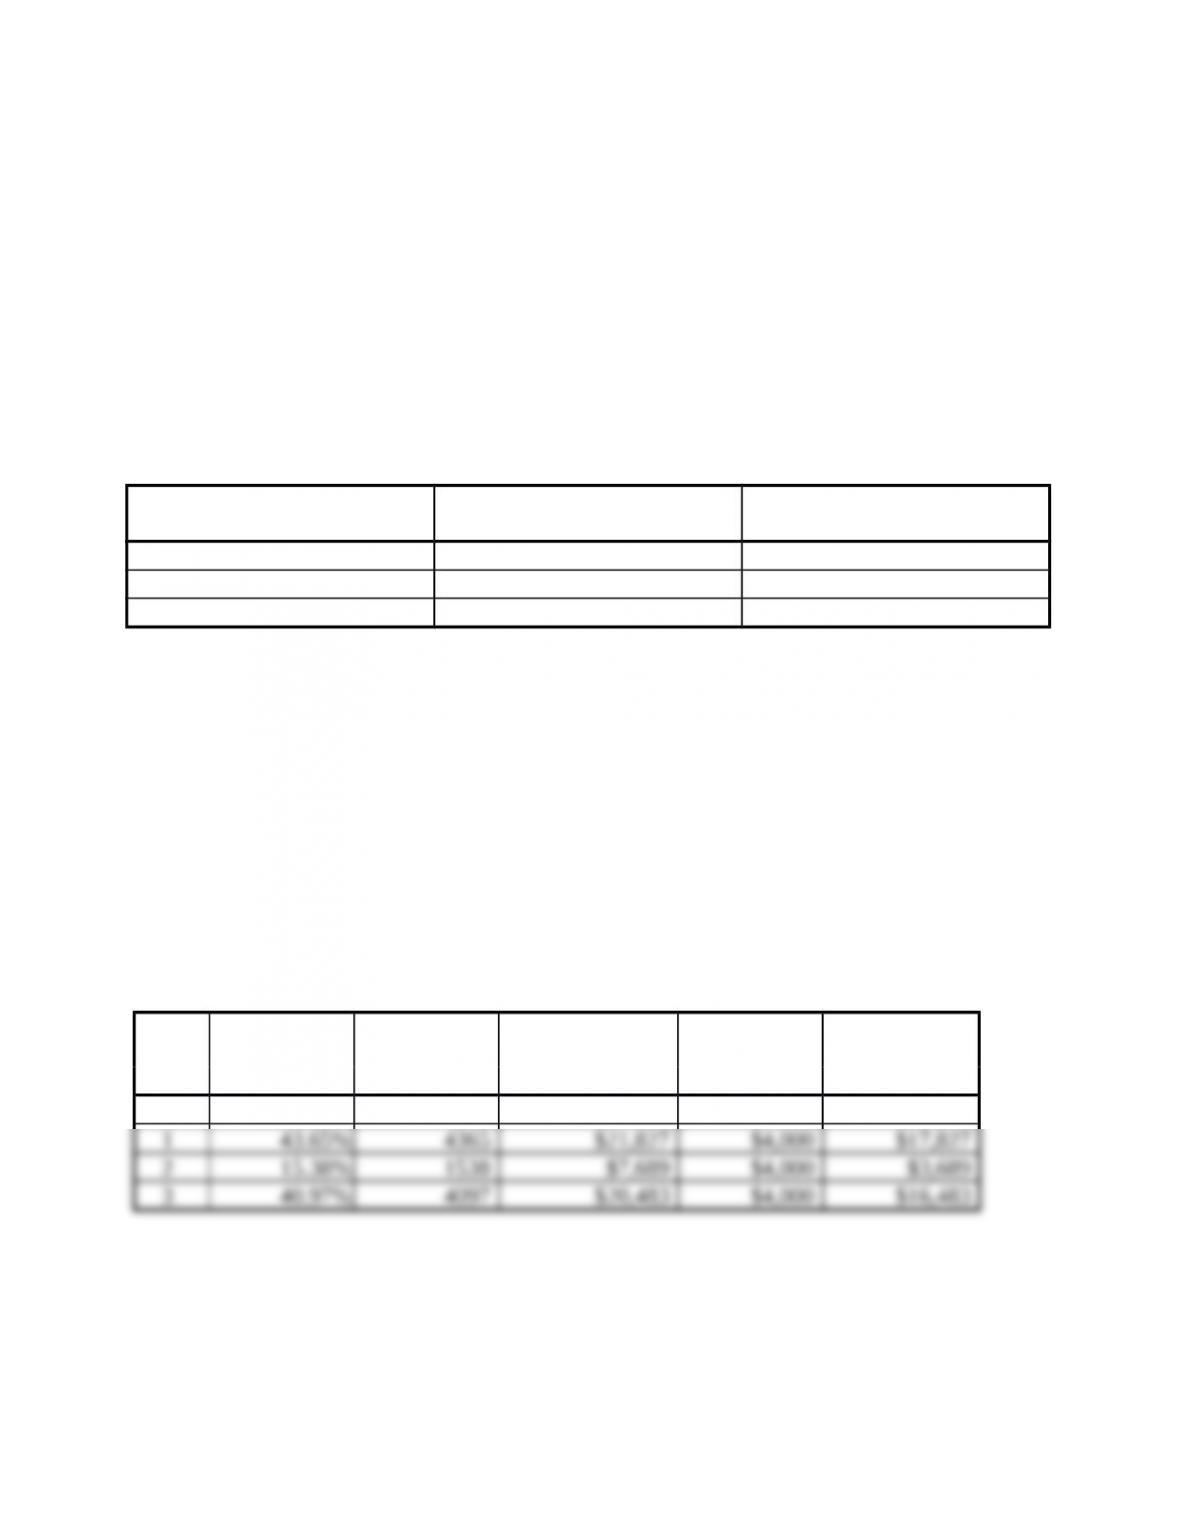
(a) What are the projected market shares and profit contributions should the three brands remain
positioned as they are? (Total size of this industry is 10,00 units sold per year.)
(b) Can DTT improve its profit contributions greatly by increasing its rating on Speed? By
improving its rating on Flexibility? Why or why not?
(c) Would you recommend a price increase or decrease for DTT? If yes, justify your
recommended change.
(d) Is it possible for DTT to find a positioning such that it can earn a long-run profit contribution
as high as $22 million?
Answer:
(a)
BRAN
D
MARKET UNIT CONTRIB. MINUS
FIXED
CONTR. TO
SHARE(%) SALES MARGIN($000) COSTS($000) PROFIT($000)
The figure below shows the DEFENDER positioning map.
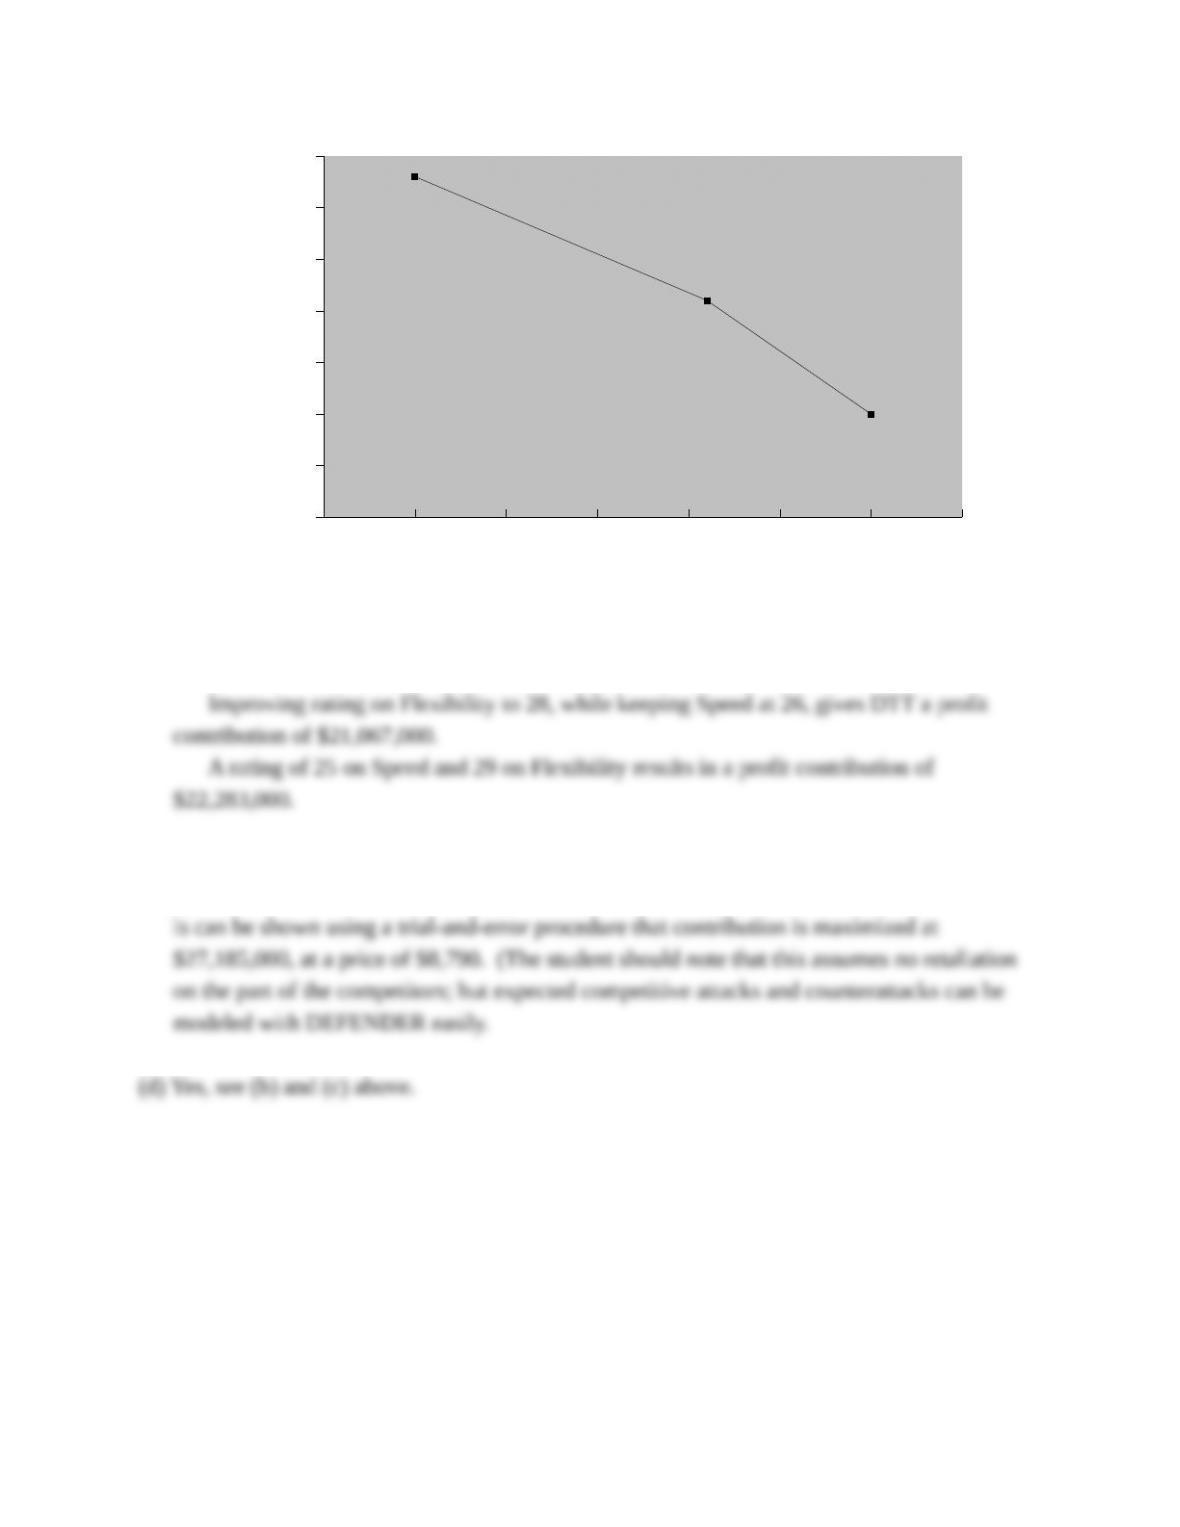
0.500 1.000 1.500 2.000 2.500 3.000 3.500 4.000
0.000
0.500
1.000
1.500
2.000
2.500
3.000
3.500
Attribute 1/$
Attribute 2/$
(b) Improving rating on Speed to 32, while keeping Flexibility at 21, gives DTT a profit
contribution of $21,630,000.
(c) Cutting price on DTT can improve profitability, but only to a point. Cutting price too low
builds market share but erodes margins. If the attribute ratings of 25 and 29 are maintained,