The BASS Model
For Use with the BASS Excel Spreadsheet
The BASS model was first developed in 1969 by Frank Bass. It is a sales growth model that
predicts future product class sales for a durable good, using historical product sales levels.
Managerial estimates of initial probability of trial (the probability that a purchase will be made
early in the introductory phase of the product life cycle) and of imitation or diffusion rate
(reflecting the influence of positive word-of-mouth communication) are also required. Given
these estimates, the sales of the product class at time t are estimated by the model as:
s(t) = p(0)m + [q-p(0)]Y(t) – (q/m) [Y(t)2],
where p and q are the initial trial probability and diffusion rate parameters, m is the number of
potential buyers, and Y(t) is the total (cumulative) number of purchases by time t.
The Bass diffusion curve works on the principle that the growth rate of the market will follow a
diffusion curve similar in shape to the product life cycle. Future sales can be predicted as a
function of the sales histories of the products in the product class. The initial cumulative rate of
diffusion (growth in cumulative sales) is based on the rate of acceptance of the product by
innovators. Following the early purchases by innovators, the growth rate accelerates due to
word-of-mouth influence and the increase in the number of products in use. As more members
of the total potential market acquire the product (that is, cumulative sales approach market
potential), the growth rate slows. The rate of diffusion is accelerated or retarded by the price
evolution of the product.
INPUT
Market Size (000s)—This is the estimate of the total market potential in thousands of
customers. This is the number of initial purchasers only and does not include repeat purchases.
In other words, it is the number of potential buyers who might become users of your product
over time regardless of how many times they purchase the product. This projection is based on
the planned initial price of the product, not whether subsequent price increases or decreases are
anticipated.
Innovation Rate—This is the estimate of the parameter that represents the initial probability of
trial. It is the rate at which innovators will purchase the product in the early stage of product
introduction. Innovators are usually first into the market and are the opinion leaders who
influence adoption of the product by others. Innovation rate is a parameter between 0.00 and
1.00, and the closer to 1.00, the more quickly it is estimated that the innovators will adopt the
product.
Imitation Rate—This is the estimate of the parameter that represents the rate of diffusion. It is
the rate at which other adopters will try based on the early purchases by innovators and
word-of-mouth influence. Imitation rate is a parameter between 0.00 and 1.00, and the closer to
1.00, the more rapid will be the diffusion of the product into the total potential market.
Initial Price—This is the introductory price of the product.
Final Price—This reflects the price evolution during the time of market growth. Price increases
after introduction will slow the rate of diffusion and price increases will accelerate the rate of
diffusion.
OUTPUT
Sales—This is the number of new customers who will purchase the product during each quarter
based on the rate of diffusion. The magnitude of the increase, leveling-off, or decline from
quarter to quarter allows an assessment of the rate at which the product is penetrating the
potential market.
Cumulative Sales—This is the total number of customers in the potential market for the product
who have made a purchase of the product. It is a measure of the extent to which the product has
penetrated the total market. It is not total unit sales, but total number of first-time buyers.
BASS Exercise
You work for Titanic Products, a manufacturer of electric kitchen accessories, as an assistant in
market research. Titanic is currently developing a new kitchen gadget, a combination coffee
grinder-toaster oven, to be offered for sale at $50. The company estimates that long-run potential
for this product is 25,000,000 households. Innovation rate and imitation rate for products in this
category have tended to be in the ranges of 2% and 12% respectively in the past, and
management plans to use the same figures in their projections for the new gadget.
(a) If these parameters are correct, how long will it take for cumulative sales of this product to
reach 5 million units? 10 million units? Plot quarterly sales figures and interpret the shape
of the graph you obtained. If initial price remained at $50, but price were gradually
decreased to $45 over the next few years, what impact would this have on sales patterns?
(b) You think that Titanic is heading for a major disappointment with this product. First, you
believe the market potential estimate is greatly overstated. Second, you feel that the
innovation and imitation rates are somewhat overly optimistic. Revise each of these
parameters downward (use your own judgment on how much to decrease each one), and
assess the impact on the quarterly and cumulative sales pattern.
Answer:
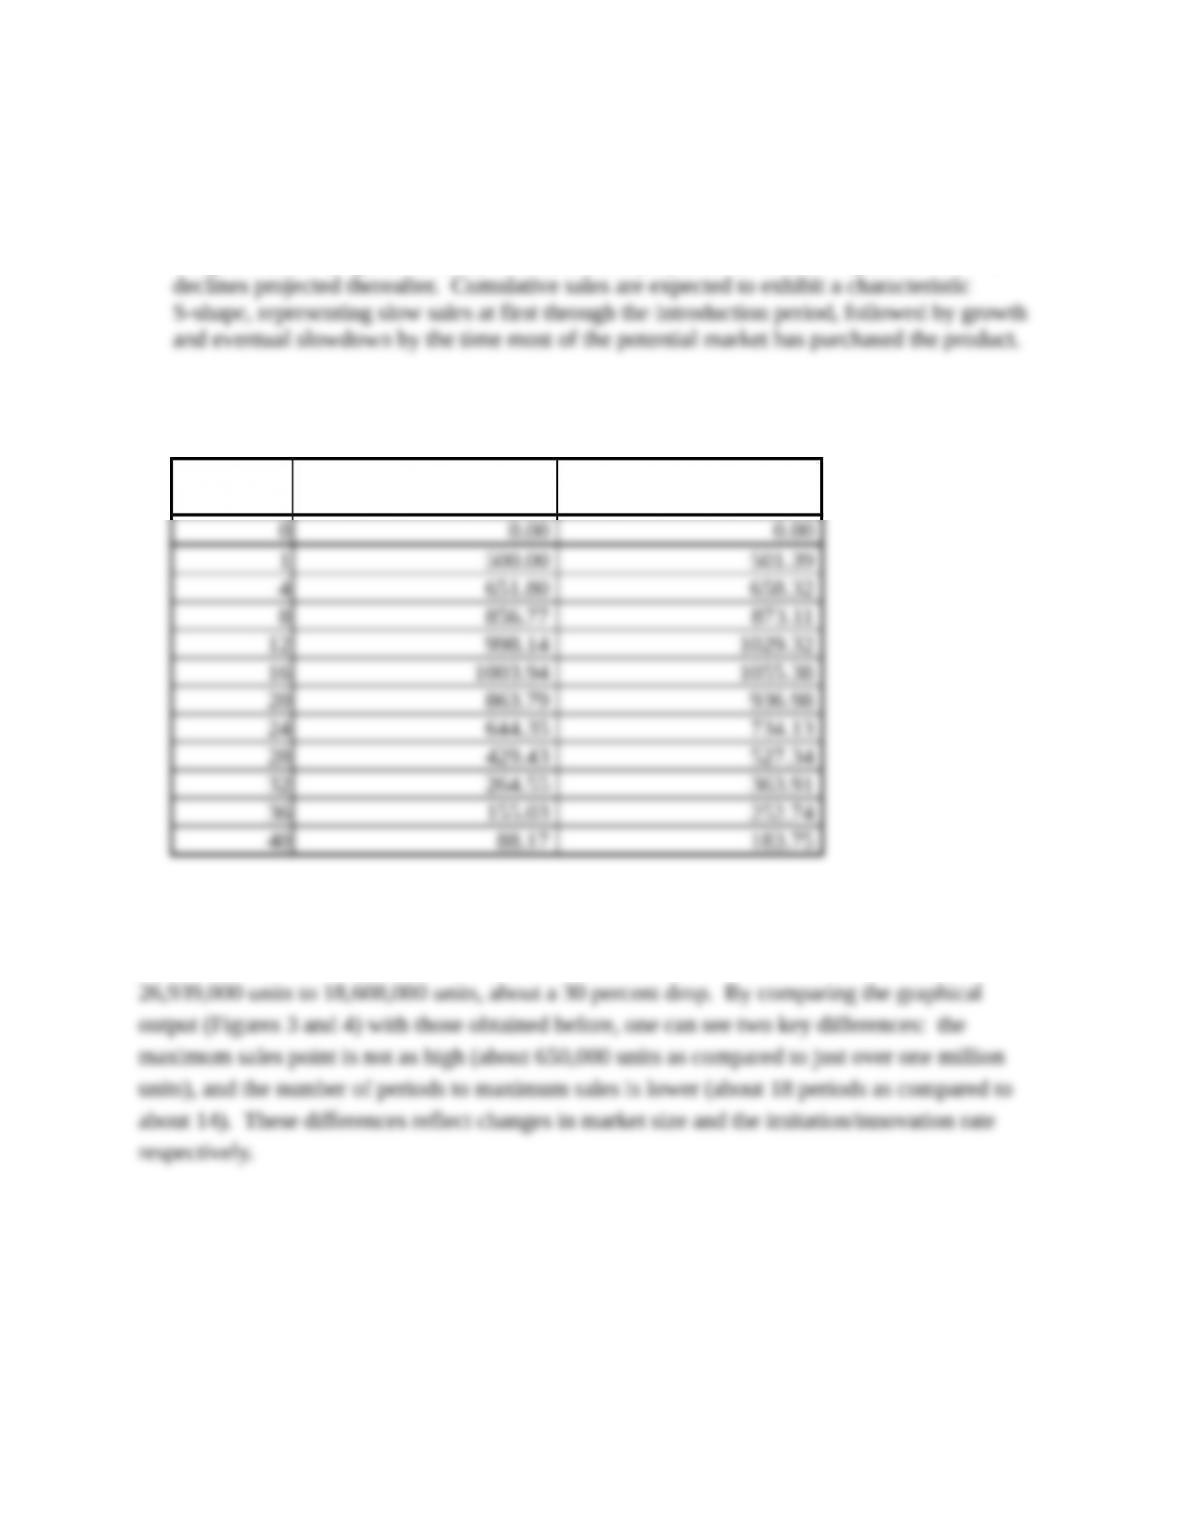
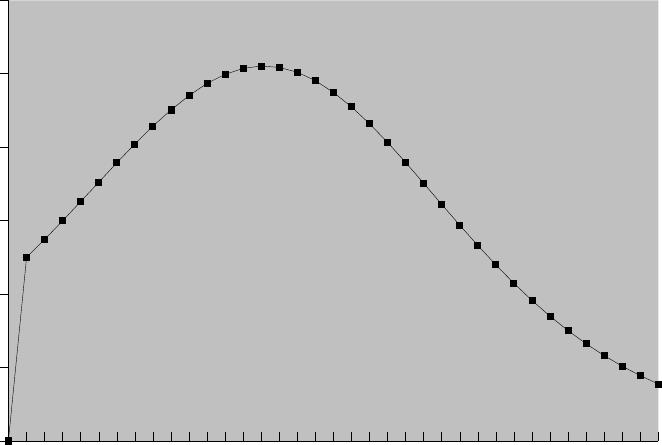
(a) Five million units are attained by the end of Quarter 8 (5,427,000 units). 10 million units are
attained by the end of Quarter 16 (13,296,000 units). Plots of quarterly and cumulative sales
are given below (Figures 1 and 2). Peak sales are projected for about 14 quarters out, with
If final price is revised downward to $45, some additional sales are generated in the latter
quarters, as the following comparison shows:
Quarter Sales
(Final Price $50)
Sales
(Final Price $45)
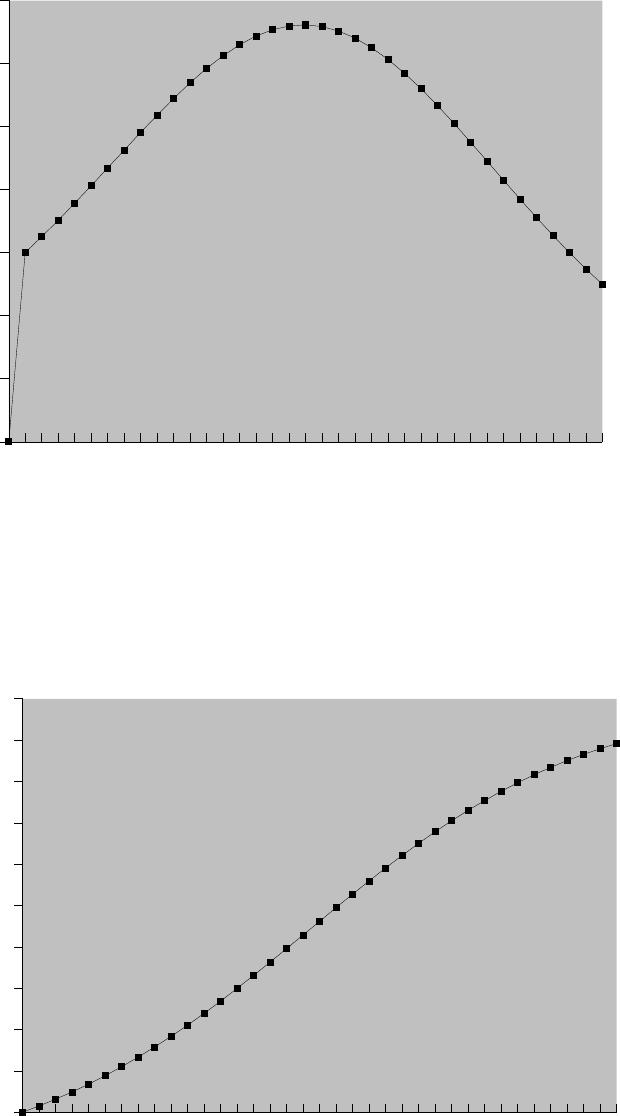
One possible solution is to revise market size down to 20 million units, innovation parameter
down to 0.015 and imitation rate parameter down to 0.1 (other solutions possible). If so, sales
and cumulative sales are greatly affected. Cumulative sales after 40 periods decline from
0 1 2 3 4 5 6 7 8 9 10 11 12 13 14 15 1617 18 192021222324252627 2829 303132 33 3435 36
0
200
400
600
800
1000
1200
Quarter
Sales in Thousands
(b)
Figure 1
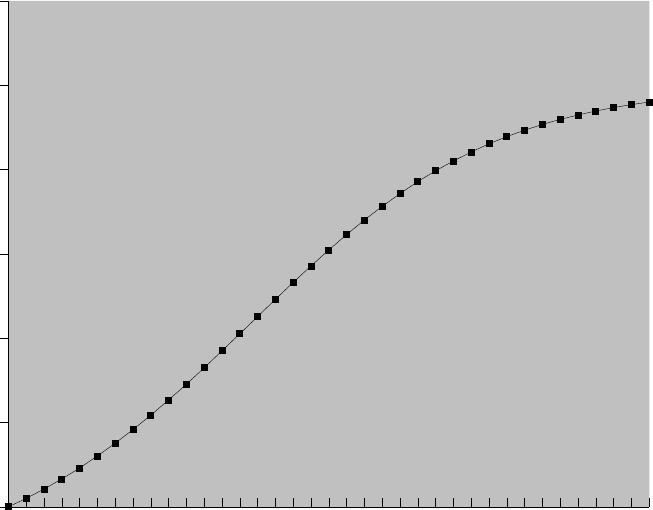
Figure 2
0 1 2 3 4 5 6 7 8 9 10 11 12 13 14 15 1617 18 19 202122232425 2627 2829 30 3132 33 3435 36
0
5000
10000
15000
20000
25000
30000
Quarter
Sales in Thousands
0 1 2 3 4 5 6 7 8 9 1011 12 131415 161718 192021 22232425 262728 293031 32333435 36
0
100
200
300
400
500
600
700
Quarter
Sales i n Thousands
Figure 3
Figure 4
0 1 2 3 4 5 6 7 8 9 1011 12131415 161718 19202122232425 262728 29303132333435 36
0
2000
4000
6000
8000
10000
12000
14000
16000
18000
20000
Quarter
Sales i n Thousands