The ASSESSOR Model
For Use with the ASSESSOR Excel Spreadsheet
ASSESSOR is a model that can be used in pretest market evaluation of a new product, and was
first described by Silk and Urban in 1978. The version of ASSESSOR appearing here is a
simplified one, including only one of the full ASSESSOR submodels. This submodel focuses on
projection of market shares for a new brand based on estimates of awareness, trial and repeat
purchases. Based on the marketing mix variables of advertising (awareness), distribution
(product availability), and sales promotion (received samples), the long-run market share is
projected (calculated as the product of penetration and repeat rates). Using variable and
fixed-cost inputs, the total profit contribution is calculated. Using “what-if” analysis, diagnostic
information about the effects of changes in the marketing mix on profit contribution can be
evaluated. ASSESSOR can therefore be used to evaluate the potential success of a new product
based on market pretests as well as compare alternative marketing plans. Potential new product
failures may be detected prior to a full test market or costly full-scale market launch.
INPUT
Advertising—This is the projected advertising budget for the product.
Distribution—This is the projected distribution level for the product.
Sales Promotion—This is the projected cost of distributing samples of the new product.
Exponents—Parameters regulating the shapes of the response functions relating the above three
marketing mix variables and resulting market share.
Long-run Trial Probability—This is the trial rate that would ultimately occur if all consumers
were aware of the advertising and the product were available. It is entered as a probability
between 0.00 and 1.00.
Probability of Trying a Received Sample—This is the proportion of those receiving a sample
that will make a first purchase of the new product. It is entered as a probability between 0.00
and 1.00.
Probability of Switching to the New Brand—This is the proportion of consumers who, when
in a purchase situation with both the new brand and established brands, will purchase the new
brand over the established brands. It is entered as a probability between 0.00 and 1.00.
Probability of Repurchasing the New Brand—Based on satisfaction ratings, this is the
proportion of consumers who have already bought the brand and would repurchase the new
brand over established brands. It is entered as a probability between 0.00 and 1.00.
Industry Sales Projection—The total potential market for the product.
Fixed Costs, Other—The fixed costs allocated to the new product (excluding the
previously-entered marketing mix variables: advertising, distribution, and sales promotion).
OUTPUT
Projected Long-run Market Share—Calculated based on the probabilities of trial, purchase,
and repurchase, this is the ultimately occurring market share that can be expected for the new
product. It is used to compute projected company sales and variable contribution margin from
the industry projection and per-unit contribution. The impact of “what-if” changes in the
marketing mix can be diagnosed against this variable.
Total Profit Contribution—This is the result of translating market share into dollars after
accounting for fixed costs.
ASSESSOR Exercise
Good Times Snack Company is a manufacturer of snack cakes. The company distributes only
over a three-state region in the Northeast but its cakes are extremely popular in that area,
regularly maintaining market shares almost as large as the big nationwide producers. Good
Times is planning to launch a new chocolate and cream snack cake, and is considering an
investment of about $1.8 million on advertising, distribution, and sales promotions (such as free
samples), allocated as follows: advertising, $800,000; distribution, $600,000; sales promotion,
$400,000. Your task is to determine whether an increase in any or all of these budgets would be
advisable in terms of increasing total company profit contribution.
Good Times management has provided you with estimates of certain parameters to be used in
running the ASSESSOR model. They believe the long-run trial probability of this product is
90%, and the probability that a customer who receives a free sample will actually purchase one is
80%. Based on studies of similar, previously-launched products, management believes the
probability a customer will switch to the new brand is 70% and the probability of a repeat
purchase is 60%. Key parameters used in developing the response function are as follow:
Advertising response: Reference budget $800,000; minimum share 5%; maximum share 90%;
exponent 1.3.
Distribution response: Reference budget $600,000; minimum share 0%; maximum share 90%;
exponent 0.8.
Sales promotion response: Reference budget $400,000; minimum share 0%; maximum share
80%; exponent 1.7.
Contribution per unit (selling price minus variable costs per unit) is $0.75. Industry sales
projection in the area is 25 million units per year. Direct fixed costs other than those for
advertising, distribution, and sales promotion total $2.5 million.
(a) What are the projected ultimate penetration (trial) and repeat rates? Interpret these figures.
What is the projected long-run market share? What are projected company sales and profit
contributions?
(b) Suppose contribution per unit were cut by a modest amount due to increases in ingredients
costs (you can try a few levels here). Would you say that total profit contribution is affected
a great deal by changes in unit contribution (that is, is total contribution very sensitive to
changes in unit contribution)?
(a) Return contribution per unit to the original level of $0.75. Vary the marketing expenditures,
one by one, to observe the effect on company sales and profit contribution. Can you
recommend a set of expenditures (advertising, distribution, and sales promotion) that yield a
$1,300,000 profit contribution and provide a long-run market share of at least 28%?
Answer:
(a) Projected ultimate penetration (trial) rate = 45%.
Projected ultimate repeat rate = 64%.
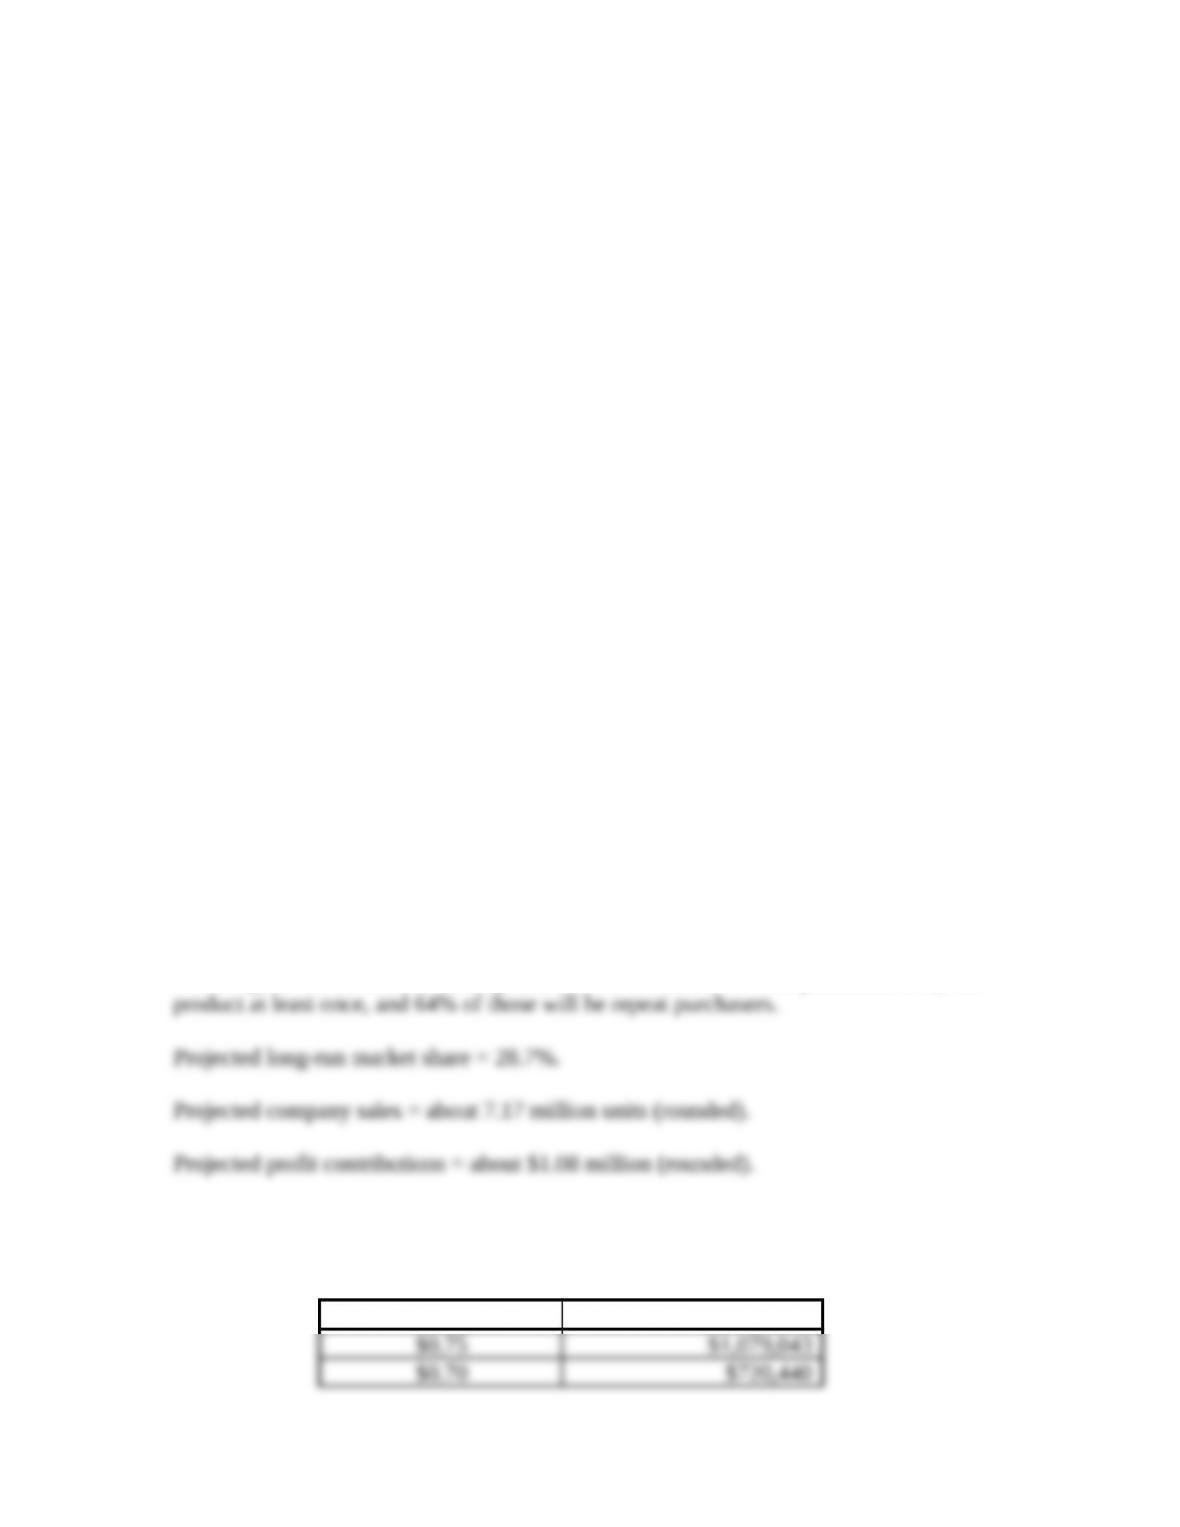
These figures mean that, in the long run, 45% of the market will be persuaded to try the
(b) Students will try different levels of contribution per unit. An acceptable solution is to
decrease unit contribution in 5 percent increments. Resulting total profit contributions are:
Contribution per Unit Profit Contribution
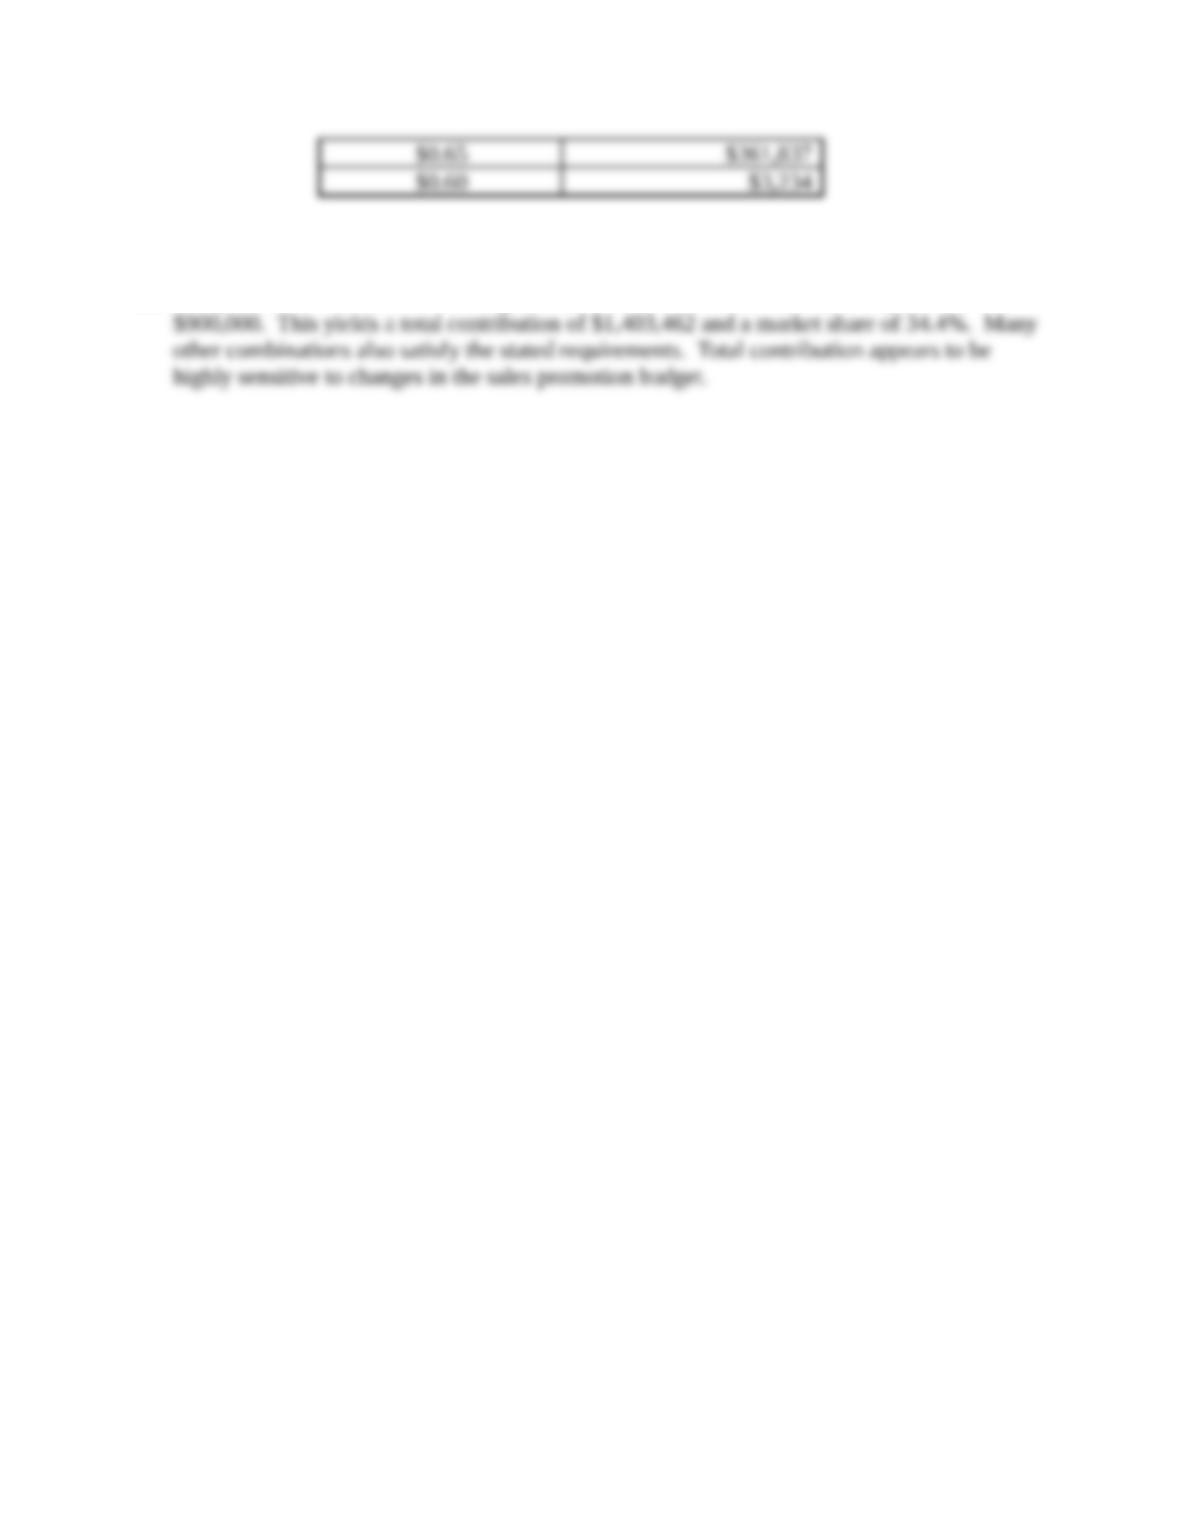
Total profit contribution appears to be very sensitive to small changes in unit contribution.
(c) One possible solution is: advertising, $900,000; distribution, $750,000; sales promotion,