The ADBUDG Model
For Use with the ADBUDG Excel Spreadsheet
The ADBUDG model can be used to project the market share and contribution effects of
advertising programs. It was first described in the business literature in 1970 by John Little. It
seeks to describe the response function, or relationship, between advertising and market share.
Rather than running on historical relationships (which may not be available or may not hold in
the future), ADBUDG is driven entirely by managerial judgment. An appealing feature of the
ADBUDG and similar models is that they help to bring managers and analysts closer together by
actively incorporating the expert judgment and insights the manager brings to the decision
analysis.
ADBUDG and related models require the manager to provide answers to several questions
pertaining to the response of market share to changes in advertising expenditure. These
estimates are then used to develop the response function, which is usually specified in an
S-shaped form to account for threshold and saturation effects of advertising.
INPUT
Current Market Share—This must be entered for the brand or product in question.
Maintenance Advertising Budget—The manager must estimate how much must be spend on
advertising to maintain the current market share given above. This may be more or less than the
current advertising budget, according to prevailing market conditions. For example, a major
competitive advertising attack may be anticipated and it may be felt that increasing expenditure
will be necessary just to maintain current share.
Minimum Market Share—This is the market share the manager believes will result if
advertising expenditure is cut to zero. Of course this market share is not necessarily zero itself.
Maximum Market Share—This is the market share the manager believes would result if
advertising expenditure is raised to the highest feasible amount. The manager may believe, for
example, that it is impossible to get more than 30% of a given market, since entrenched
competitors are too strong and their customers are too loyal.
Plus-20 Market Share—This is an estimate of the market share that would occur should an
advertising budget 20% higher than the maintenance budget be set. This estimate helps give the
ADBUDG curve its shape (S-shaped or concave).

Seasonal Indices—The manager must give seasonal indices for product class sales, brand sales,
maintenance advertising budgets, and media efficiency if appropriate. For example, a
family-oriented tourist attraction projecting ticket sales would certainly have seasonal
fluctuations in attendance—this would be reflected in Brand Sales seasonal indices.
Furthermore, the whole tourist industry might have seasonalities that have to be considered—
these would be reflected in seasonalities in Product Class Sales.
Advertising Budgets—The manager can insert different levels of advertising expenditures for
each season and observe effects on shares, sales, and contributions.
Quarterly Industry Sales—Sales of all competitors in this product class.
Contribution Margin Per Unit—Selling price minus variable costs per unit.
Other Fixed Costs—These include all direct fixed costs other than advertising (production,
distribution, and so on).
OUTPUT
Projected Share—The market share projected for the brand if the given advertising expenditure
is chosen. This is obtained from the relationship between advertising and market share implied
by the ADBUDG inputs.
Projected Sales—Given industry sales, the projected market share is converted to a sales figure.
Contribution to Profit—Given variable and fixed costs and projected sales levels, profit
contributions can be calculated.
ADBUDG Exercise
We-Kleen-It (WKI) is a medium-sized, regional dry-cleaning chain, with several branches in city
and suburban shopping centers. The management is wondering whether changes ought to be
made to WKI’s advertising expenditure policy.
Dry cleaning is a somewhat cyclical business, with demand usually a little lower in summer and
fall, and higher in winter and spring. The average (baseline) volume of business in this market is
1,500,000 orders per quarter, subject to seasonal fluctuation. Management estimates that
seasonal demand indices of 1.1, 0.8, 0.9 and 1.2 for spring, summer, fall, and winter respectively
describe the pattern of demand for dry cleaning reasonably well. WKI’s sales follow very much
the same pattern. Consequently, the amount needed to be spent on advertising varies seasonally,
as shown in the table below. The table also lists management’s assessments of the efficiency of
media advertising across the four seasons.
Spring Summer Fall Winter
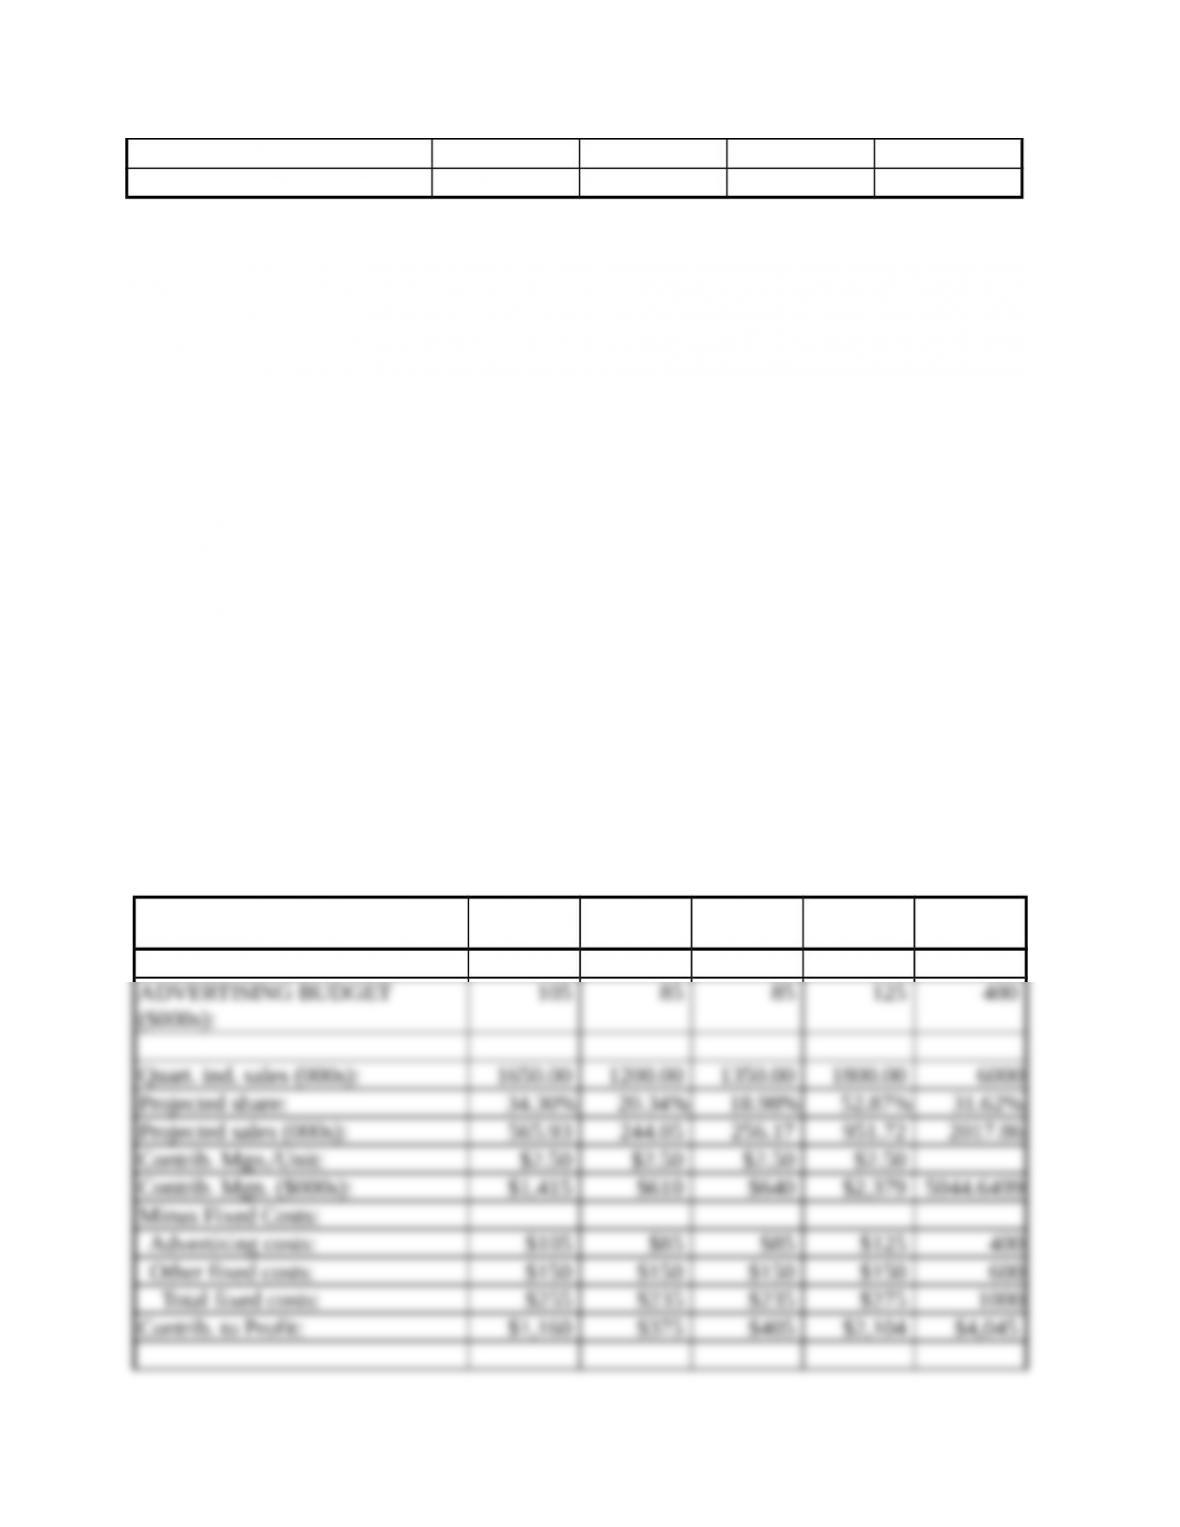
Maintenance Adv. Budget 1.05 0.8 1 1.07
Media Efficiency 1.12 0.8 1 1.15
Currently, about $100,000 is spent on advertising per quarter (a total of $400,000 per year). It is
believed that this level is required to maintain current WKI market share, which is hovering at
about 27-28% of the market. Management’s anticipated allocations of advertising expenditures
for the coming year are $105,000, $85,000, $85,000 and $125,000 (spring, summer, fall, winter
respectively), for a total of $400,000. Management believes that, regardless of advertising,
WKI’s market share will never drop below 18%; and if advertising is increased too much, an
advertising war might ensue, cutting every competitor’s profits and stalling WKI’s market share
at 50%. The estimated market share for WKI should the advertising budget be set at
maintenance level plus 20 percent is 40%.
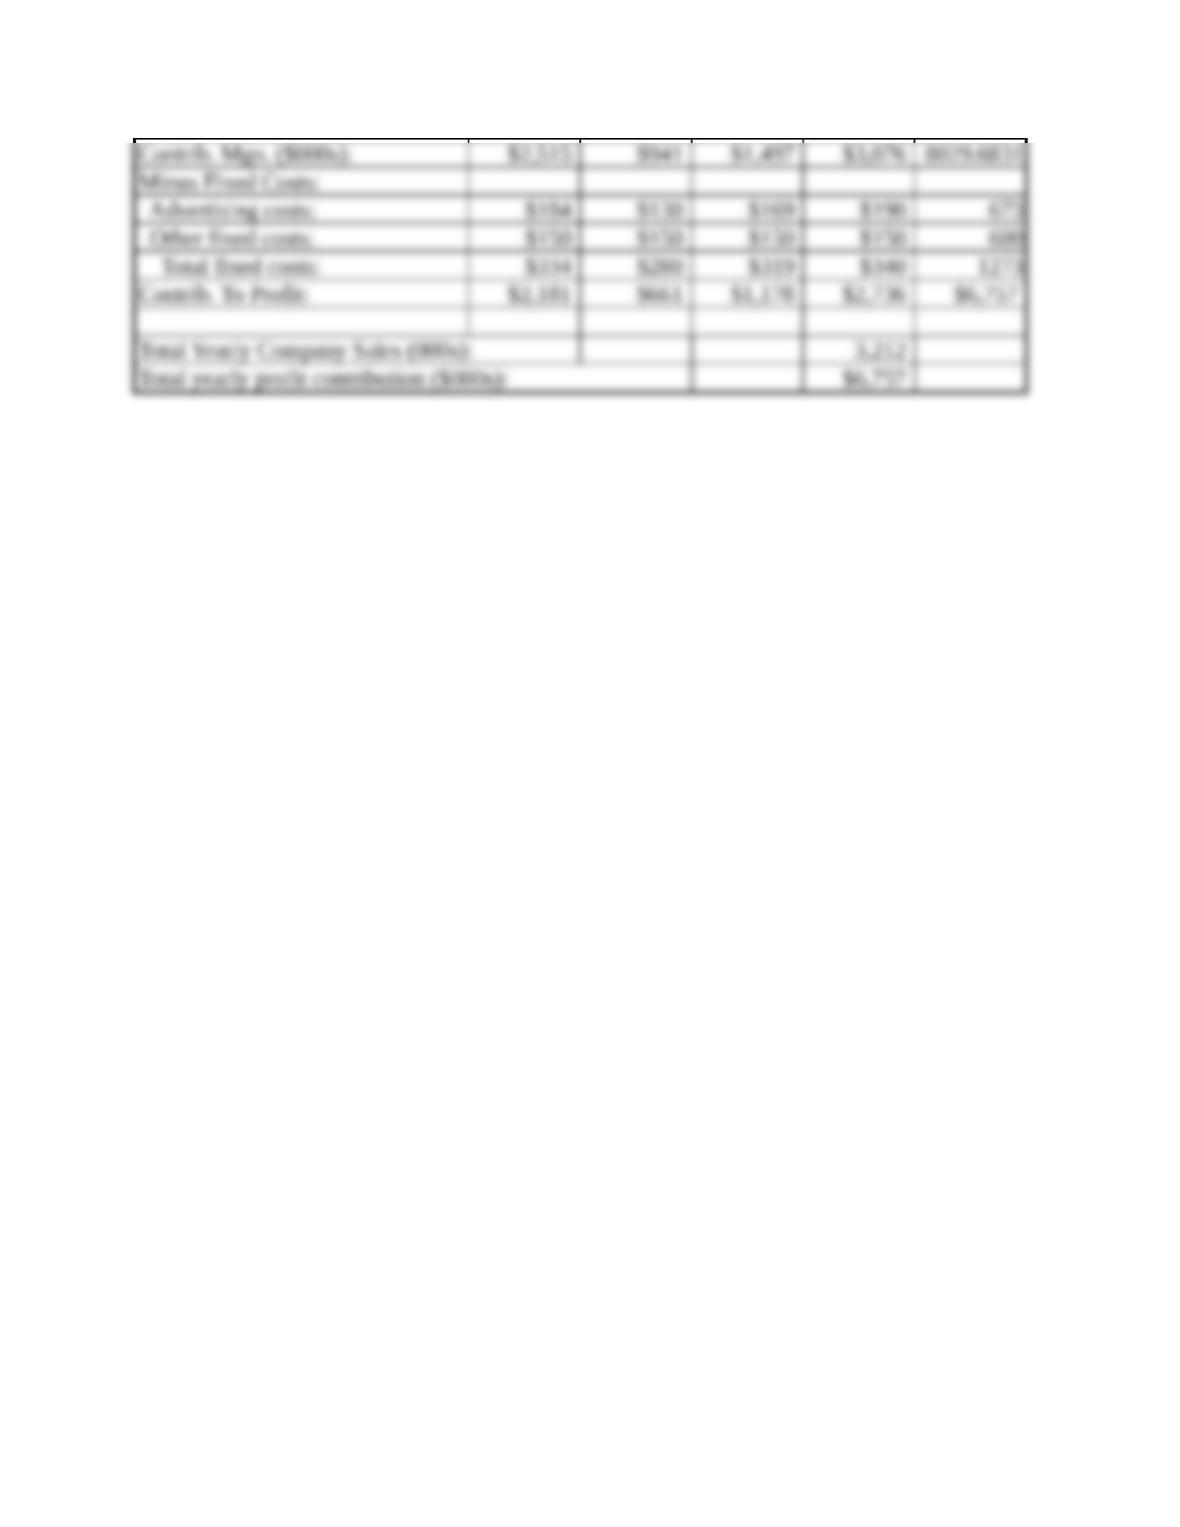
Quarterly industry sales (number of invoices per quarterly period), WKI’s average contribution
per unit (per invoice), and quarterly fixed costs incurred by WKI are all provided on the
accompanying spreadsheet.
(a) Given the currently budgeted advertising expenditures for the coming year, what are WKI’s
projected market shares and sales levels per quarter? What are total yearly company sales
and profit contribution expected to be?
(b) Assuming other costs and data remain the same, adjust the quarterly advertising budgets.
Can you make total yearly contribution increase by altering the advertising levels? Would
you recommend a higher overall advertising budget for WKI? Justify your recommendation
in terms of increased total yearly contribution.
Answer:
(a)
PROFIT ANALYSIS SPRING
SUMMER
FALL WINTER TOTALS
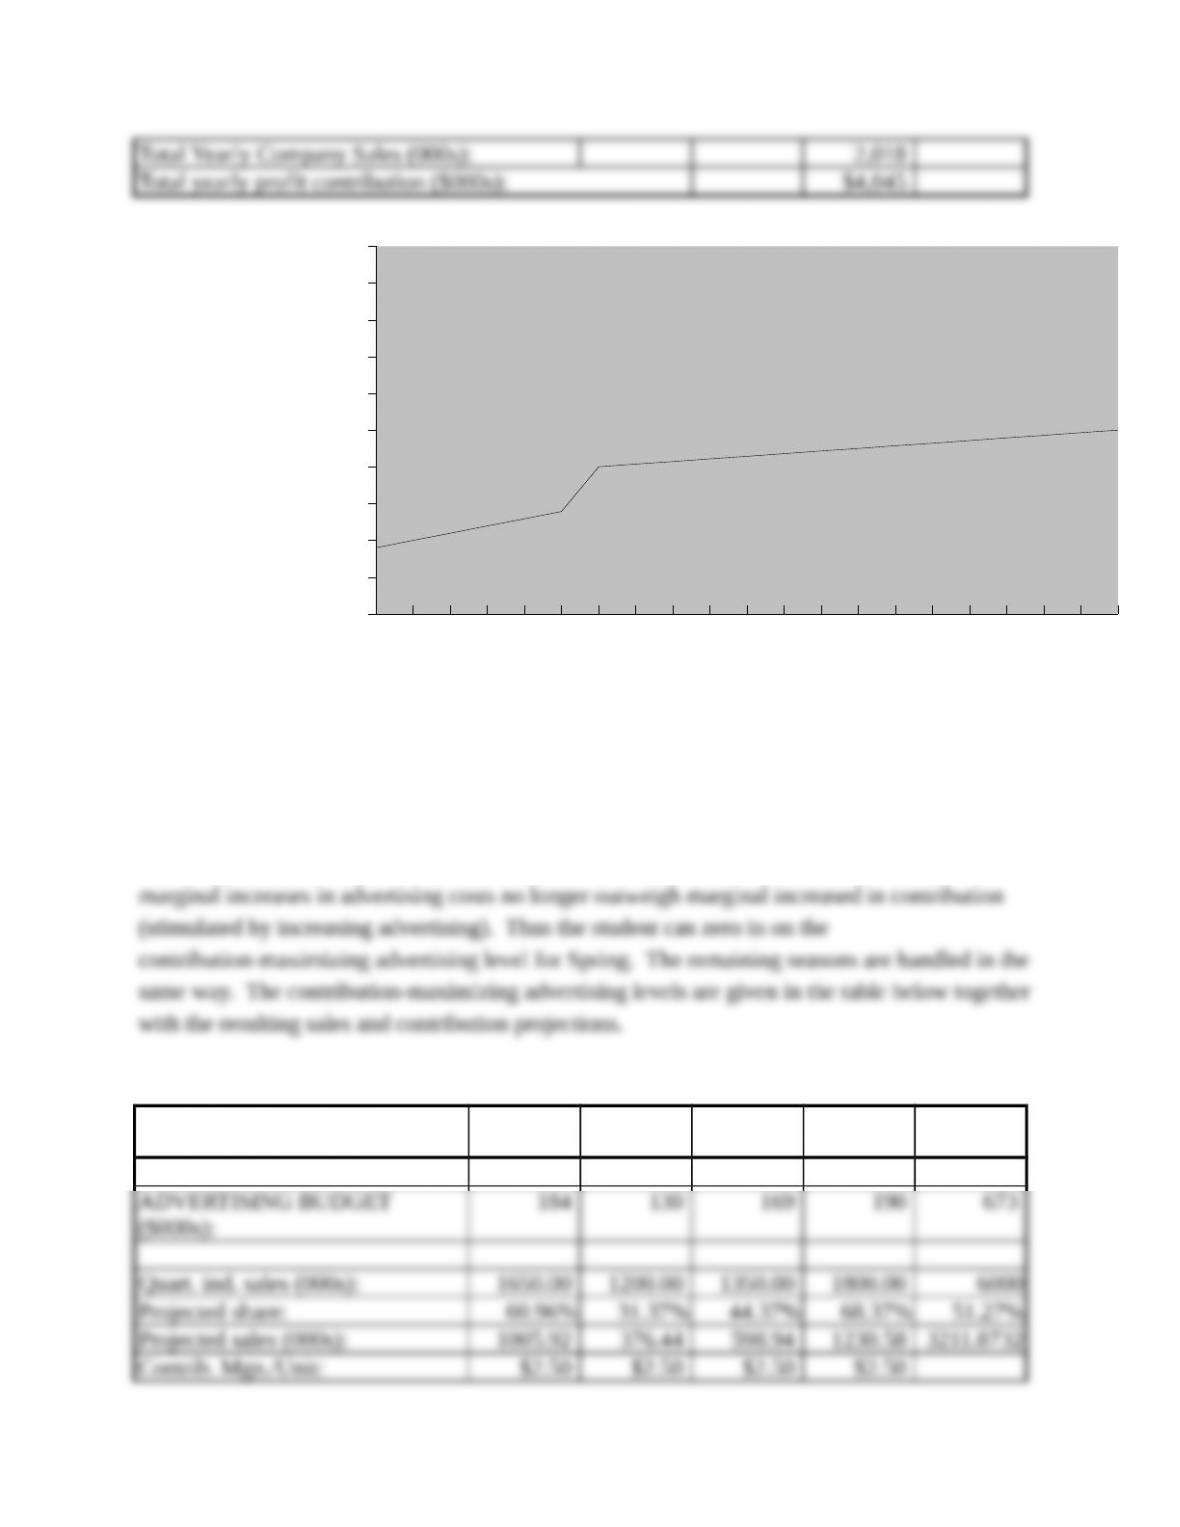
0 100 120 200 300
0.00%
10.00%
20.00%
30.00%
40.00%
50.00%
60.00%
70.00%
80.00%
90.00%
100.00%
ADV. BUDGET
MARKET SHARE
The figure below shows an approximation of the response function:
(b) The hint to solving this part of the problem is that each season operates independently of
each other. The student can begin with Spring, increasing advertising a little at a time and
observing the changes in total contribution, which will continue to increase up to the point where
PROFIT ANALYSIS SPRING
SUMMER
FALL WINTER TOTALS