Nortel Discussion Questions
1. Using the information you have on market size, innovation rate, and imitation rate,
develop a ten-year forecast of unit demand for the U.S. switch market using the BASS
spreadsheet. Test how sensitive your forecasts are to slight changes in the parameters.
(Use initial and final prices of $600,000 per switch.) Should you be concerned about the
sensitivity of your forecasts in the event that your parameter estimates are inaccurate?
How is diffusion affected if the final price is reduced by a reasonable amount? (Change
final price only in spreadsheet.) Interpret your findings.
Answer:
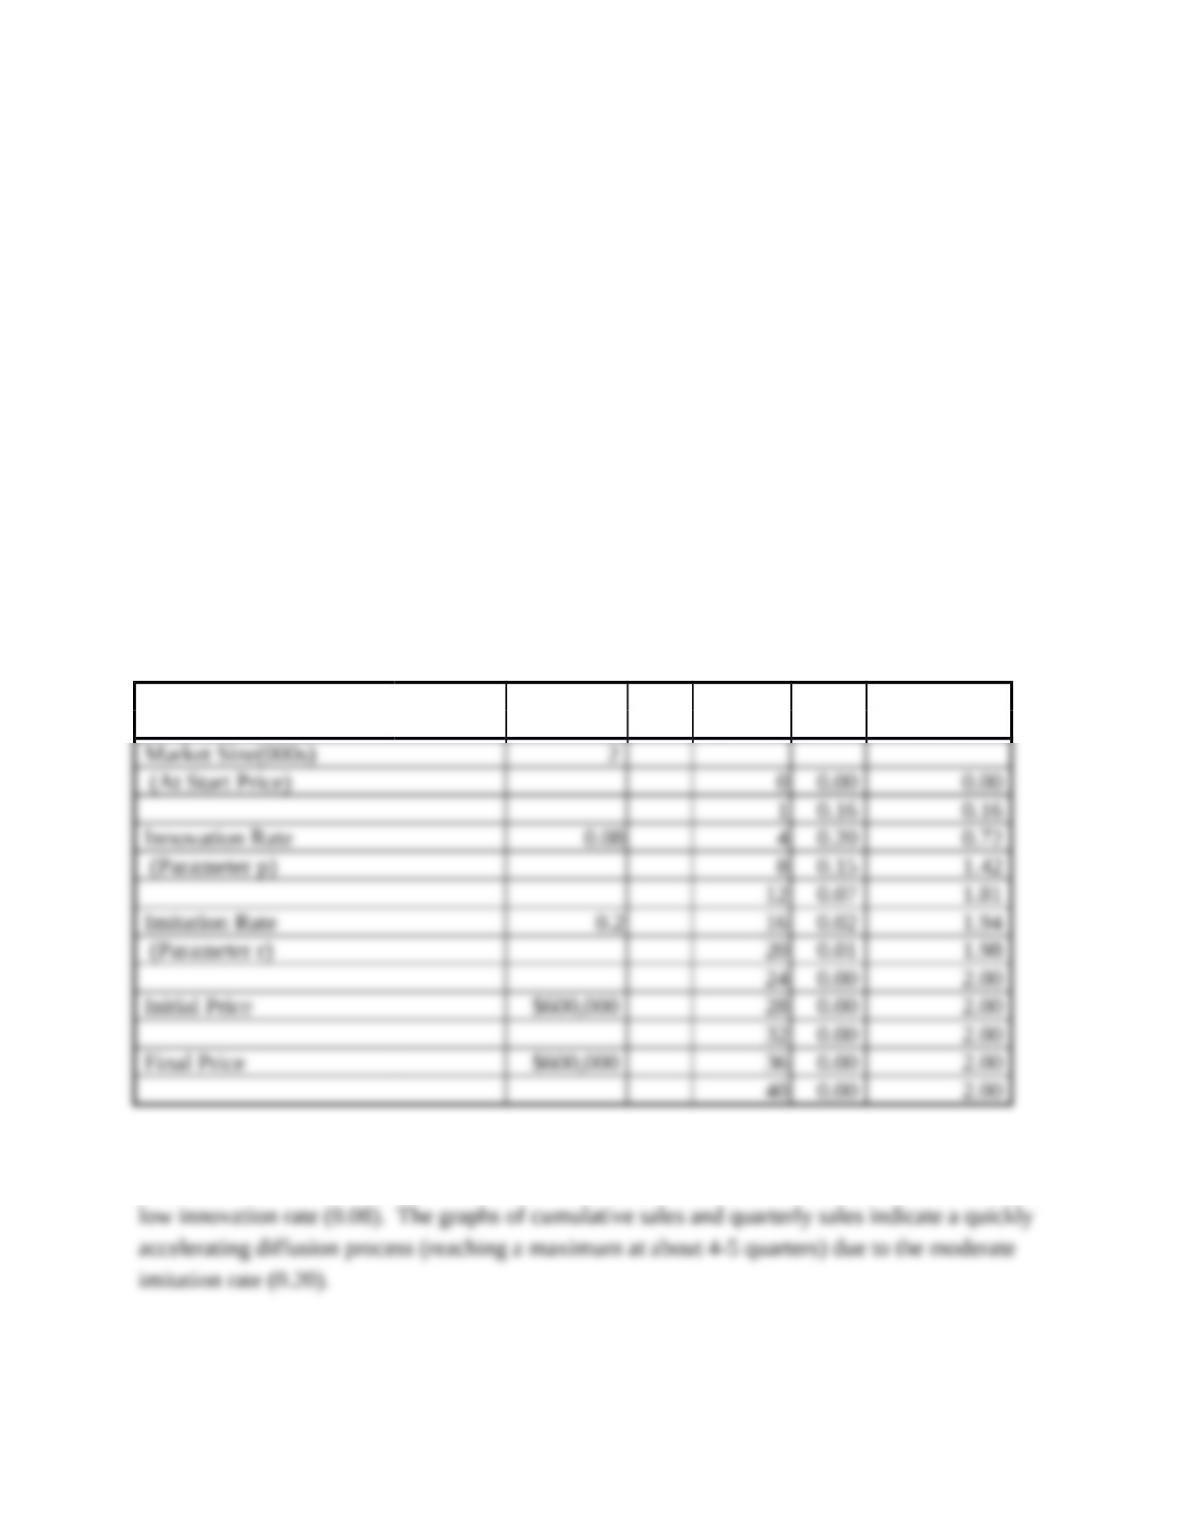
This question requires the application of the BASS model. Information provided in the case
regarding the market size, innovation rate, imitation rate, initial price, and final price is required
for input into the spreadsheet in order to obtain quarterly forecasts of unit demand for the U.S
switch market.
Bass Model Cumulative
Quarter Sales Sales
The quarterly sales forecast indicates market saturation after 24 quarters (6 years). This reflects
the rather slow initial adoption of the new switch into the market as would be expected due to the
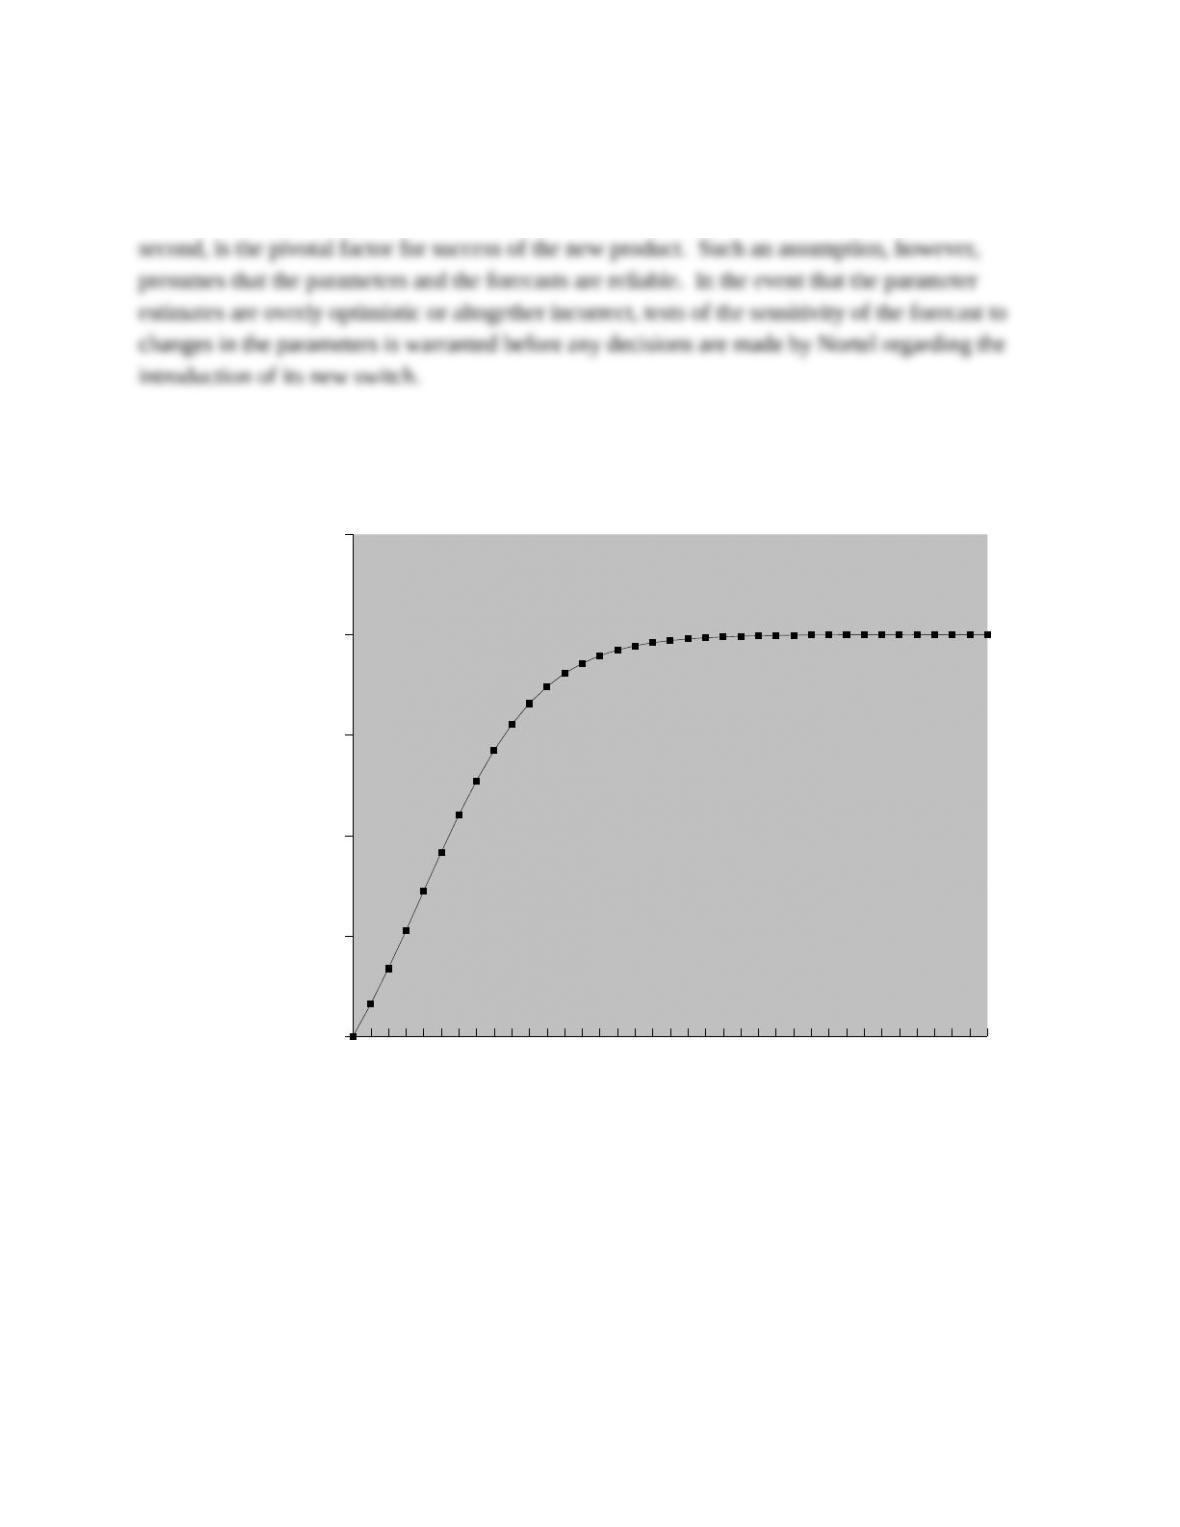
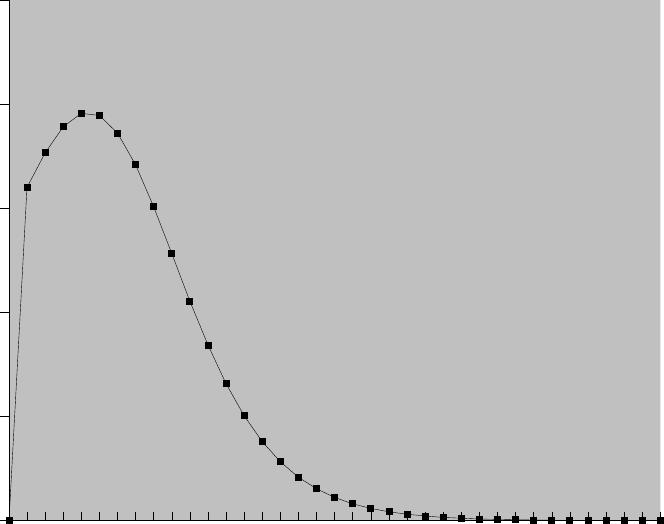
Given the original parameters, speed to market is a factor to consider in the product introduction
strategy in the switch market since sales peak early – quarter 4 (see figures below). In other
words, this scenario could be indicative of a situation in which being “first to market,” or a close
0 1 2 3 4 5 6 7 8 9 10 11 12 13 1415 1617 18 19202122 23242526272829 30 3132 33 34 35 36
0
0.5
1
1.5
2
2.5
Quarter
Sales in Thousands
0 1 2 3 4 5 6 7 8 9 10 11 12 13 1415 1617 18 19202122232425 26272829 30 3132 33 34 35 36
0
0.05
0.1
0.15
0.2
0.25
Quarter
Sales in Thousands
0 1 2 3 4 5 6 7 8 9 1011 121314 15 161718 1920212223 2425 262728 2930313233 3435 36
0
0.02
0.04
0.06
0.08
0.1
0.12
Quarter
Sales in Thousands
0 1 2 3 4 5 6 7 8 9 1011 12131415 161718 192021 22232425 262728 29 3031 32333435 36
0
0.5
1
1.5
2
2.5
Quarter
Sales in Thousands
Students
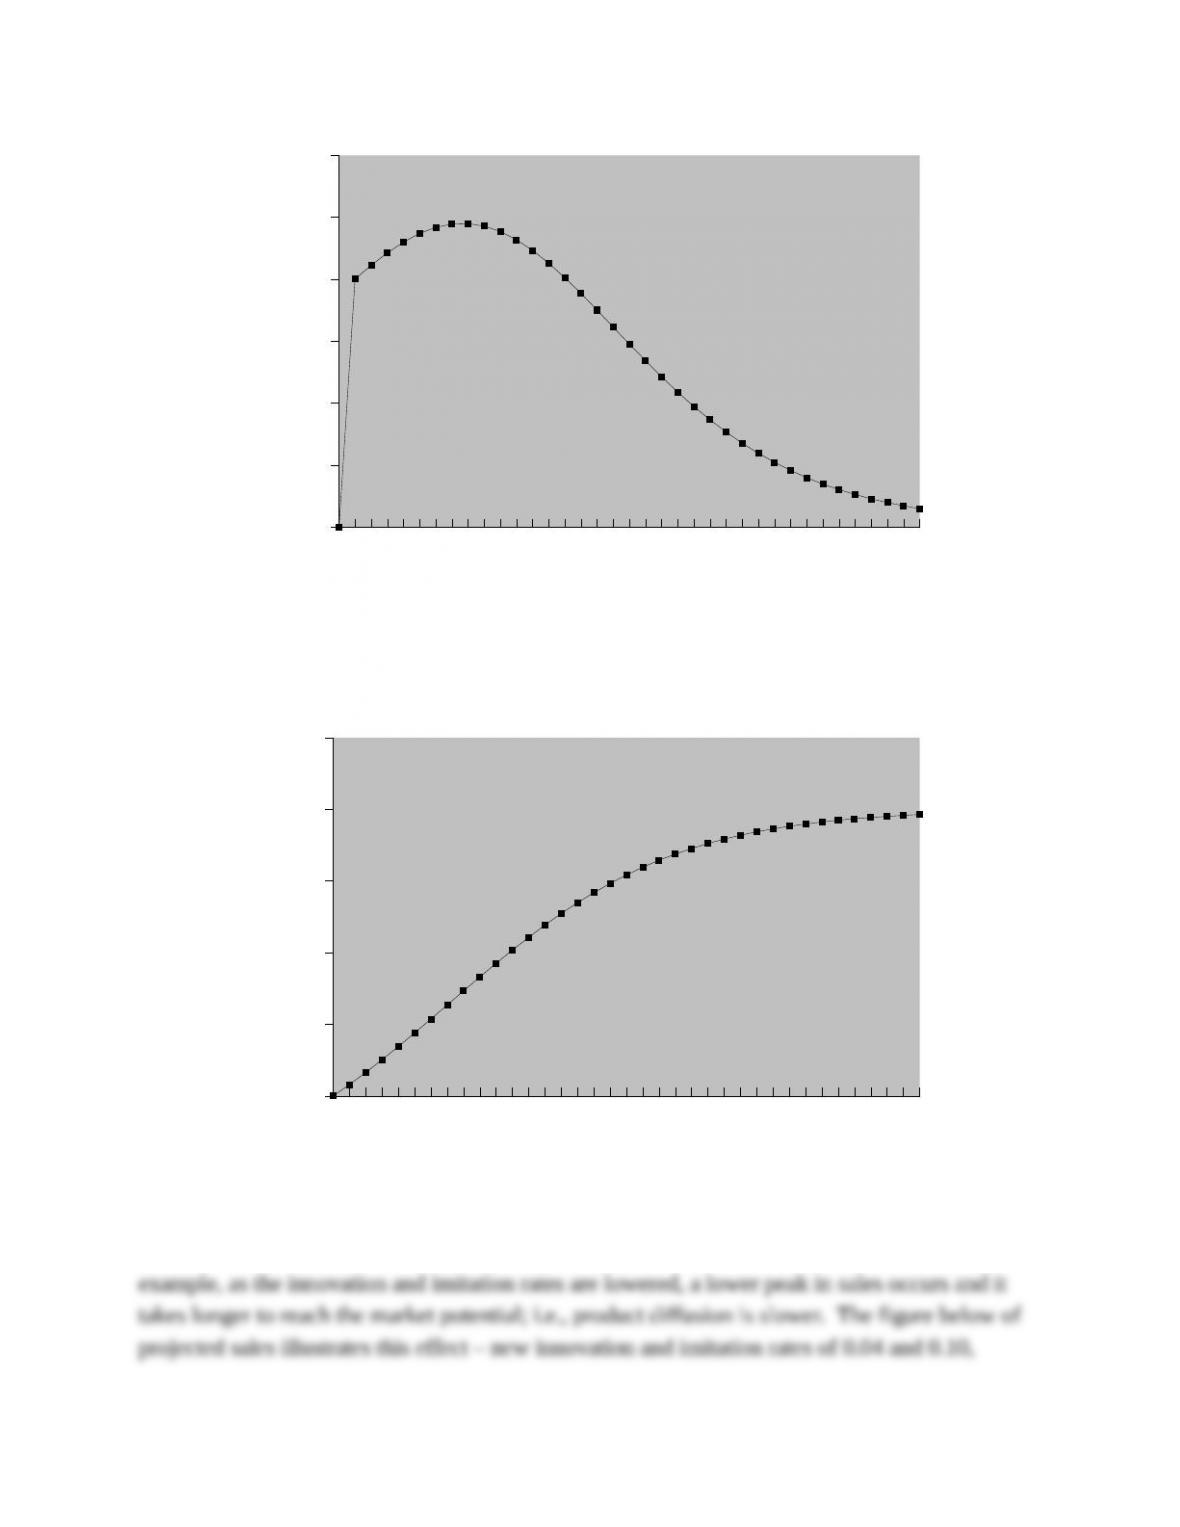
should examine the sensitivity of the forecast to changes in the market size (increases/decreases),
the innovation rate (increases/decreases), and the imitation rate (increases/decreases). For
respectively, were used to generate this sales forecast (all other parameters were unchanged).
Finally, sensitivity analysis must be performed on the final price of the switch (assume original
values for all other parameters). If the final price is reduced to, say, $75,000, them demand for
the switch increases. The BASS cumulative sales projection below indicates the effect of a
reduction in final price on sales. There is greater penetration of the market with a lower final
price. The projected sales curve indicates that there is greater diffusion of the product when the
2. Use the positioning information provided as input to the PERCEPTOR model. What
are the relative positions of Nortel and its major competitors on the two most important
attributes (speed and flexibility)? Based on the research indicating ideal brands for the
two customer segments, which are Nortel’s most serious competitors (in each segment
and overall)? According to the model, what is the expected overall, long-run market
share for Nortel’s product in this market? (Use the original attribute positions from the
case itself.) Note: Use 0.5, 0.5, and 0 as the relative sizes of the segments and ignore
on-screen information concerning “share in Segment 3.” Market shares for Segment 1,
Segment 2, and Total are correct as given on screen.
Answer:
Using the attribute coordinates provided for each brand in the case, the PERCEPTOR input
should be as follows:
SITUATION ANALYSIS — FOUR COMPETITORS IN INDUSTRY
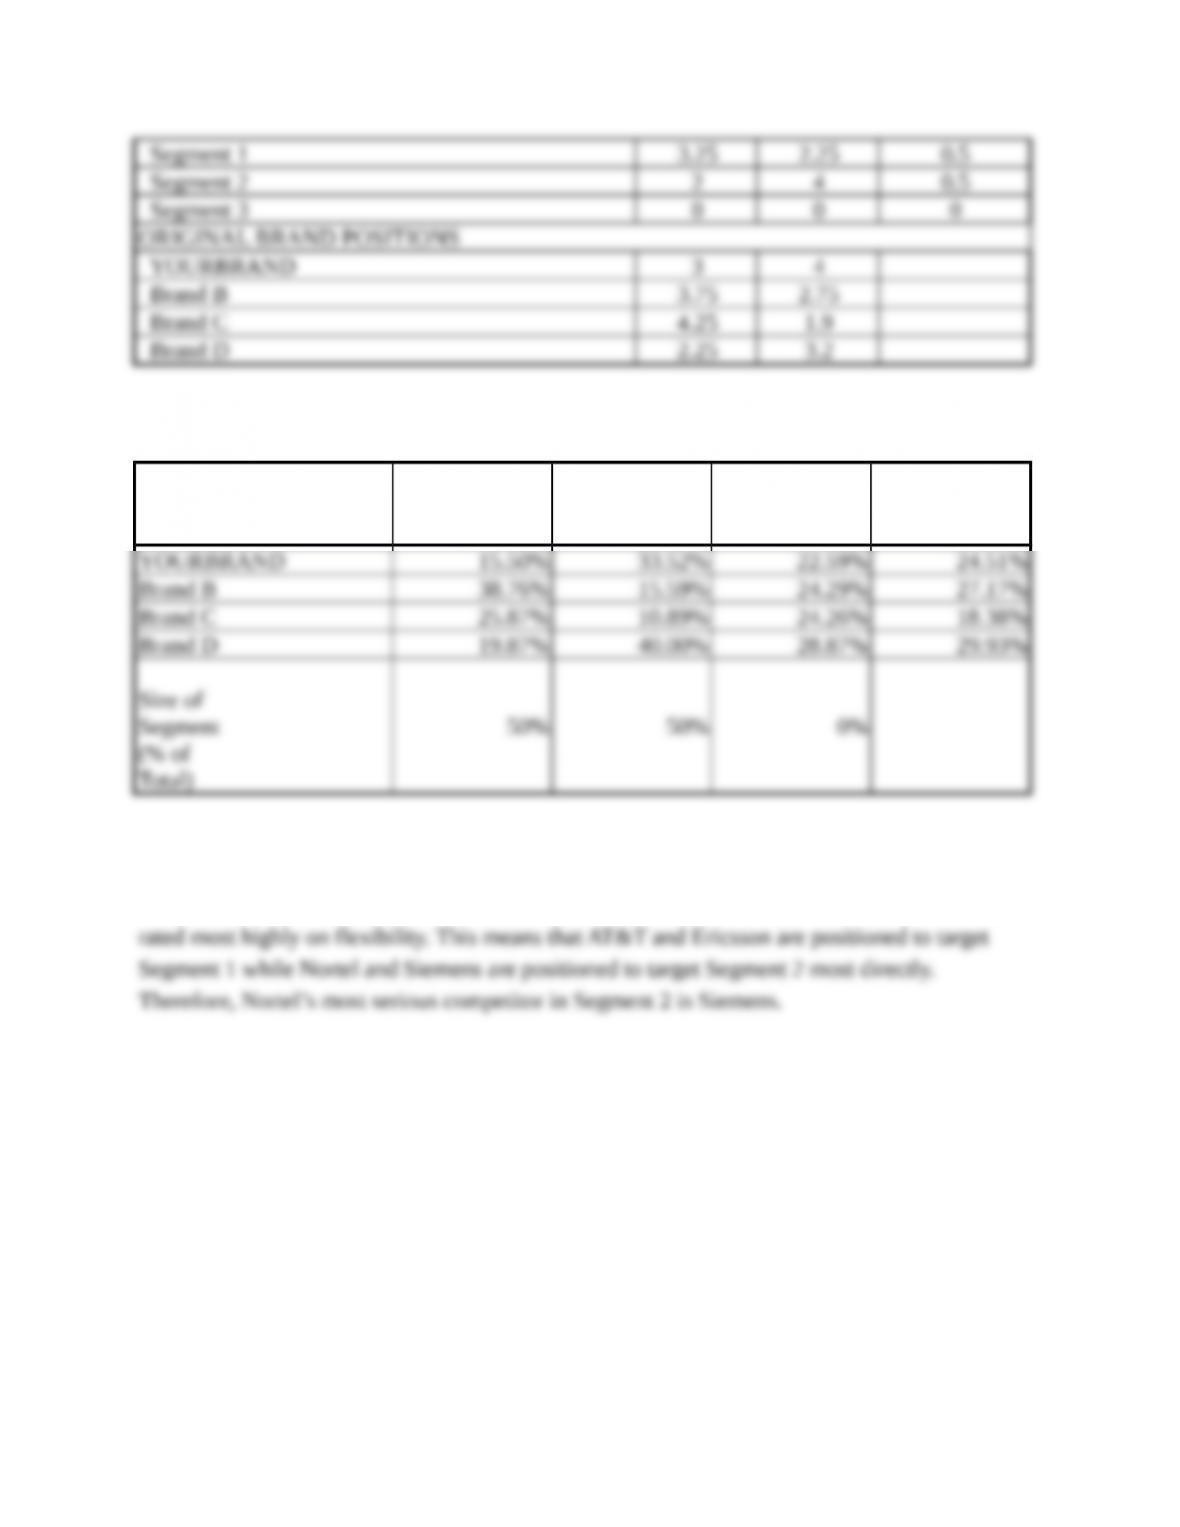
The input gives the following current market share analysis:
BRAND SHARE IN SHARE IN SHARE IN TOTAL
SEG. 1 SEG. 2 SEG. 3 MARKET
SHARE
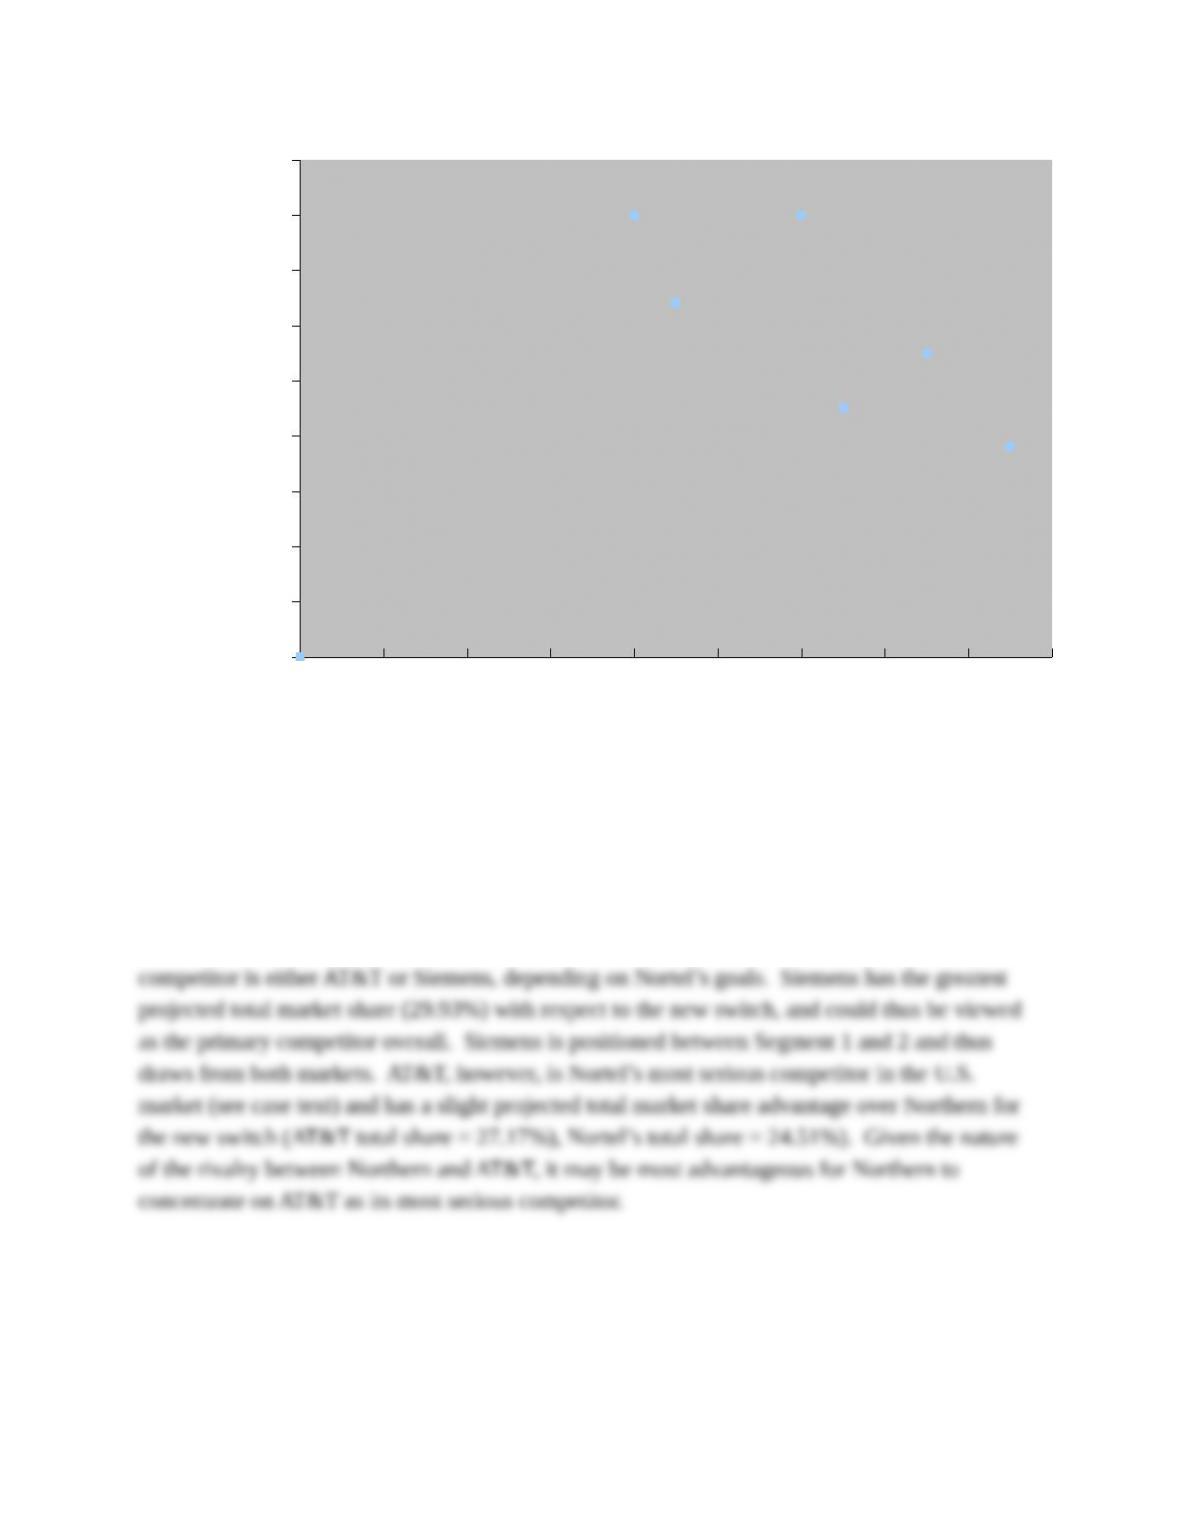
The perceptual map (shown below) enables us to assess brand positions relative to the market
segment ideal points. The figure indicates that AT&T (Brand B) and Ericsson (Brand C) are
rated most highly on speed while the Siemens (Brand D) and Nortel (Your Brand) products are
0 0.5 1 1.5 2 2.5 3 3.5 4 4.5
0
0.5
1
1.5
2
2.5
3
3.5
4
4.5
Attribute 1
Attribute 2
In Segment 1, Nortel is not really a major player – it has only 15.5% market share (see Current
Market Share Analysis screen). The most serious competitor in Segment 1 is AT&T with 38.76%
market share. Furthermore, Nortel’s product is perceived to be most similar to AT&T’s product
by Segment 1 (as determined by looking at the perceptual map and estimating the relative
proximity between Nortel and AT&T versus Nortel and Ericsson). Overall, Nortel’s most serious
Using the original positions provided in the case, PERCEPTOR indicates that Nortel’s expected
overall long-run market share is 24.51%. Currently, however, Nortel is perceived as
emphasizing more speed than is required by Segment 2, thus positioning itself away from
Segment 2’s ideal point. The net result of this less-than-ideal positioning is that Nortel is
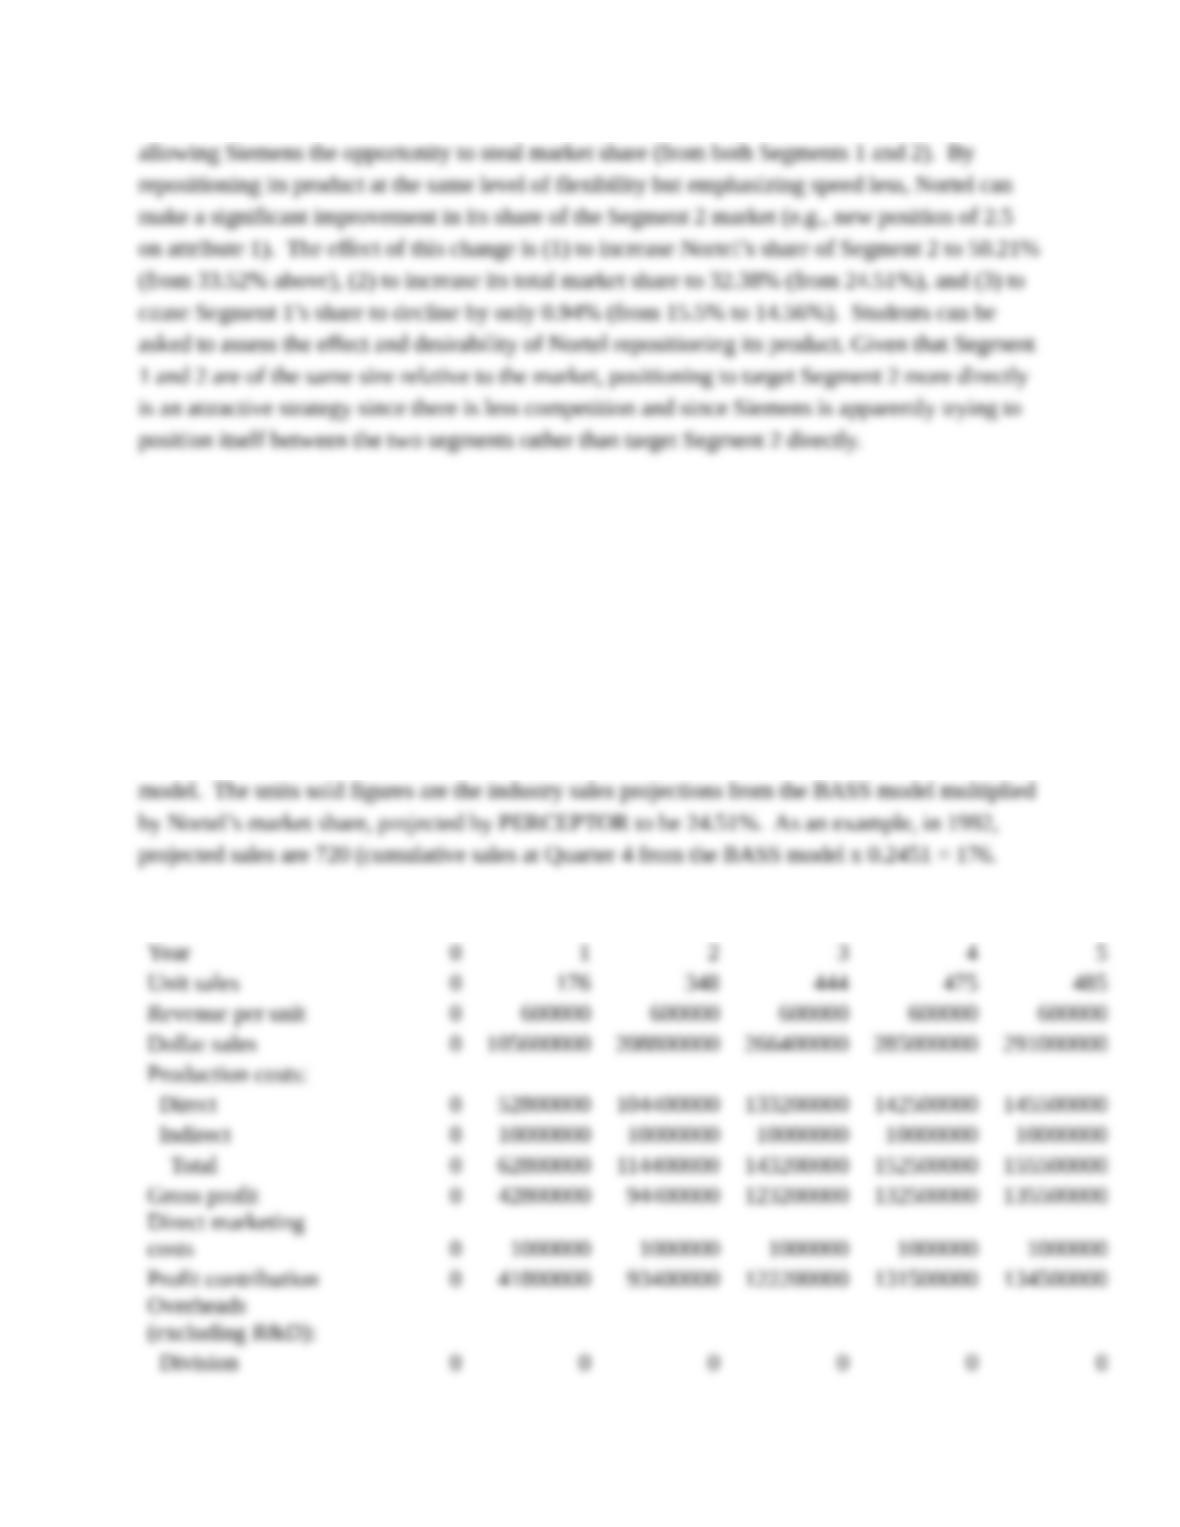
3. Using the industry sales forecasts for the next five years as obtained via the BASS
model, the market share estimates from the PERCEPTOR model, and the additional
financial information provided in the case, obtain a financial analysis for Nortel’s
switch product with the FINANCIAL model. How profitable a product will this switch
be if launched?
Answer:
The information provided in the Profit Analysis section serves as input to the FINANCIAL
FINANCIAL WORKSHEET
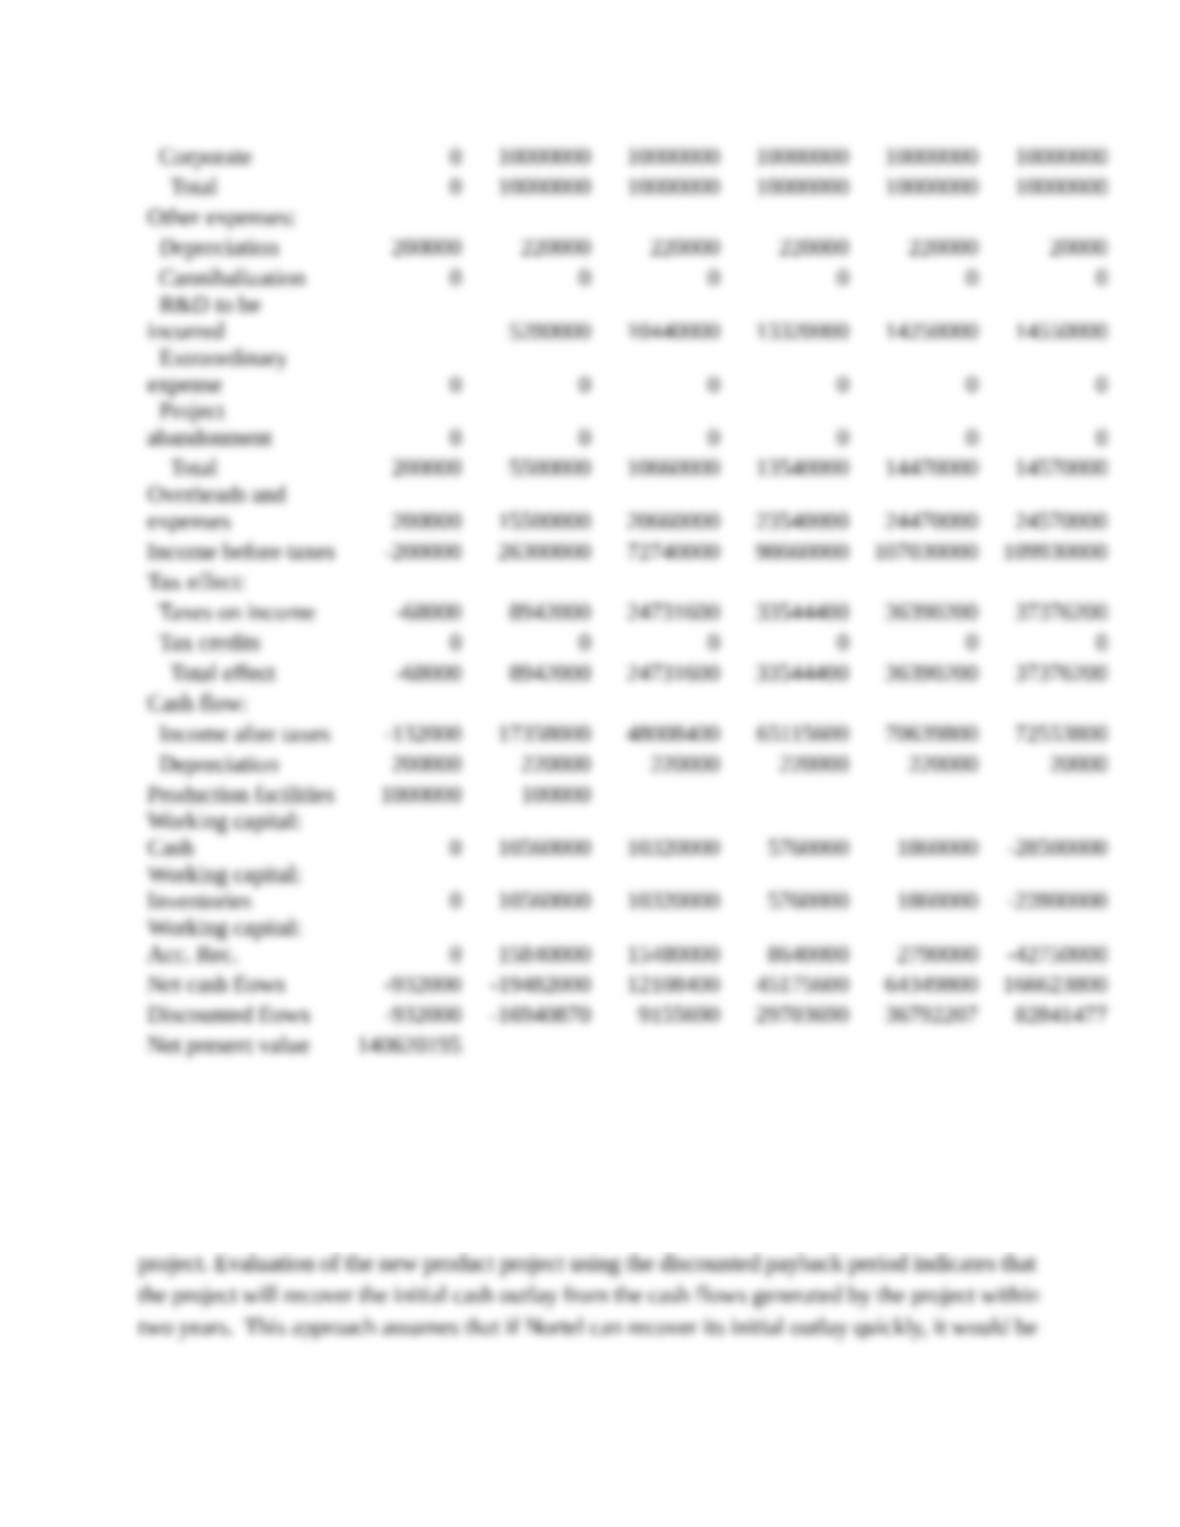
In spite of some initial negative discounted cash flows, the net present value of this project is still
positive due to high future returns.
The decision rule for net present value analysis is simple: if NPV > 0, accept the project. Thus,
on the basis of NPV analysis of the discounted project cash flows, Nortel would undertake the
4. Using the DEFENDER model for support, determine the effect of the competitive attack
by Nortel on Ericsson’s market share in Mexico. Is Ericsson’s planned repositioning
effective at keeping Nortel out of this market, or at least reducing its importance as a
major competitor? What changes (if any) would you recommend in Nortel’s perceived
position if Ericsson follows through on the implied threat? How might Nortel
accomplish this repositioning?
Answer:
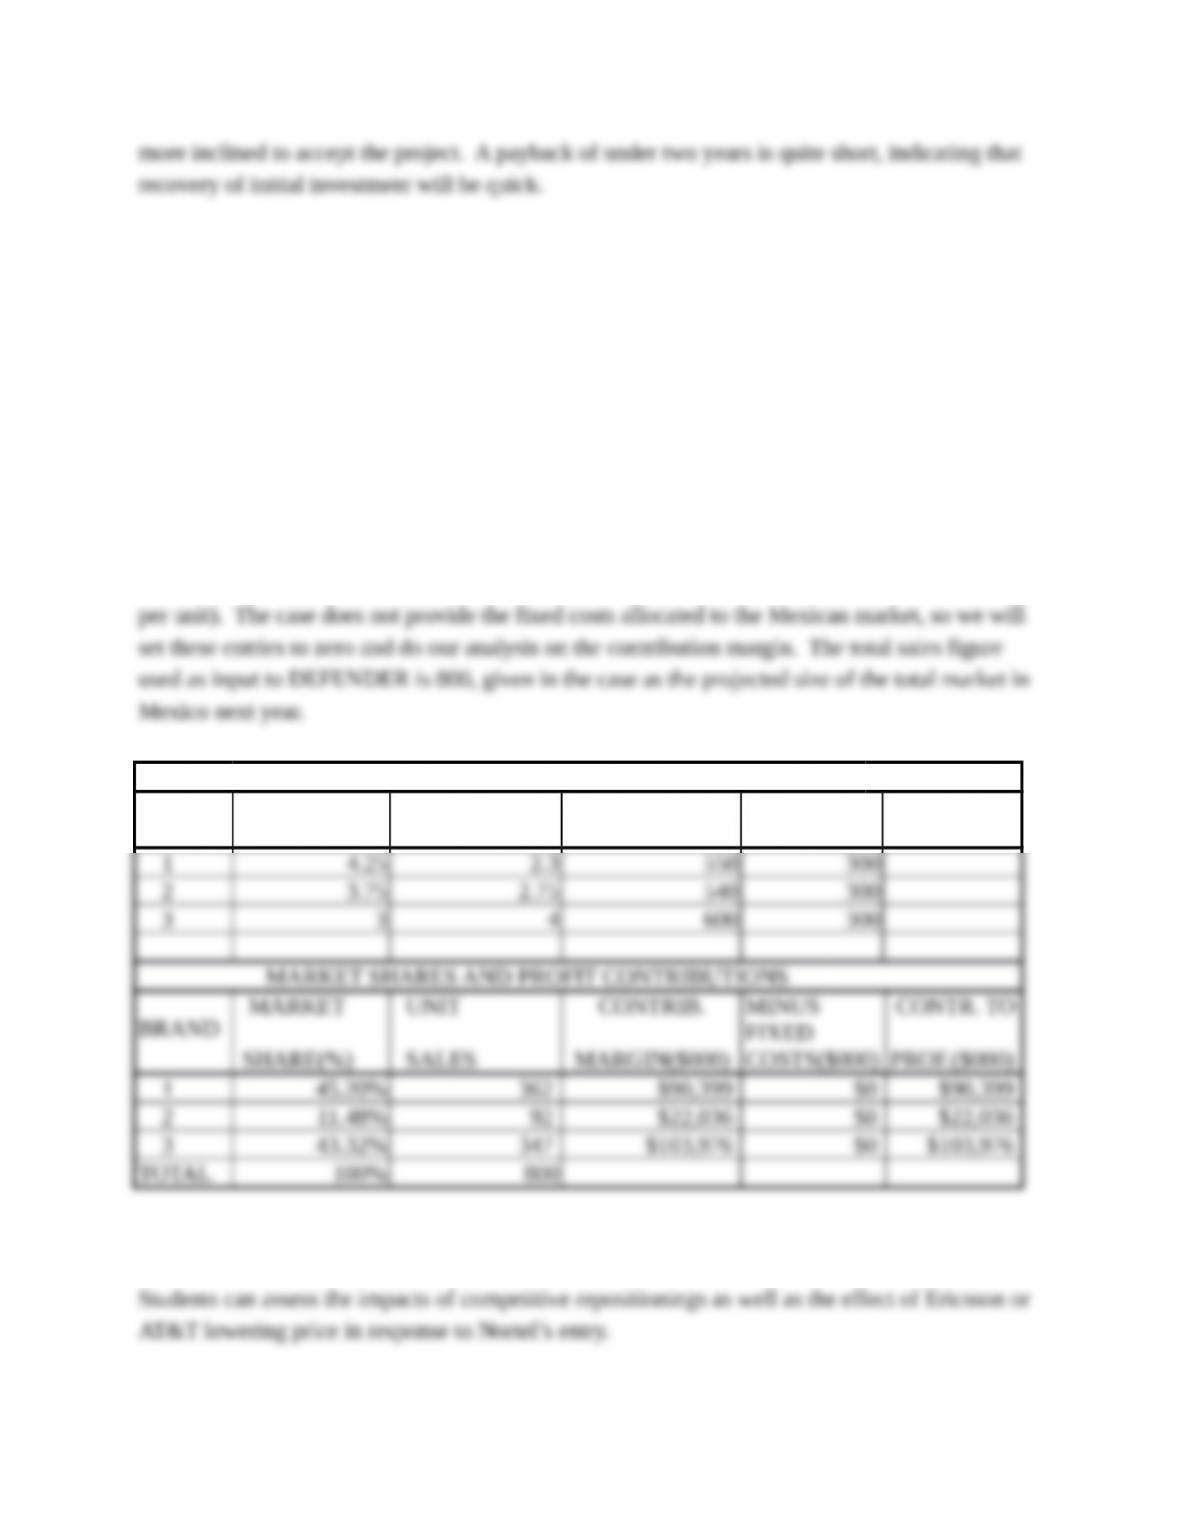
With the positions and prices as given (Nortel’s price is still $600,000), industry market shares
are predicted as follows: Ericsson, 45.20%, AT&T, 11.48%, and Nortel, 43.32%. Note that as
initial input, all three competitors are assumed to face the same variable cost structure ($300,000
ATTRIBUTE RATINGS AND PRICES
BRAND
ATTRIB. 1 ATTRIB. 2 PRICE ($000) VAR. COST
($000)
The per-dollar map obtained is depicted on the next page.
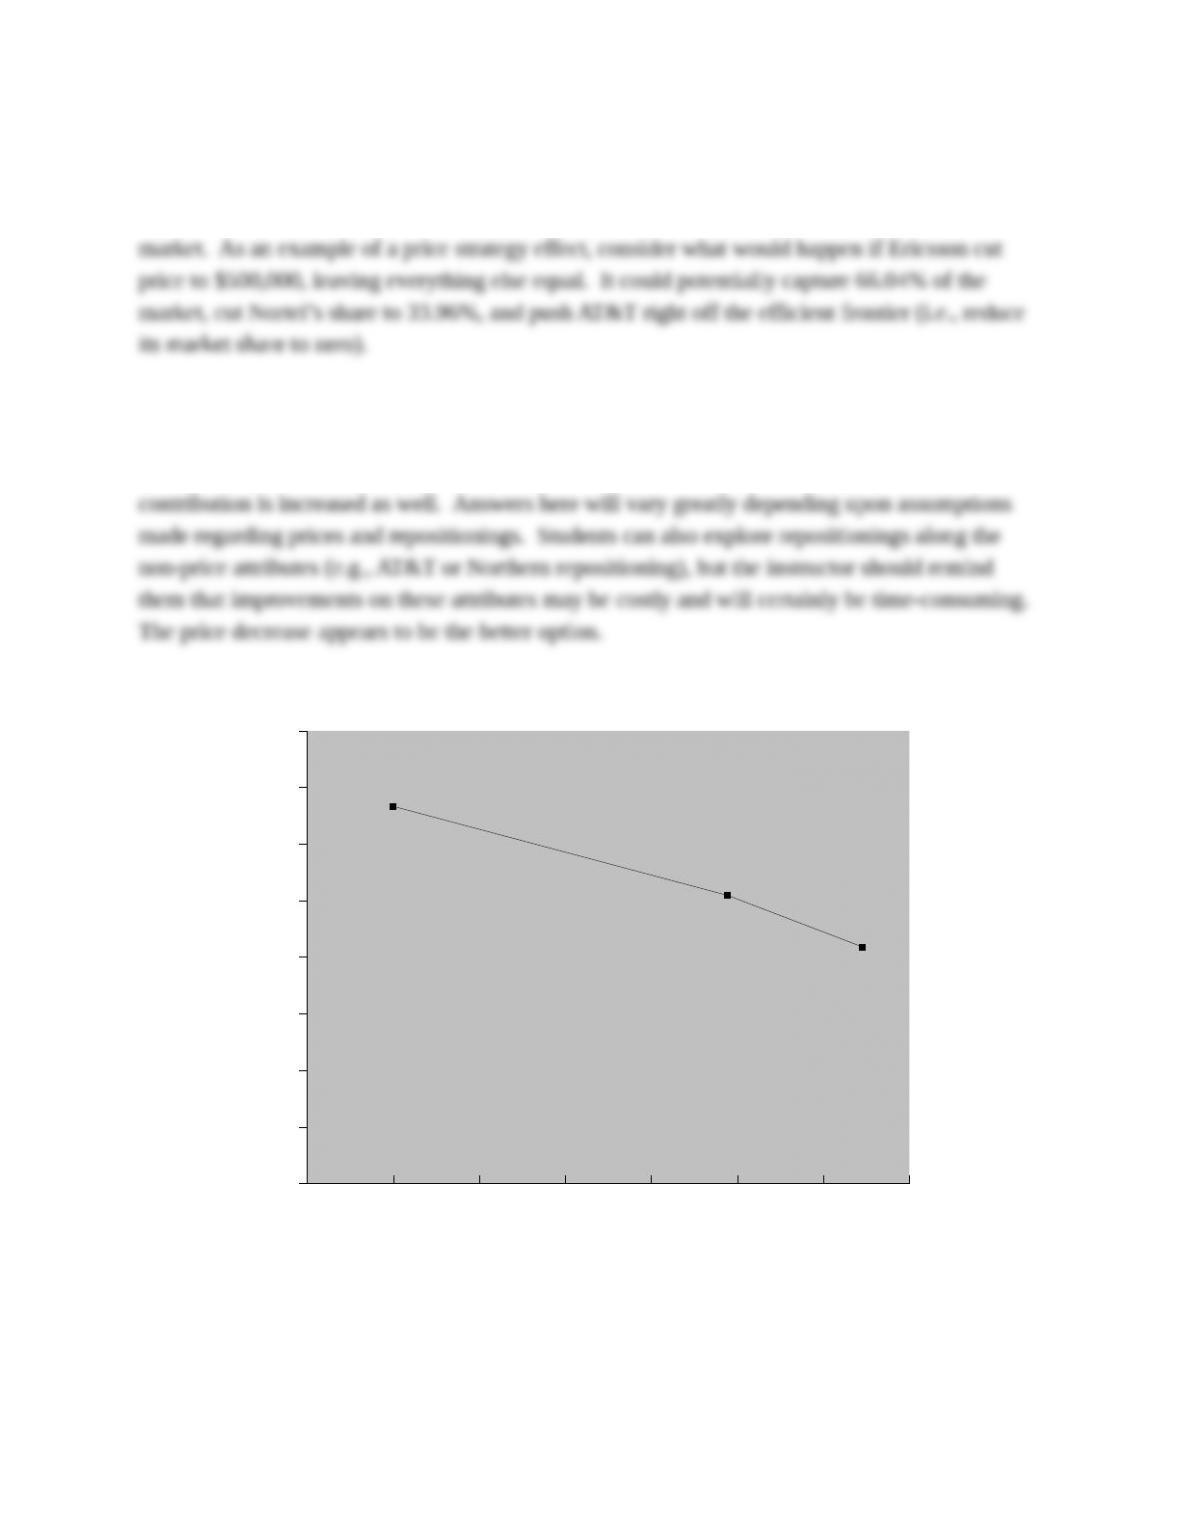
Competitive positioning will likely not keep Nortel out of the market, but may prevent Northern
from getting a runaway lead in market share and profit contribution. Despite Ericsson’s
aggressive repositioning, Nortel still is projected to gain a large share of the Mexican switch
There are several potential strategies Northern can employ to blunt the implied threat of
Ericsson, should it threaten to cut price as above. The easiest is to match price at $500,000. This
increases Northern’s market share projection to 59.64%. Likewise, Northern’s profit
0.005 0.005 0.006 0.006 0.007 0.007 0.008 0.008
0.000
0.001
0.002
0.003
0.004
0.005
0.006
0.007
0.008
Attr i bute 1/$
Attr ibute 2/$