
Dell Computers1
Introduction
Dell Computers was founded by Michael Dell in 1984 and has its corporate headquarters in
Round Rock, Texas. Michael Dell’s winning idea was to sell computer systems directly to
customers, allowing him and his company to understand customer needs well and therefore to
provide the customer with the most appropriate computing solutions. Dell still practices the
direct business model, saving time and cost by bypassing retailers and passing on the cost
savings to the customer. Dell takes pride in its ability to provide customers with the most
up-to-date technology more quickly than its competitors that still rely on slower indirect
distribution channels.
Dell has a major presence on the internet, having launched dell.com in 1994. By 1997, Dell was
generating $1 million daily in online sales – the first company to achieve this mark. At dell.com,
customers can put together their own computer system, order it online, and track its flow from
manufacturing to shipping. Dell also offers its premier.dell.com Web pages, allowing business
and institutional customers to conduct online business. Currently, Dell receives about two billion
page requests per quarter, covering 81 country sites, 28 languages and dialects, and in 26
different currencies.
The Computer Industry
The market for personal computers has been growing rapidly for several years with little end in
sight. As of the end of the year 2000, approximately 120 million PCs were sold worldwide.
Projections for the next five years of industry sales are as shown below:
Year 2001 2002 2003 2004 2005
Market Size (in millions) 136 152 168 184 200
Competition
The PC industry has four major competitors: IBM, Dell, Compaq, and Hewlett-Packard (HP).
All four make and sell competitive mid-range performance PCs, with the typical configuration
for home or small business use costing approximately $1000. Dell’s variable costs per unit total
about $800, and it is believed that competitors face a similar variable cost structure. The
Executive would be priced competitively, at about the same price level of $1000.
A recent study of the home/small-business PC market found that most customers considered two
important non-price attributes when selecting a PC, flexibility and performance. Flexibility
1 This case was written by Prof. C. Anthony Di Benedetto and is based on public information, including information
at www.dell.com. The “Executive” is a disguised product name. Market size and market share information is
realistic for the leading competitors. Note that there are more than four key players in the computer industry but that
some simplifying assumptions were made for the sake of presentation. Positioning information and
company/industry financial information is not based on fact but is meant to illustrate concepts of product
positioning, advertising decision-making, and financial analysis.

refers in this situation to a PC’s ability to run several different kinds of software, to be easily
connected to printers and other peripherals, suitability for business as well as educational or
game use, and so forth. Performance, by contrast, referred to speed of internet connection and
internal calculations, support of the highest-end software programs, and reliability and accuracy
of calculations (the study was done soon after the infamous Pentium “bug” was found, which
caused a very small percentage of numerical calculations to be slightly wrong). Using familiar
customer survey methods, the consultants conducting the study found the perceived positions of
each of the four major brands on the two key non-price attributes. In the same survey, customer
preferences were also gathered, and these were used to identify “ideal brands” and assess the
number and size of customer benefit segments in the marketplace. Three segments were
identified. Segment 1 (about 20% of the market) prefers highly flexible PCs, Segment 2 (about
50% of the market) likes high-performance machines, and Segment 3 (about 30% of the market)
values a combination of the two attributes. The results of the study are summarized below.
Attribute 1
(Performance)
Attribute 2
(Flexibility)
Size of Segment
Relative to
Market
Ideal Brands by Segment
Segment 1 -0.5 3 0.2
Segment 2 2 -1 0.5
Segment 3 1.5 1.5 0.3
Brand Positions
Dell 1 -1
IBM 2 -1.5
HP 1 3
Compaq 0.5 0.5
Dell’s Marketing Budget
As its product line has expanded and competition has continued to be fierce, Dell has allocated
significant budgets to both advertising and distribution. Considering first its distribution
policies, Dell uses two principal channels. First is the lower-end channel, used to target PC users
who need simple, stand-alone solutions to their PC needs. These users include a large number of
both home users and small businesses, and are primarily targeted through superstores and
discount clubs as well as through on-line shopping. Users with more complex needs are targeted
via specialty computer stores that can provide more high-touch customer solutions. This target
group also comprises both home and business customers.
If Dell is to launch its new Executive PC, the extensive, multiple distribution channel
arrangement is expected to cost in the order of $500 million yearly. The advertising budget is
similarly in the range of about $500 million as extensive consumer advertising across multiple
media and vehicles is complemented with substantial trade advertising to all dealer sizes and
types.

In preparation for a financial analysis, Dell’s consultants developed the following set of estimates
regarding the impacts of the advertising and distributional expenditures on Executive PC sales.
Note: in this durable-goods context, certain terms need to be redefined carefully. “Switching”
refers to a current non-Dell user switching to a Dell Executive PC the next time he or she
purchases a PC, and “repurchasing” refers to a current Dell user purchasing a Dell Executive.
Note also that sales promotions such as coupons are irrelevant for this particular firm, so sales
promotion budget should be left at zero and the “probability of trying a received sample” line
should be ignored, as it has no effect on the calculations.
Long-Run Trial Probability (F) 0.7
Prob. of Trying a Received Sample (U) 0
Prob. of Switching to New Brand (Qkz) 0.8
Prob. of Repurchasing New Brand (Qzz) 0.8
Financial Evaluation of the Executive PC
Dell wants to do a financial analysis of the Executive PC to assess the proposed new product’s
value. Much of the information presented or calculated above can be used in making this
assessment, though the consultant team had to estimate some additional figures with the help of
top management. Estimates and managerial input useful for the financial analysis include the
following:
Fixed (indirect) production costs = $100,000,000 yearly.
Corporate overheads (exclusive of R&D) charged to the new product = $100,000,000 yearly.
R&D to be charged to the new product: 2% of dollar sales, beginning in Year 1.
Cannibalization: negligible.
Project abandonment: negligible.
Tax rate: 34%, with no applicable tax credits.
Cost of capital: 15%.
Working capital:
Cash as percent of sales: 10%.
Inventory as percent of sales: 10%.
Accounts Receivable as percent of sales: 15%.
Working capital recovery in Year 5:
Percent of cash: 100%.
Percent of inventory: 80%.
Percent of accounts receivable: 100%.
Investment in production facilities: one-time-only $100,000,000 charge in Year 0 (now),
depreciated over five years using the straight line method.
Dell Computer Discussion Questions
1. According to the PERCEPTOR model, what are the positions of Dell and its
competitors in the product space defined by the two most important attributes?
How do your positions, and competitive positions, relate to the ideal brand positions
of the segments? Which of the brands are well positioned in this market, in your
opinion? What are the projected market shares for Dell and its competitors based
on this model?
Answer:
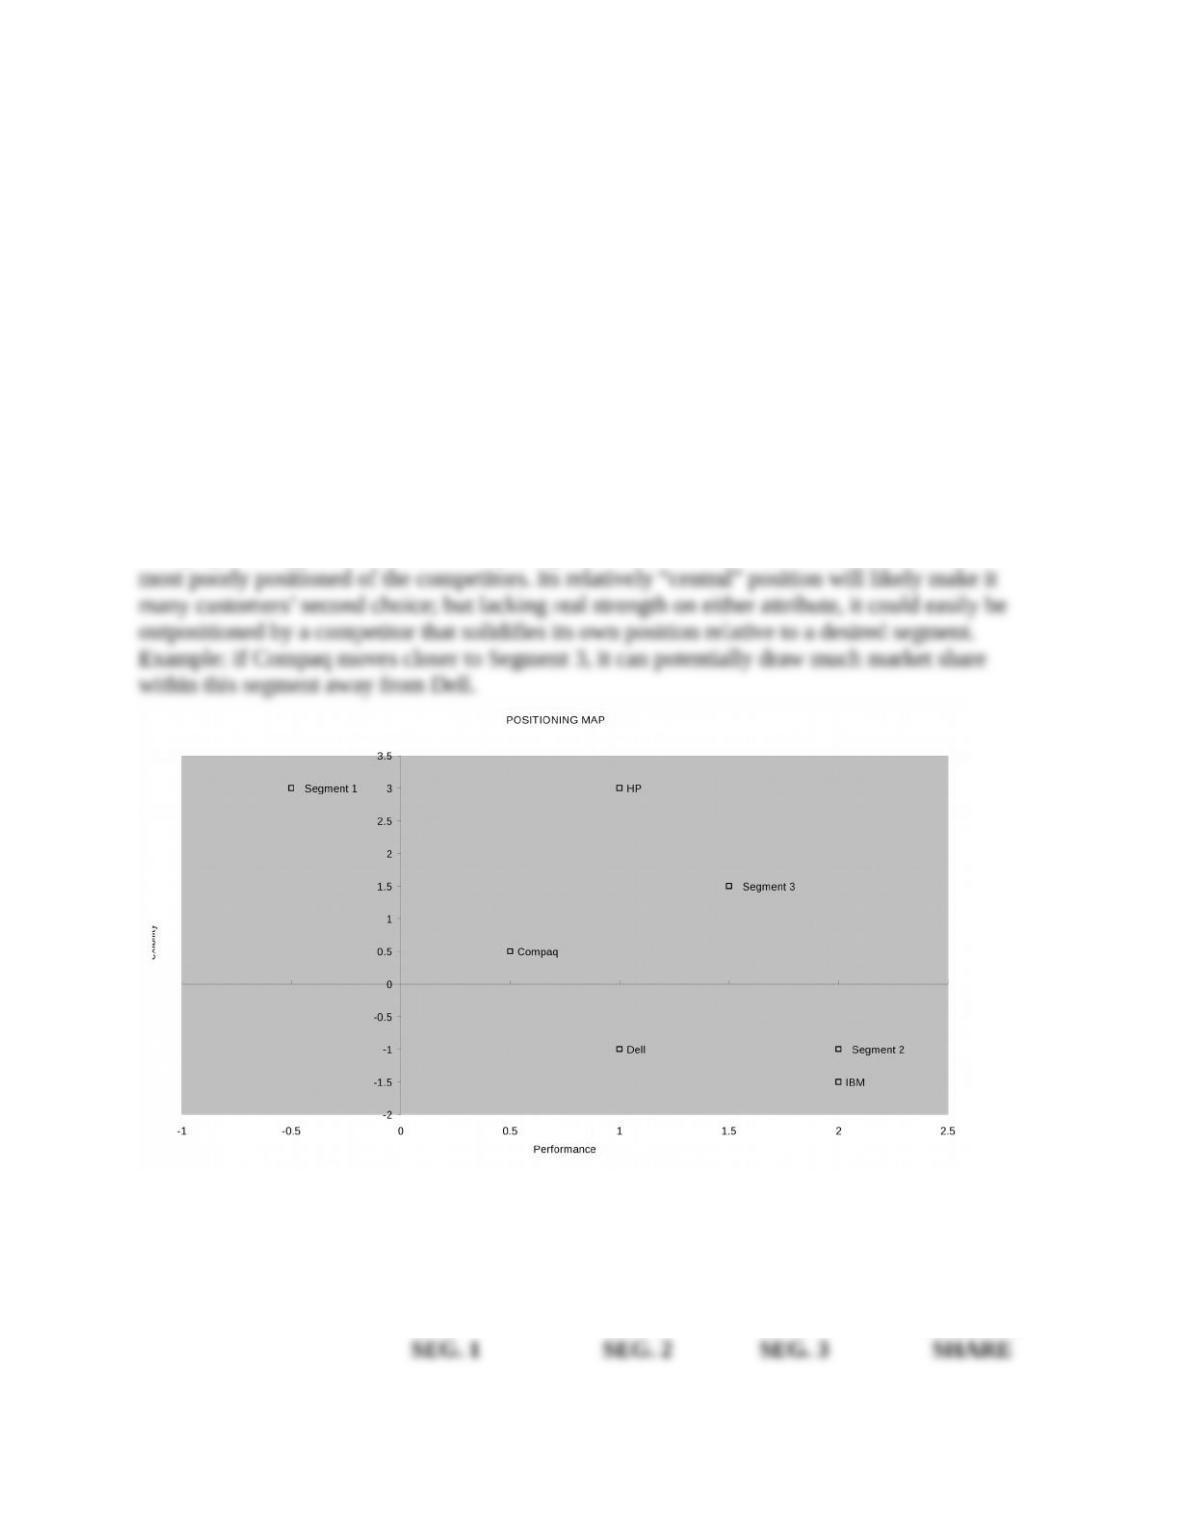
The PERCEPTOR spreadsheet yields the following perceptual map. According to this map,
Segment 1 favors flexibility, Segment 2 favors performance, and Segment 3 likes a blend of the
two. Regarding relative positions of the competing brands, IBM seems to have a lock on
Segment 2; Segment 1 is likely to favor HP due to its high flexibility but some may like
Compaq; and Segment 3 seems to be up for grabs. Dell’s Executive, in fact, seems to be the
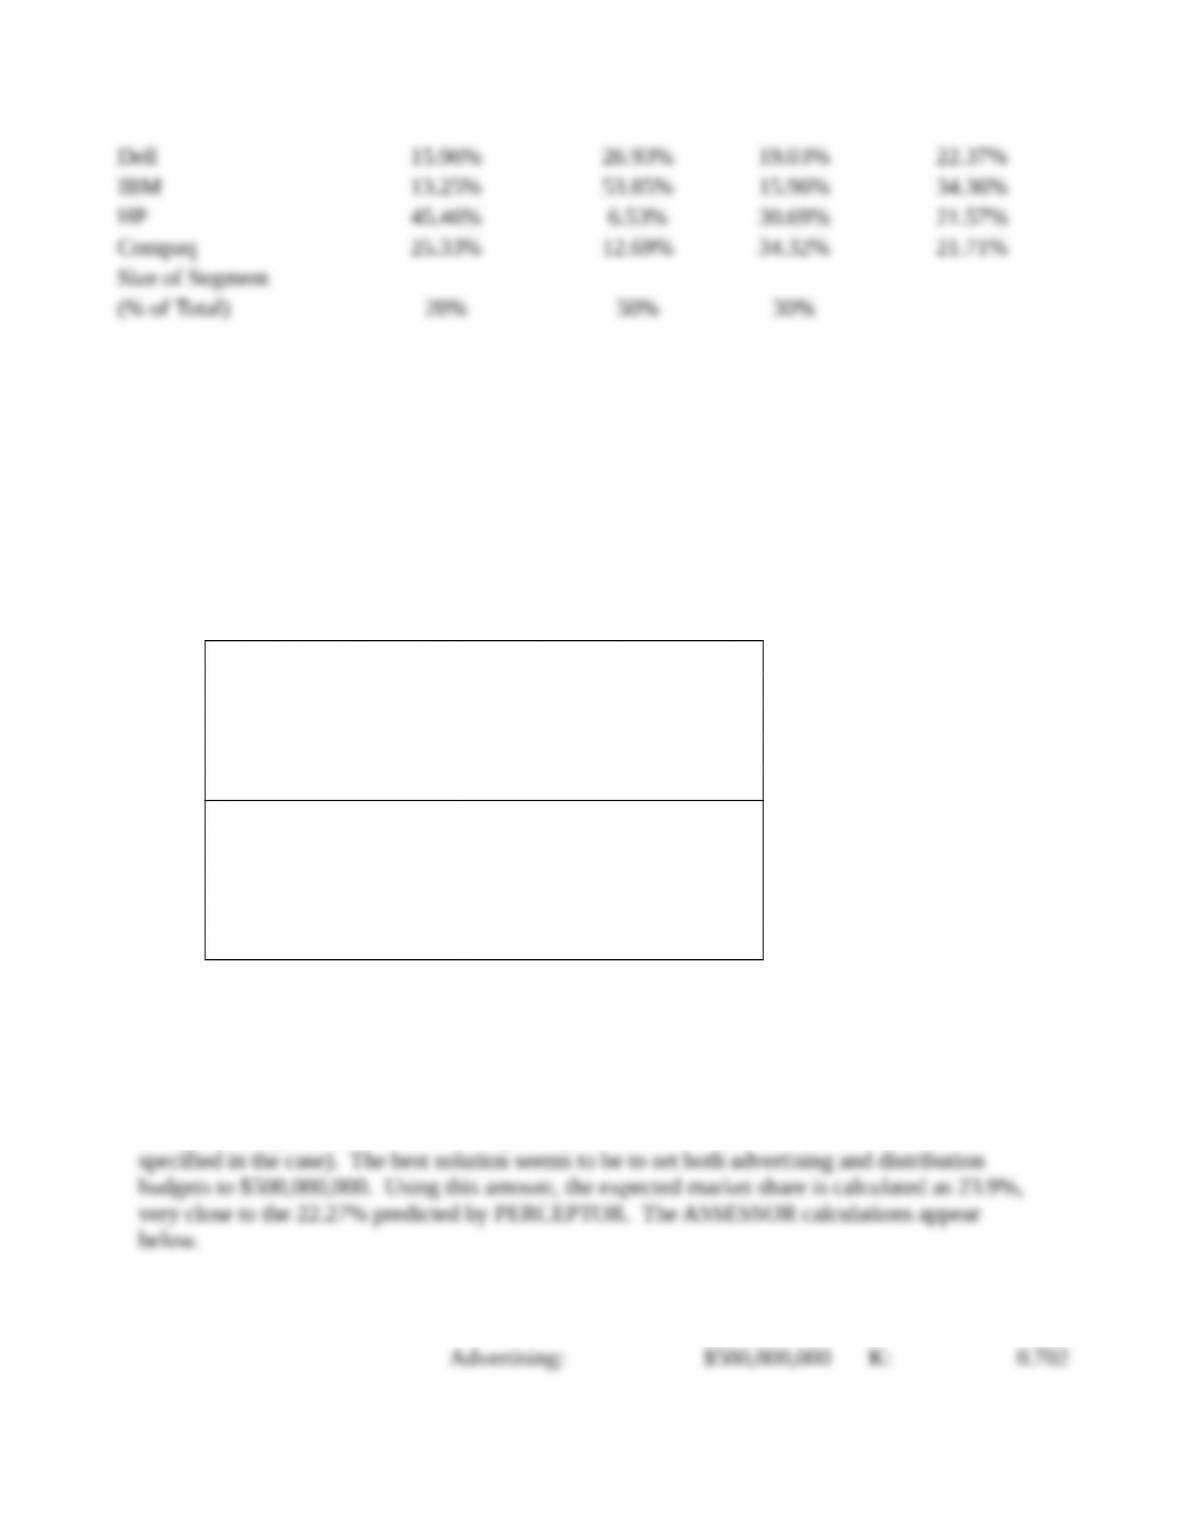
The market share analysis below confirms the reasoning from the perceptual map analysis. Dell
is actually the second or third favorite across all three segments, with a combined market share
of 22.37%. HP captures Segment 1, IBM captures segment 2, while HP and Compaq split
Segment 3.
BRAND SHARE IN SHARE IN SHARE IN TOTAL
MARKET
2. What marketing mix (advertising and distribution) will you recommend? Use
ASSESSOR to allocate the marketing budget and develop a market share estimate.
Use the initial proposed budgets for yearly advertising and distribution, and assess
how much market share is affected if these budgets are changed (keeping the total
amount expended the same as Dell considers this to be an absolute ceiling on
marketing expense). How do the market share estimates obtained by PERCEPTOR
and ASSESSOR compare? To answer this question, use the information provided in
the case, together with the following additional information obtained from the
consultants:
FOR THE ADVERTISING RESPONSE FUNCTION
Reference Budget: $200,000,000
Minimum Share: 5.0%
Maximum Share: 90.0%
Exponent: 1.3
FOR THE DISTRIBUTION RESPONSE FUNCTION
Reference Budget: $200,000,000
Minimum Share: 0.0%
Maximum Share: 90.0%
Exponent: 0.8
Asnwer:
To solve, add the case information on advertising and distribution response function to the
ASSESSOR model, then try different combinations of advertising and distribution budgets,
always keeping the sum of the two budgets equal to $1 billion (the maximum total amount as
ASSESSOR MODEL
Contribution Per Unit $200.00
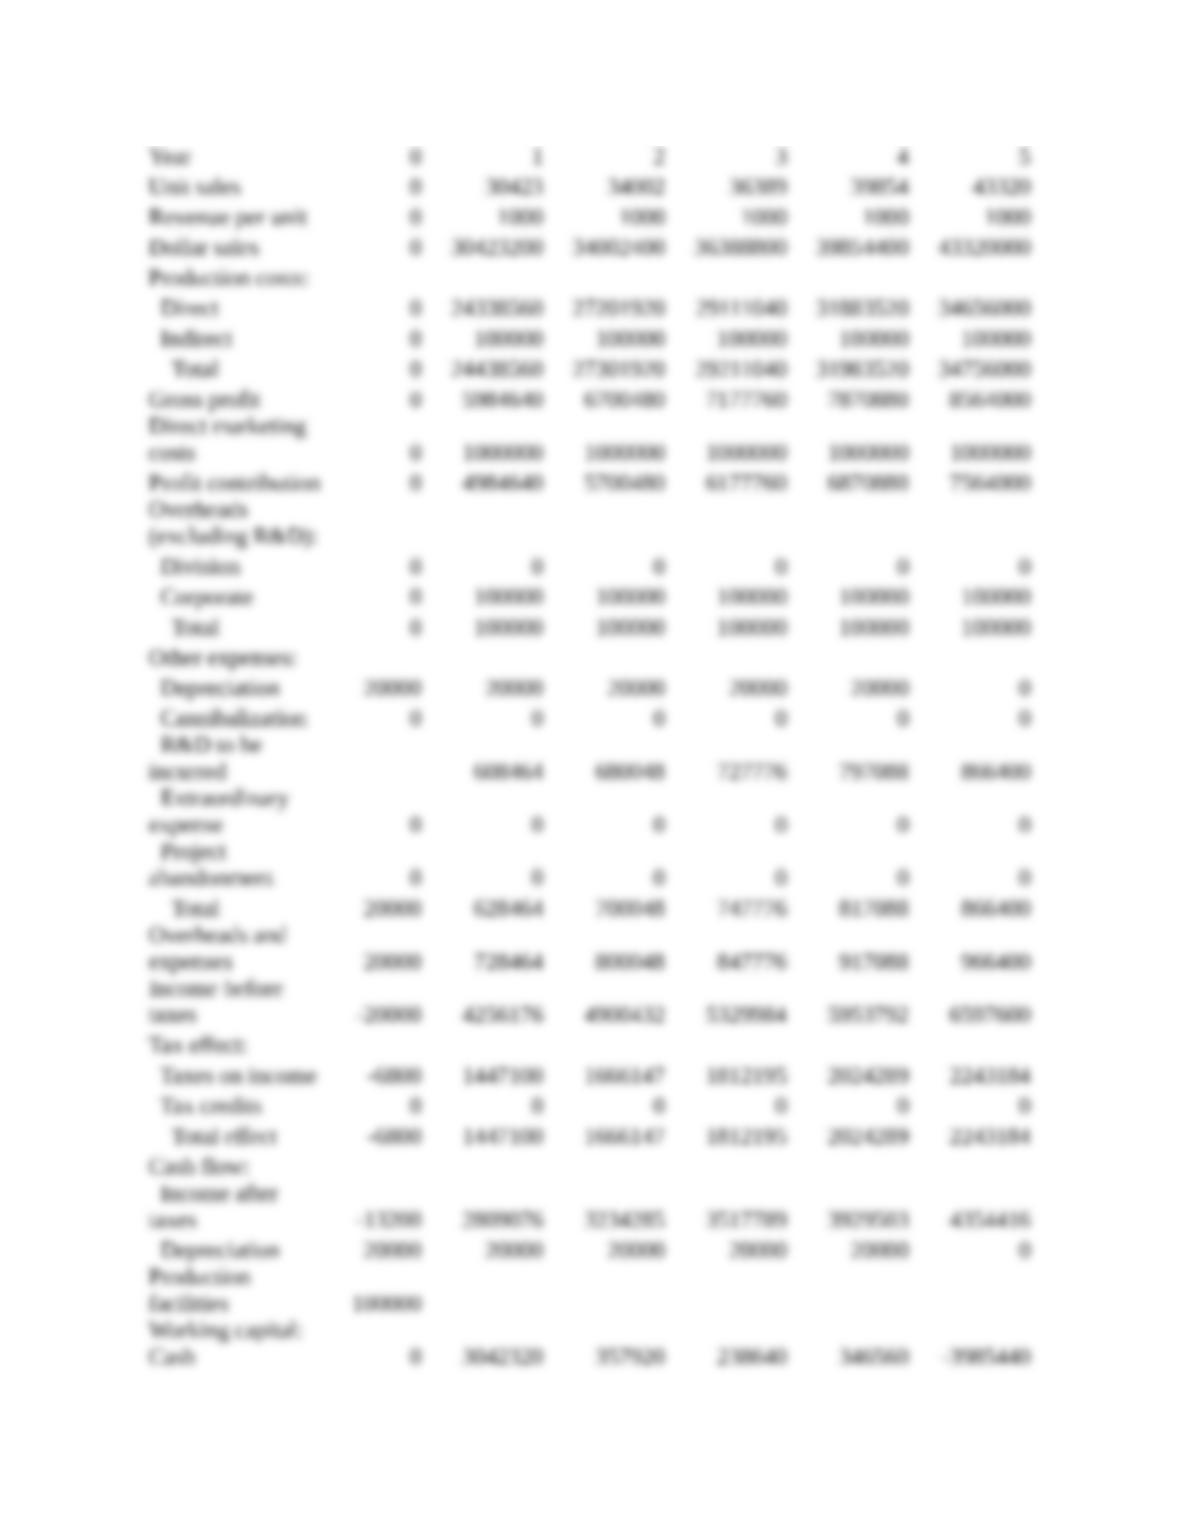
3. Using the FINANCIAL worksheet, do a five-year projection for Dell’s Executive PC
using market shares obtained from PERCEPTOR or ASSESSOR. Assume the
market share projected for Year 1 by PERCEPTOR or ASSESSOR is maintained
through Year 5. Hint: When using the FINANCIAL worksheet, make your entries
of unit sales in thousands of units, and dollar figures in thousands of dollars. That
is, to enter 30 million units, type “30000,” or to enter indirect costs of $100,000,000,
enter “100000.” This minimizes the number of zeroes in the spreadsheet and
facilitates interpretation. Caution: Add back the zeroes when obtaining results. So
if your NPV shows “$2,000,000,” it really means $2 billion!
Answer:
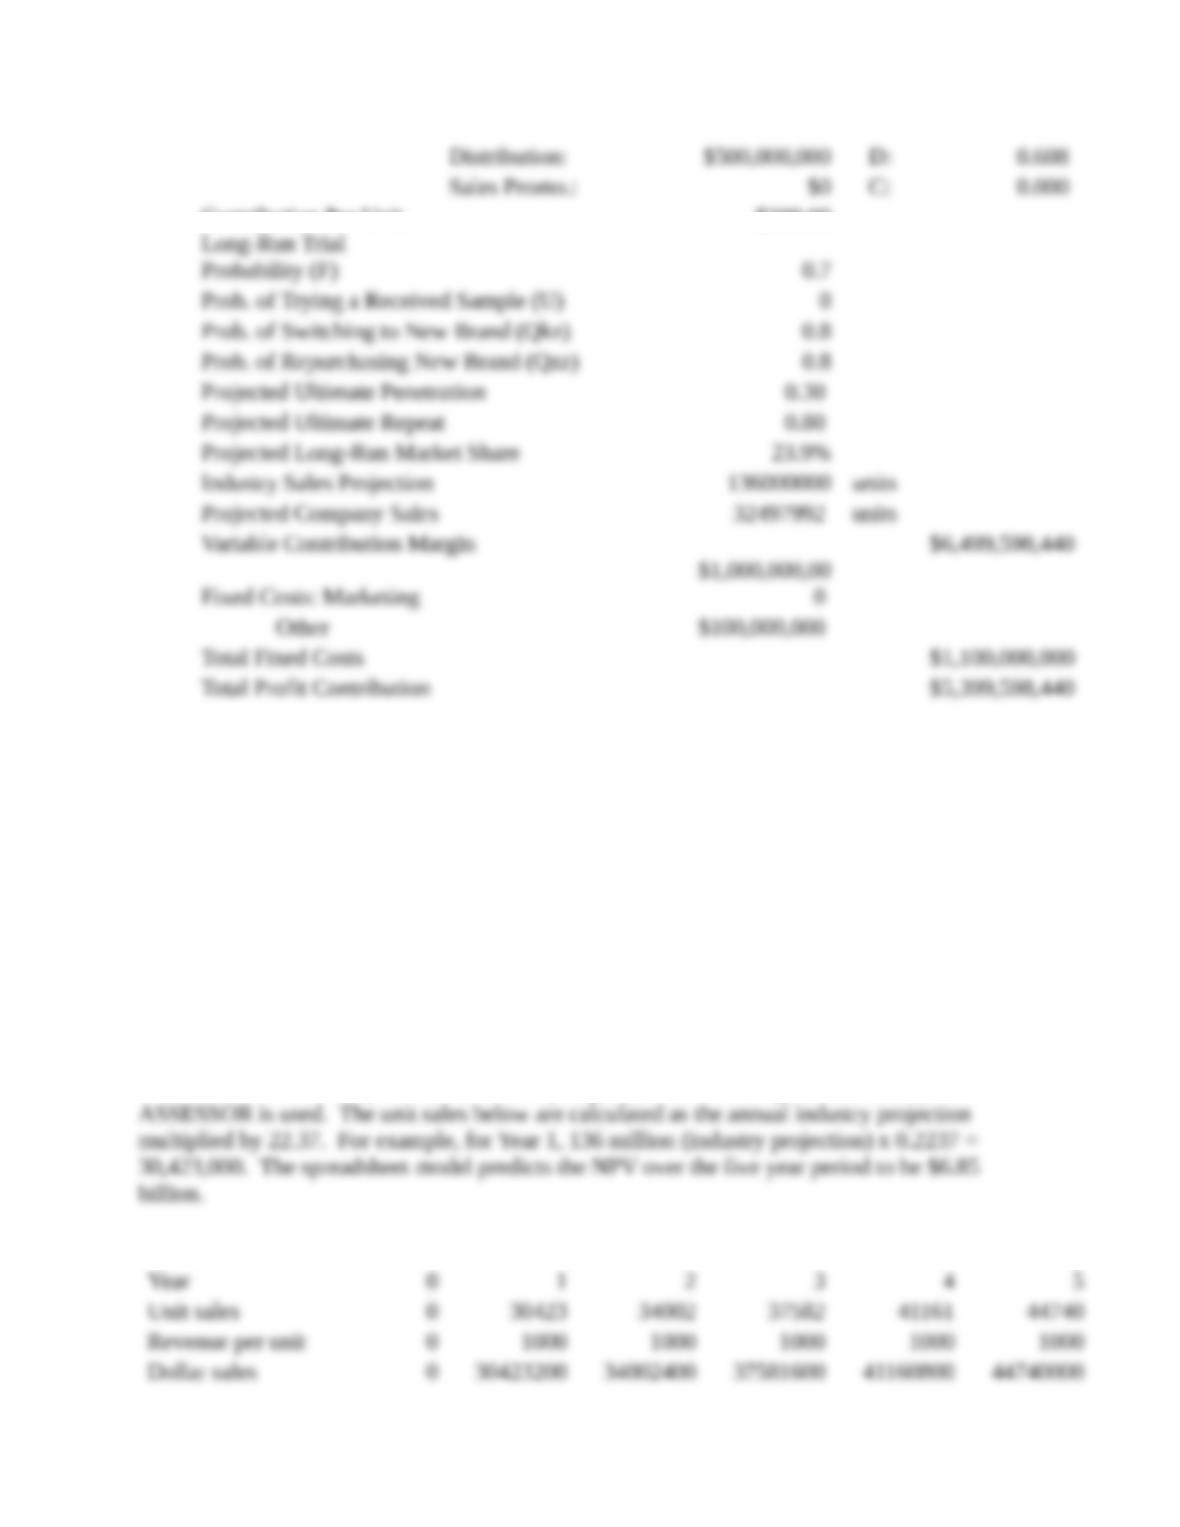
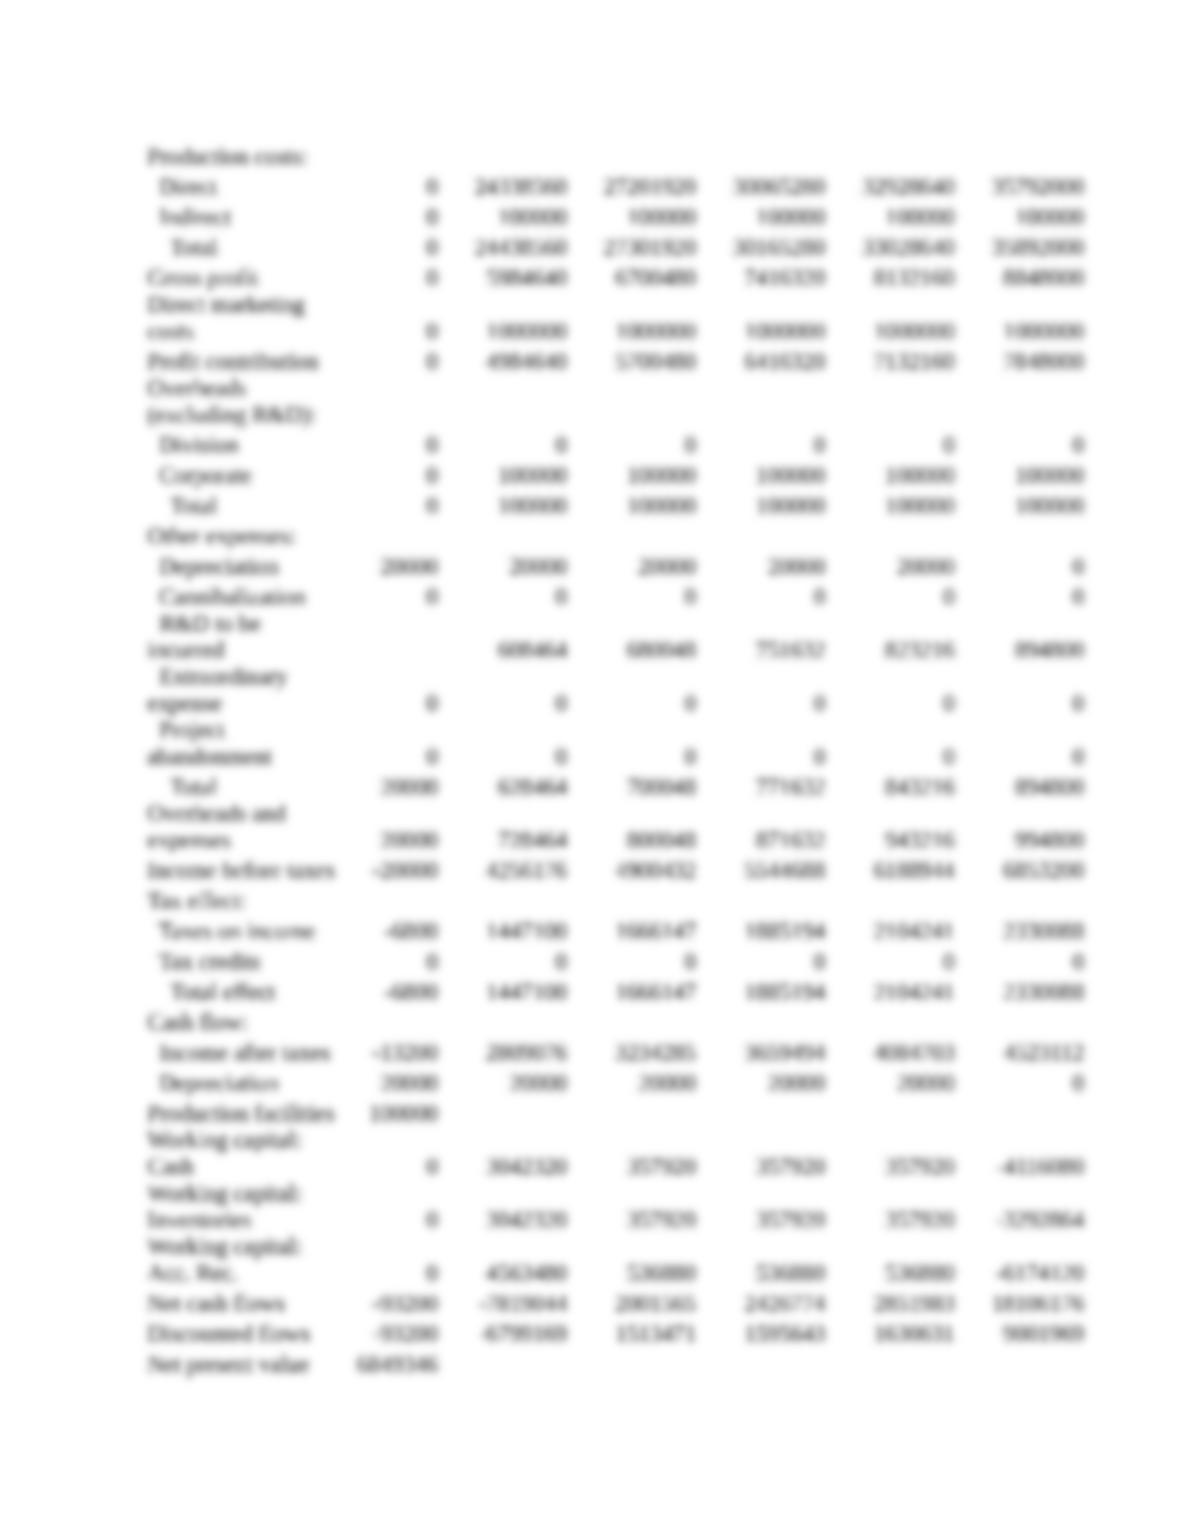
The following FINANCIAL worksheet assumes 22.37% market share (the amount obtained by
the PERCEPTOR model). Answers will vary slightly if the 23.9% figure obtained by
FINANCIAL WORKSHEET
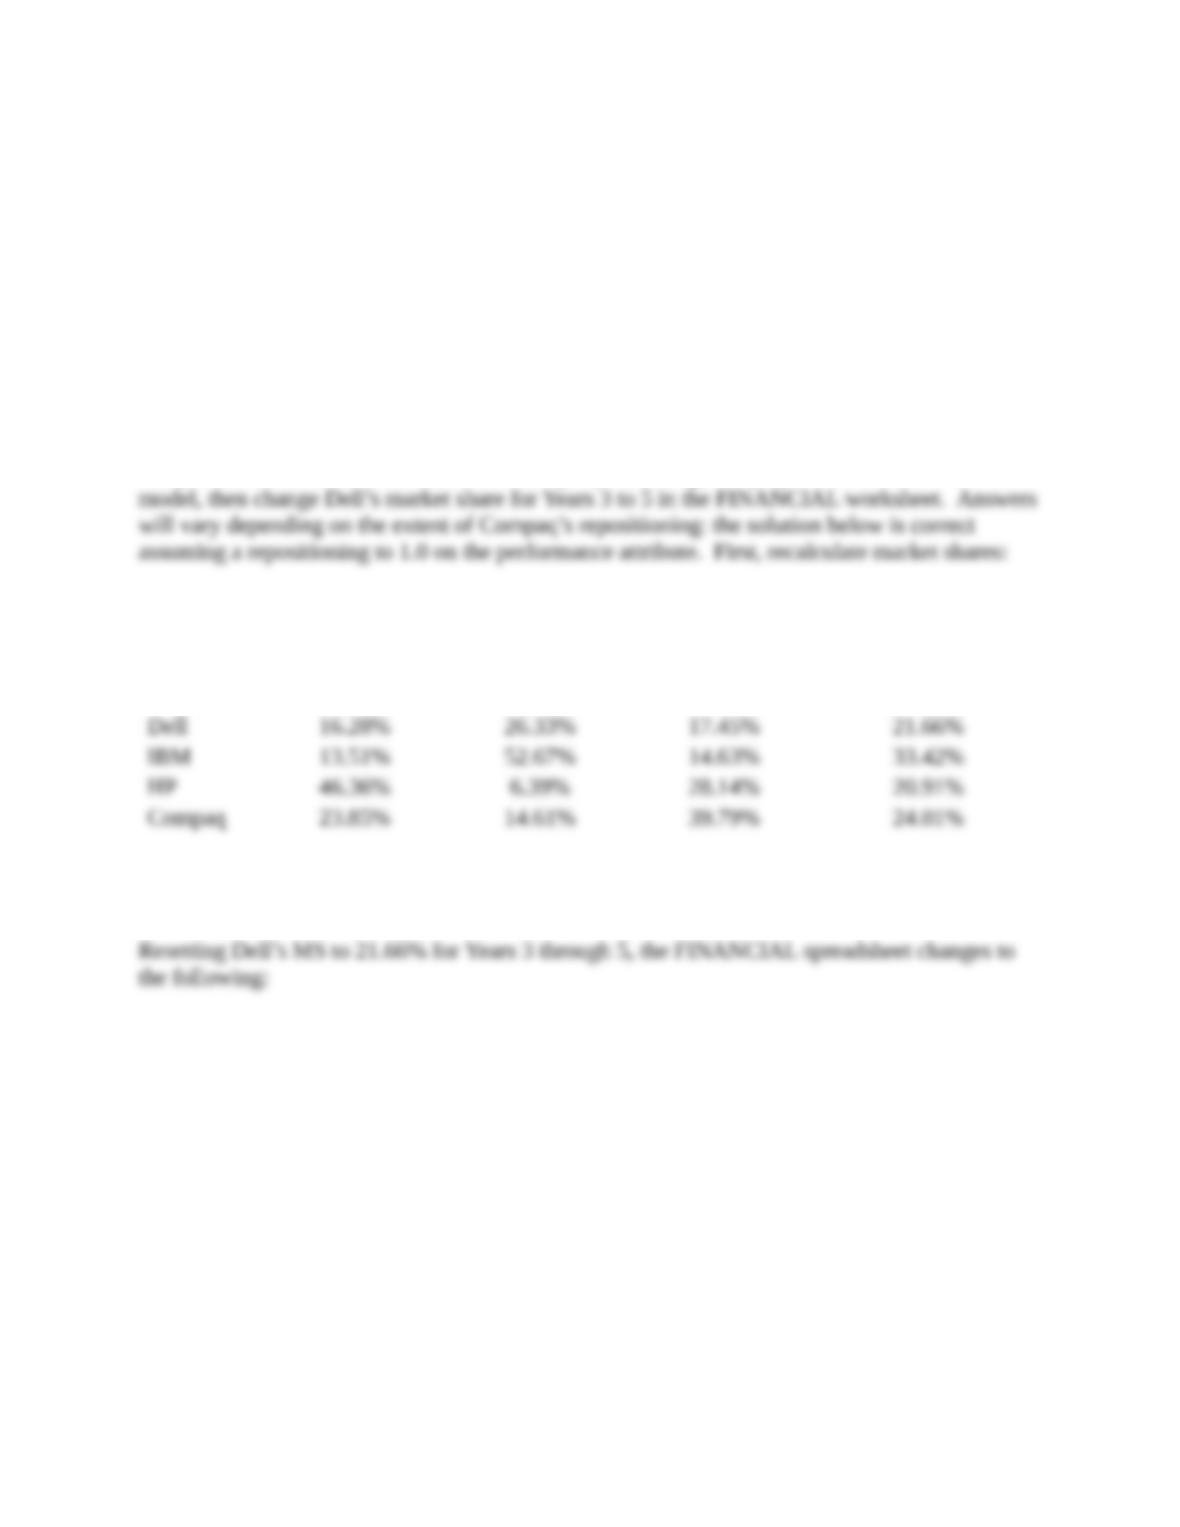
4. Suppose Compaq repositions positively on the performance attribute at the end of
year 2. Go back and recalculate market shares for the four brands, and use this
market share estimate for years 2 through 5 to recalculate your five-year projection
using the FINANCIAL worksheet. How much is Dell affected by this repositioning
by Compaq? What steps could Dell take now to protect its position? Explain.
Answer:
If Compaq repositions from 0.5 to, say, 1.0 on the performance attribute at the end of year 2, it
improves its market share (in Segment 3 in particular) and cuts into Dell market share. To solve
this problem, first recalculate market shares by repositioning Compaq in the PERCEPTOR
BRAND SHARE IN SHARE IN SHARE IN TOTAL
SEG. 1 SEG. 2 SEG. 3 MARKET SHARE
Compaq improves to 24.01% while Dell declines to 21.66%. Most of the change is due to
market share shifting in Segment 3.
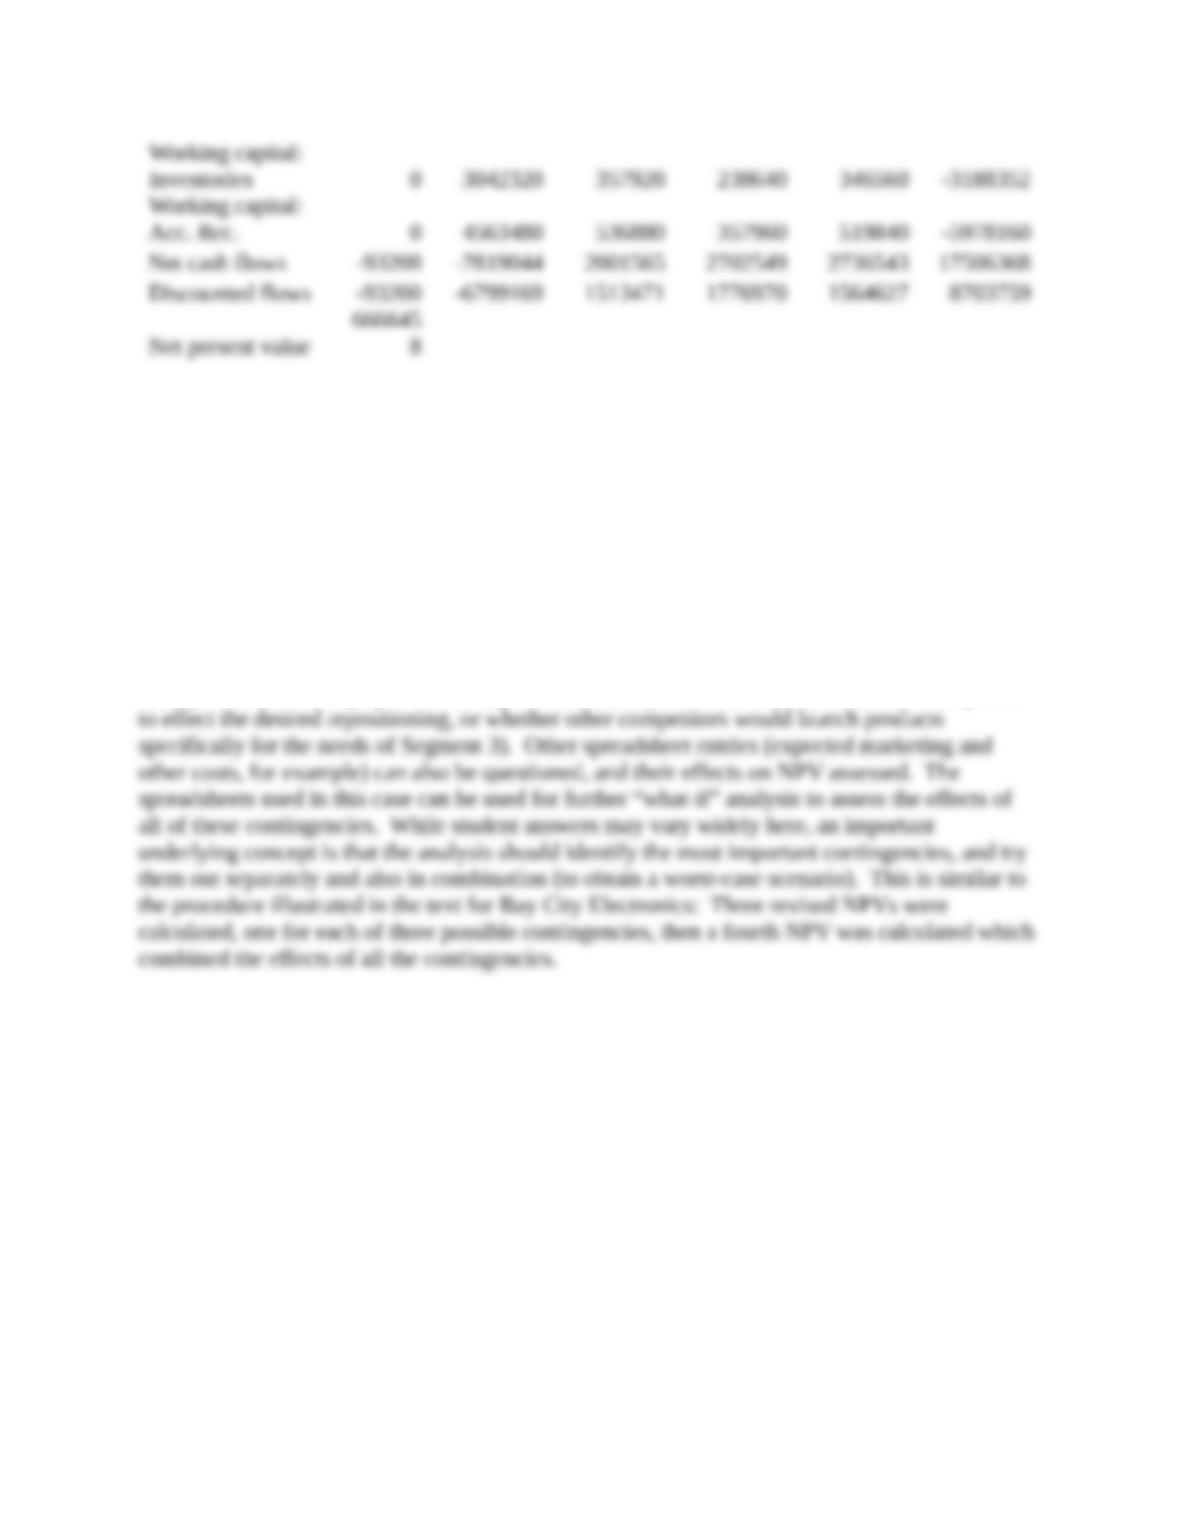
The NPV declines from about $6.85 billion to about $6.67 billion.
5. Considering all of the above information, should Dell launch the new Executive PC?
Explain why or why not.
Answer:
Considering all of the above information, the new Executive line seems to be very profitable for
Dell. The best estimate of market share and long-term NPV is about 23% and $6.85 billion
respectively, and at first glance the threat from Compaq seems to have little effect on NPV. A
fuller analysis would assess how likely other competitive threats would be (considering for
example whether Compaq would be capable, financially as well as from a technical standpoint,