Carfit Autoparts
Introduction
You are the newly appointed product manager for a company called Carfit, which markets
replacement parts for all makes of cars in the United Kingdom. Carfit’s product line of auto
parts is sold to independent repair shops and do-it-yourselfers through wholesalers and local auto
accessory stores. At your first meeting, your boss, the marketing manager, outlines several areas
of concern he wishes you to address immediately. He advises you to look at these problems with
reference to Carfit’s line of oil filters, which he is assigning you to manage.
First, he is concerned with a recent market report that studied the criteria most used by small,
independent repair shops and auto accessory stores when selecting parts suppliers. He would
like you to examine how Carfit’s product line of offerings measures up to those criteria in
comparison with its main competitors.
Second, Carfit has for years placed its advertising solely in trade journals and car enthusiasts’
magazines—be it on a regular basis. As budgets are likely to face a squeeze in the next year,
your boss is concerned about whether the company is getting value for money from its
advertising strategy. He is confident there must be a more sophisticated and cost-effective
approach available. He wishes you to study the situation and recommend any appropriate
changes.
Product Positioning
A recent market research report in a respected industrial journal reported the findings of a large
survey of independent repair shop and auto accessory store owners. This report was of great
interest to Carfit as these people represent its primary market.
The survey reported that the two attributes considered most important in choosing parts suppliers
by this group of customers were product line coverage (i.e., as many different models as possible
had to be covered by a product line, or range), and availability (i.e., parts had to be available for
immediate delivery). These findings had come as a surprise to some, particularly the sales force,
who had always argued that price was probably the most important attribute.
The marketing manager explained to you that he was confident that Carfit’s warehouse
operations were among the most efficient in the industry. He was less confident, however, of
conceptions regarding product line coverage, which had come in for criticism in the past. As he
mentions to you, “This is annoying since we’ve spent a lot of time and effort responding to these
complaints over the past few years. We’ve always had good coverage of European models, and
we’ve worked hard to expand our coverage of Japanese vehicles. I’m sure our overall offer is as
good as anyone’s.”
He has asked you to look at the situation to see, in particular, if this lack of confidence in product
line coverage was leading to a loss of market share, especially to Brand B, which has a
reputation for excellent product line coverage.
The PERCEPTOR model can be used for mapping product perceptions and calculating market
shares for different perception scenarios. Using the data presented by the survey and internal
market intelligence you have decided to use this model to show current product positioning
perceptions of customers and resultant market shares. You can then use the model to predict the
market share that results from a change in the customer perceptions of one or both of the
attributes. In addition, further perceptions and market shares can be predicted after retaliatory
action by another brand. This will allow you to anticipate the results of a competitive
counterattack.
You manage to uncover four main competitors in your area of business. Your brand, as
suspected, does have a good reputation for parts availability, but suffers from a rather poor
reputation for product line coverage. After studying the survey details, you have chosen a
ranking (between –2 and +2) for each of the attributes identified as being most important for
these customers. You have similarly identified attribute rankings for Brand B, which has an
enviable reputation for product line coverage. Brand B, however, suffers from having to
distribute from a much older industrial facility not specifically designed for warehousing.
As for Brands C and D, they are important national parts suppliers, but less well established in
Carfit’s main “independent” auto parts market. They are more interested in the franchised
dealership and national wholesale parts trade. They do, however, periodically threaten a more
determined attack on the “independent” market, especially when things get tight in their more
familiar market territories.
You have rated the various brands on the attributes of product line coverage and parts availability
as follows:
Attribute 1
(Product Line Coverage)
Attribute 2
(Parts Availability)
Carfit -0.5 1.5
Brand B 1.75 -0.5
Brand C -1.5 -0.5
Brand D -0.5 -1.5
You have discovered that the coordinates for the ideal brand for each segment are as reported
below:
Attribute 1
(Product Line Coverage)
Attribute 2
(Parts Availability)
Relative Size of Segment
Segment 1 2 2 0.2
Segment 2 2 0 0.5
Segment 3 0 2 0.3
Your task is to manipulate the attribute ratings of Carfit to see if a more favorable market share
can be obtained by altering customer perception of Carfit’s attributes. Changes to the positions
of the brands on the perception map may be observed as you go along. Hint: The key to gaining
market share is to identify the market segments that are present, and who is, or is not, addressing
them.
Advertising Budget
By using a version of the ADBUDG model, you think you will be able to demonstrate a more
effective way to use Carfit’s advertising budget.
The marketing manager explains industry trends to you that you may find useful in this task.
Many auto parts sales are seasonal in nature. Some obvious examples are antifreeze and
batteries, which are often changed in winter servicing. Many do-it-yourself sales also occur in
the spring.
He admits little effort has been made to study the effectiveness of previous advertising
campaigns, which have followed similar themes and regular timing patterns with little attempt to
exploit seasonal business. “This is an industrial company at heart,” he says. “Most of our
internal marketing effort is aimed at checking suppliers’ product quality, catalog production, and
other merchandising, with some technical assistance to sales. Advertising is something we’ve
just always budgeted for and used our allocation as usual. This year our parent company’s group
financial controller has asked all department heads to justify their budgets, so I think it’s time
someone looked at this. If we could demonstrate the results of more effective advertising
expenditure, we should be able to keep the allocation without too much of a problem. If we can
come up with a good reason for an increase, so much the better.”
The ADBUDG model allows you to see the effects of changing your advertising spending
patterns over four quarters. In this case, you can assume that your yearly budget has already

been allocated. You must try to maximize your sales with a more effective spending pattern than
the original equally distributed quarterly allocation.
The account executive at your advertising agency has provided you with the following estimates,
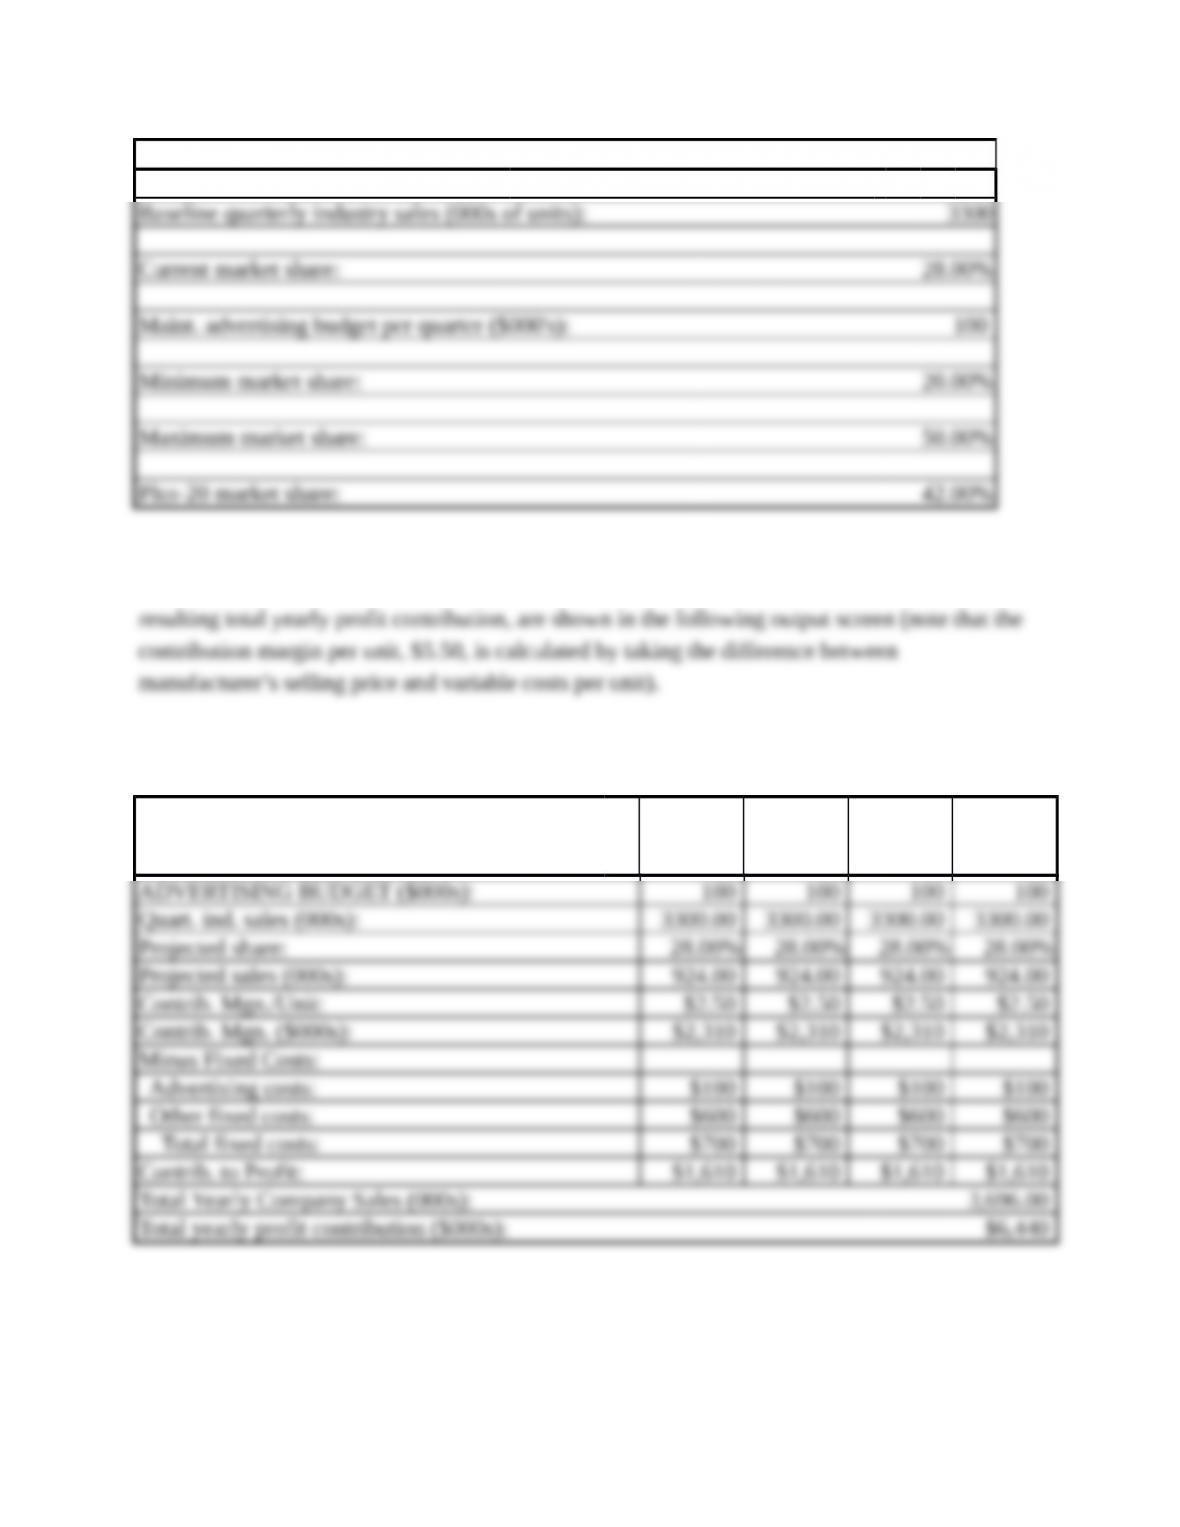
to be used in the ADBUDG model:
Current Carfit market share: 28%
Maintenance advertising budget (per quarter): $100,000
Minimum market share (if advertising were cut to zero): 20%
Maximum market share (if advertising to increased to maximum): 50%
Plus-20 market share (if advertising were increased to 20
Percent more than the maintenance budget): 42%
In order to convert the market share estimates generated by ADBUDG into profit contributions,
the following additional information is also available: Manufacturer’s selling price = $8.00 per
unit; variable costs per unit = $5.50, quarterly sales in the industry = 3,300,000 units, fixed costs
other than advertising incurred per quarter = $600,000.
(You can assume that there are no significant seasonality effects in this industry, so all seasonal
indices should be set to 1.)
Carfit Autoparts Discussion Questions
1. What product position should Carfit strive to achieve for its oil filter line? Back up
your recommendations with results you obtain from the PERCEPTOR model. Note
what your actions imply in terms of market share on this line. Using PERCEPTOR,
perform a “what-if” analysis to determine the effect of a counterattack by Brand B
against Carfit.
Answer:
This solution makes the assumption that there are three segments for oil filters. One segment
values both attribute 1 product line coverage, and attribute 2, availability, very highly with scores
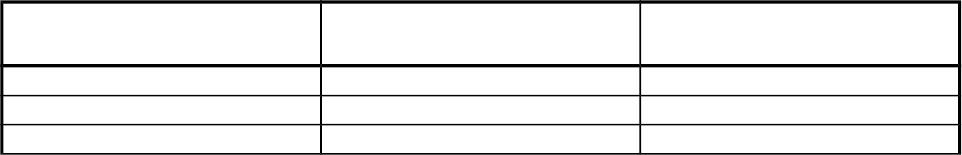
SITUATION ANALYSIS — FOUR COMPETITORS IN
INDUSTRY
ATTRIB. 1 ATTRIB. 2 SIZE OF SEGMENT
REL. TO MARKET
The relative sizes of the hypothesized ideal segments are also shown in the above screen. As a
result of these inputs, the market share for each brand is shown in the market share analysis
output.
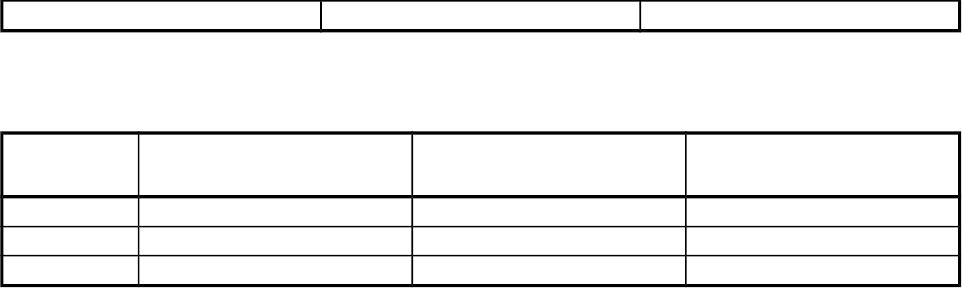
BRAND SHARE IN SHARE IN SHARE IN TOTAL
SEG. 1 SEG. 2 SEG. 3 MARKET
SHARE
Carfit’s oil filters are projected to have an overall market share of 30.32% with Brand B being
the major competitor at 37.57%. Carfit’s oil filters will do extremely well with Segment 3 which
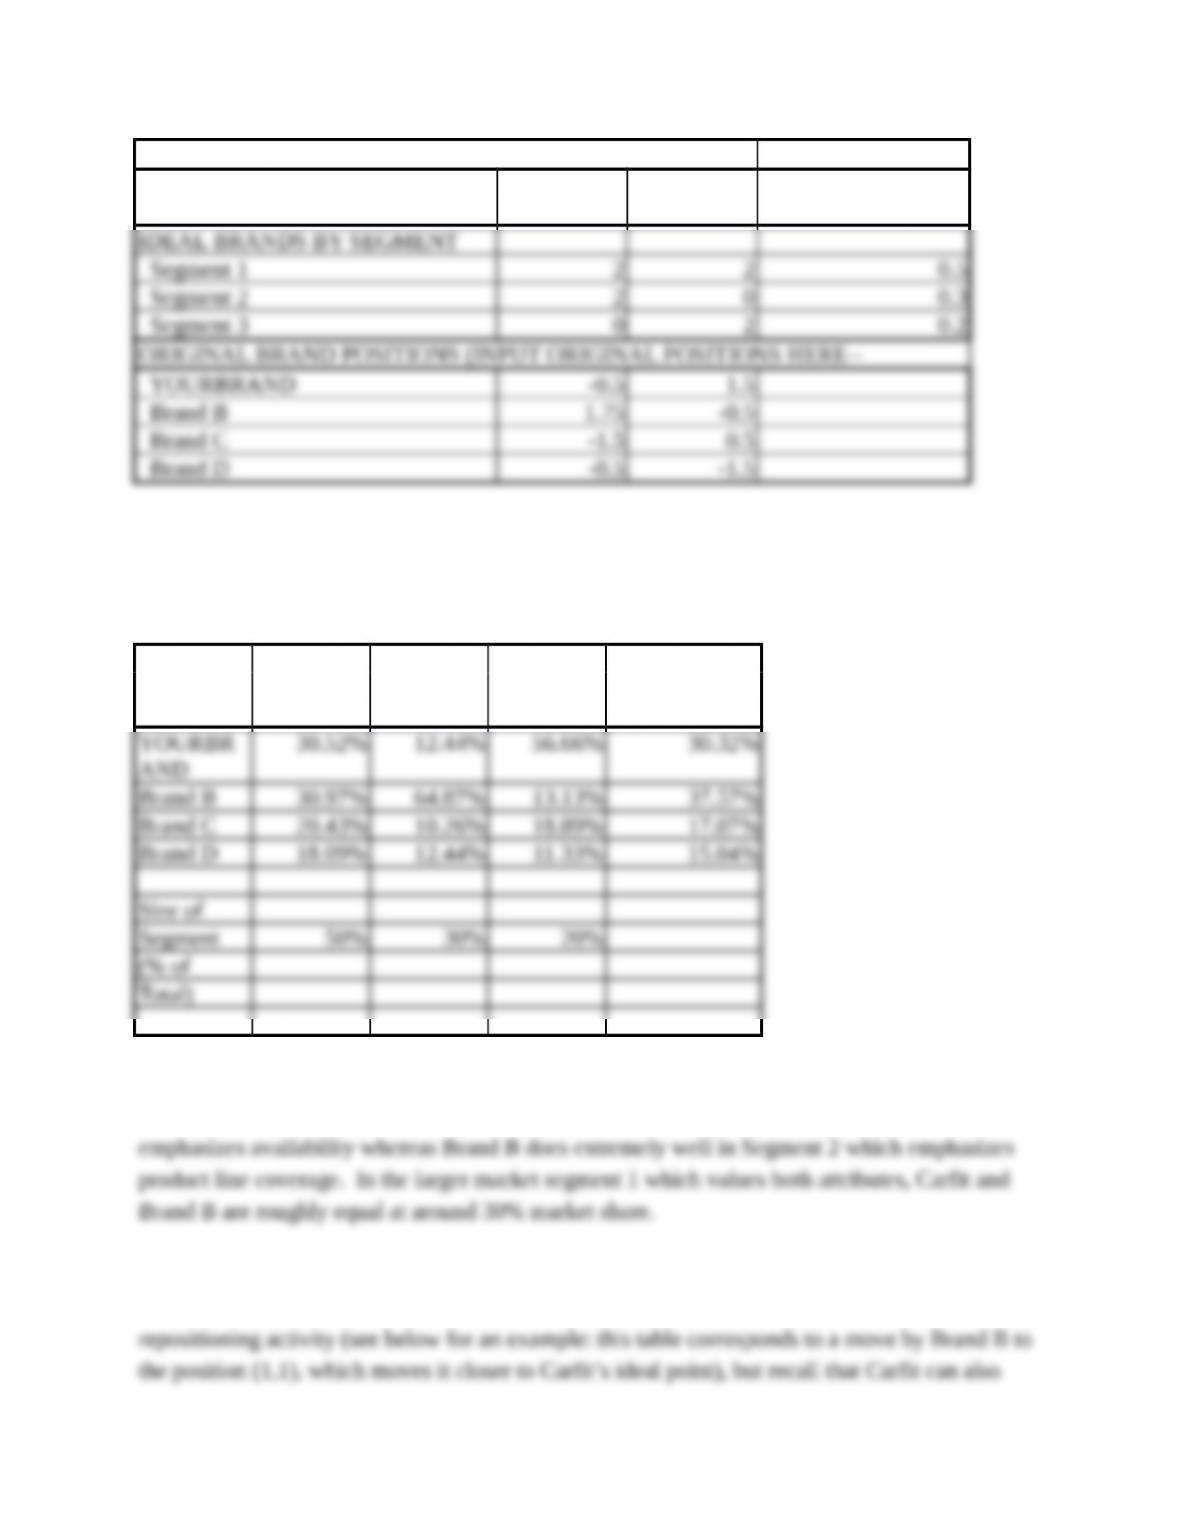
(b) Using PERCEPTOR, one can try several possible repositionings for Brand B and determine
the effect on Carfit’s market share. Carfit’s market share can be somewhat affected by Brand B
BRAND SHARE
IN
SHARE
IN
SHARE
IN
TOTAL
SEG. 1 SEG. 2 SEG. 3 MARKET
SHARE
2. Use the ADBUDG estimates and model to help Carfit management make a decision on
advertising expenditure. Adjust the quarterly advertising budgets to try to obtain a
more effective response to your campaigns. View your advertising spending patterns
and resulting cumulative sales pictorially.
3. Once you have maximized your sales with the current budget allocation, try some
strategic increases in advertising expenditure. Be prepared to defend your
recommendations to the group Financial Controller.
4. Alter the minimum, maximum, and “plus-20” market share estimates. Observe the
effects on recommended advertising expenditures. Do the outcomes change your
recommendations to your boss?
5. Use your findings in Questions 1 through 4 above to write a comprehensive report to
your boss. Develop a coordinated strategy to overcome the two key areas of concern
(positioning and advertising) and present it in your report.
Answer:
The input screen for the ADBUDG model is shown below. In the “Advertising Project” section
ADVERTISING RESPONSE FUNCTION
The advertising budget screen is then used to enter various quarterly patterns for advertising
expenditures. The output screen for equal quarterly expenditures of $100,000, along with the
PROFIT ANALYSIS SPRING
SUMME
R
FALL
WINTER
One alternative advertising expenditure pattern is $125,000, $125,000, $125,000, and $25,000.
This yields a higher profit contribution (without spending more in total annually on advertising),
as shown below:
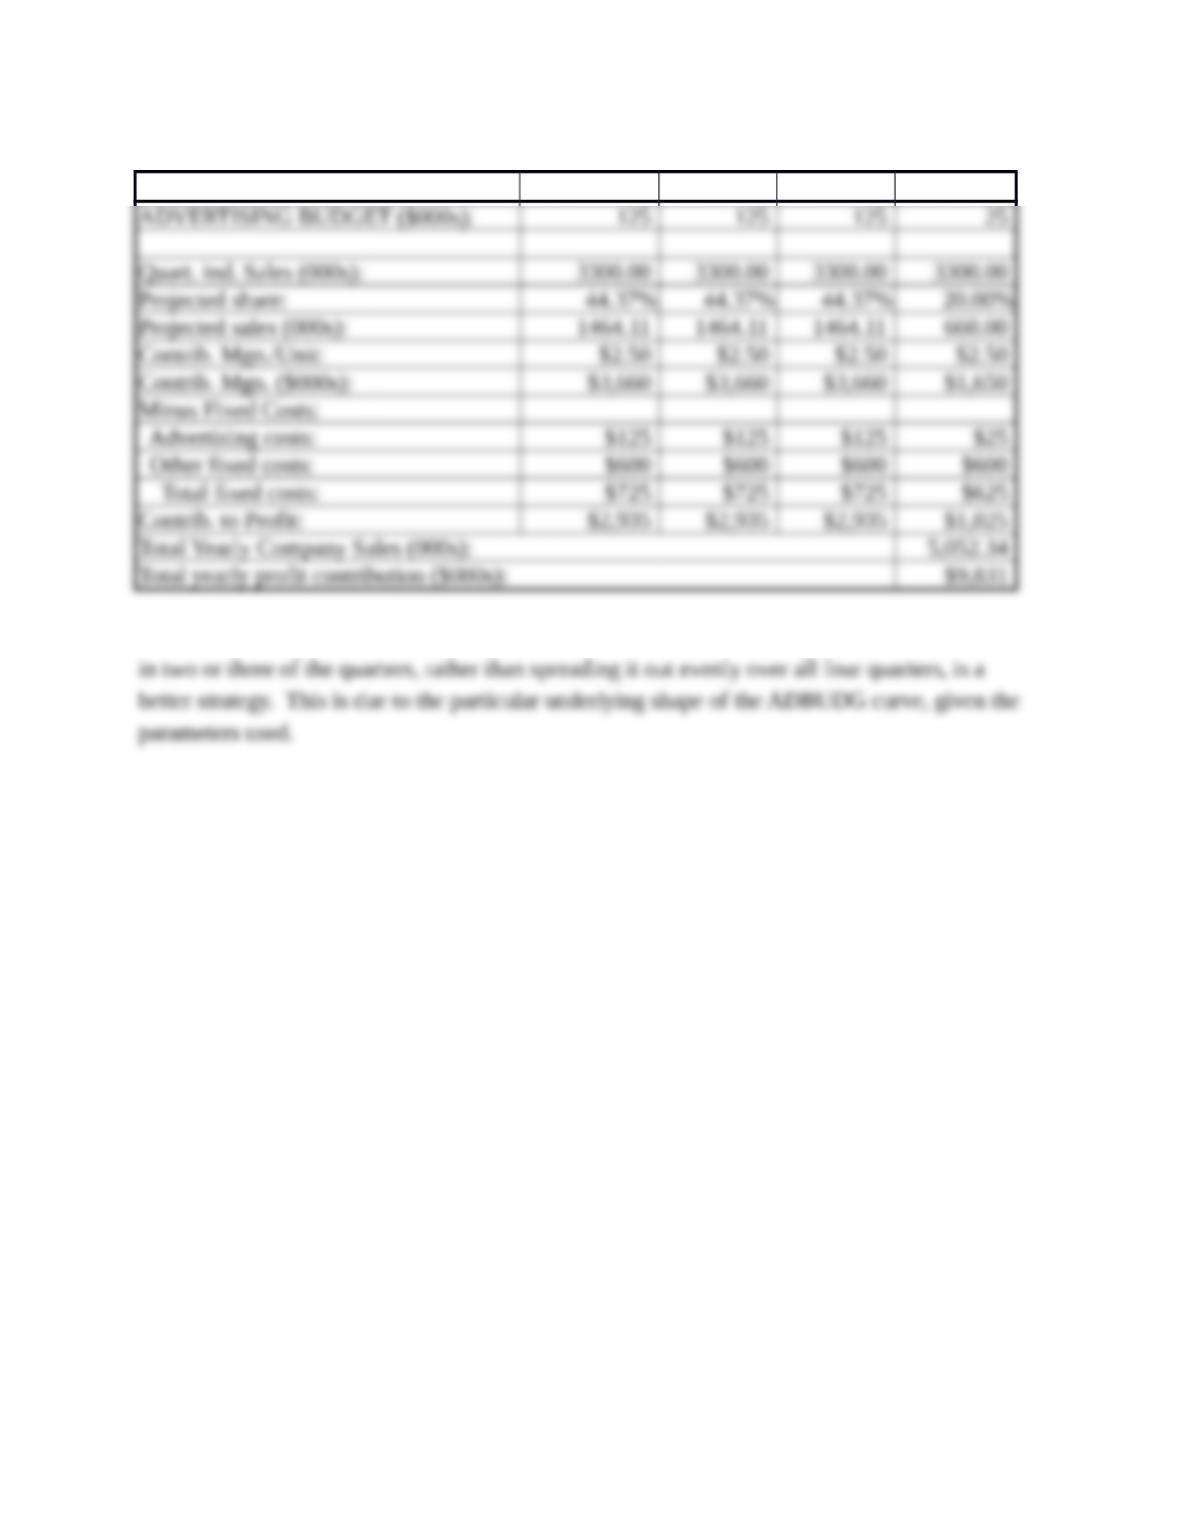
PROFIT ANALYSIS SPRING SUMMER FALL WINTER
In fact, with a little experimentation, the student will find that bunching the advertising allocation