AT&T Magicphone PFC Discussion Questions
1. Using the estimates provided by the experts at Bell Labs in the Delphi probe, what is the
most likely industry sales potential for integrated business communications systems?
Provide a 95% confidence interval for your industry sales estimate. (Hint: use the
Appendix at the end of this case.) Carefully interpret what the confidence interval
means.
Answer:
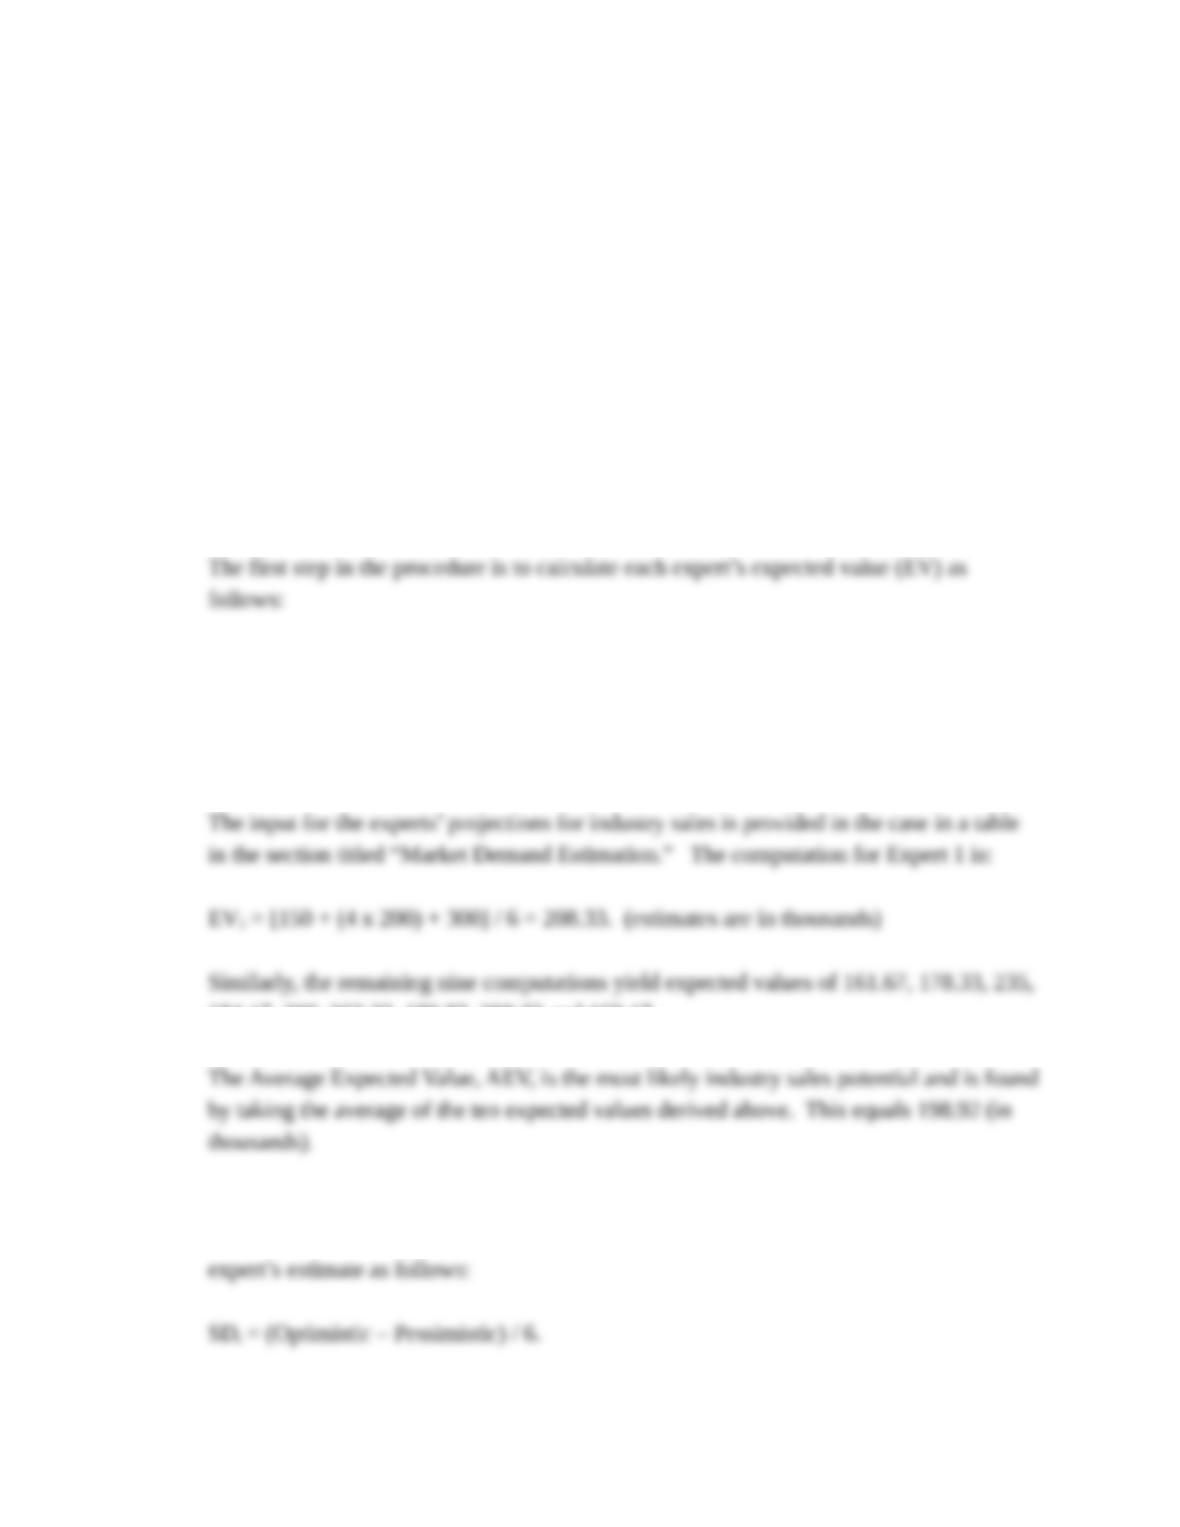
(a) The solution to this question makes use of the Delphi procedure outlined in the appendix
to the case.
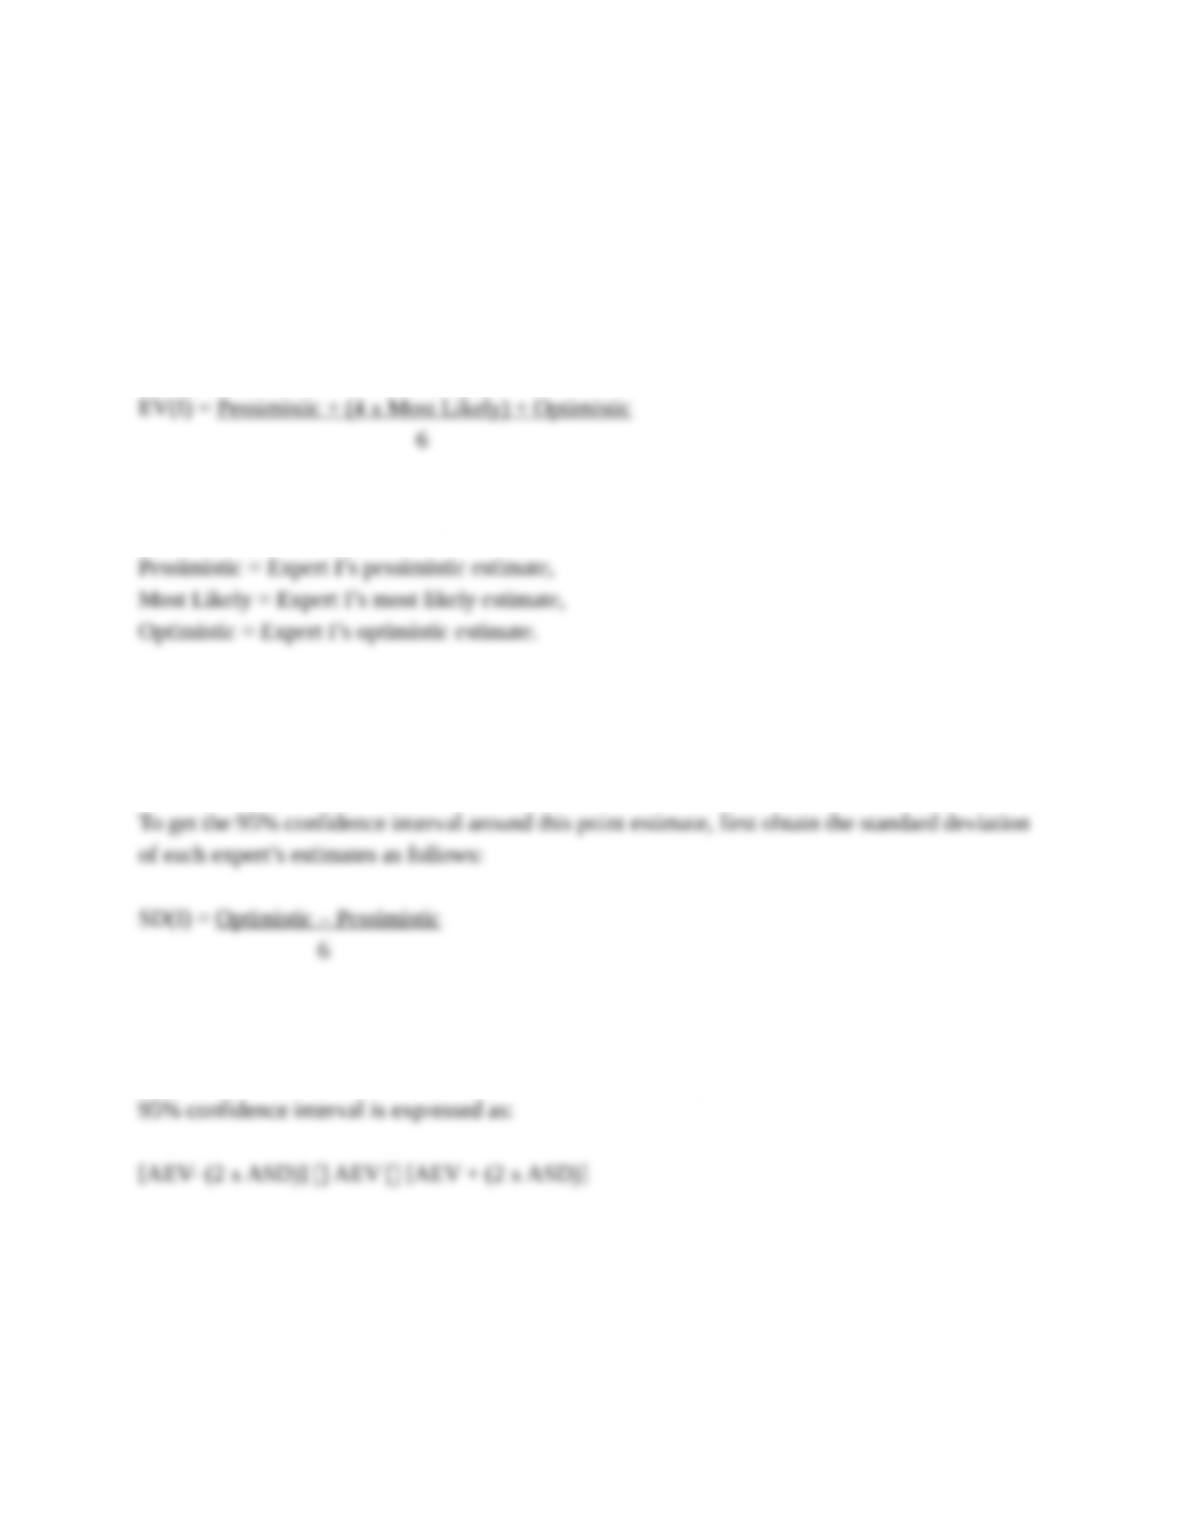
EVi = [Pessimistic + (4 x Most Likely) + Optimistic] / 6,
where Pessimistic, Most Likely, and Optimistic are Expert i’s three estimates
respectively.
184.17, 200, 263.33, 180.83, 208.33 and 169.17.
(b) To get the 95% confidence interval for the industry sales estimate, refer again to the
Delphi procedure in the appendix to the case. First, obtain the standard deviation of each
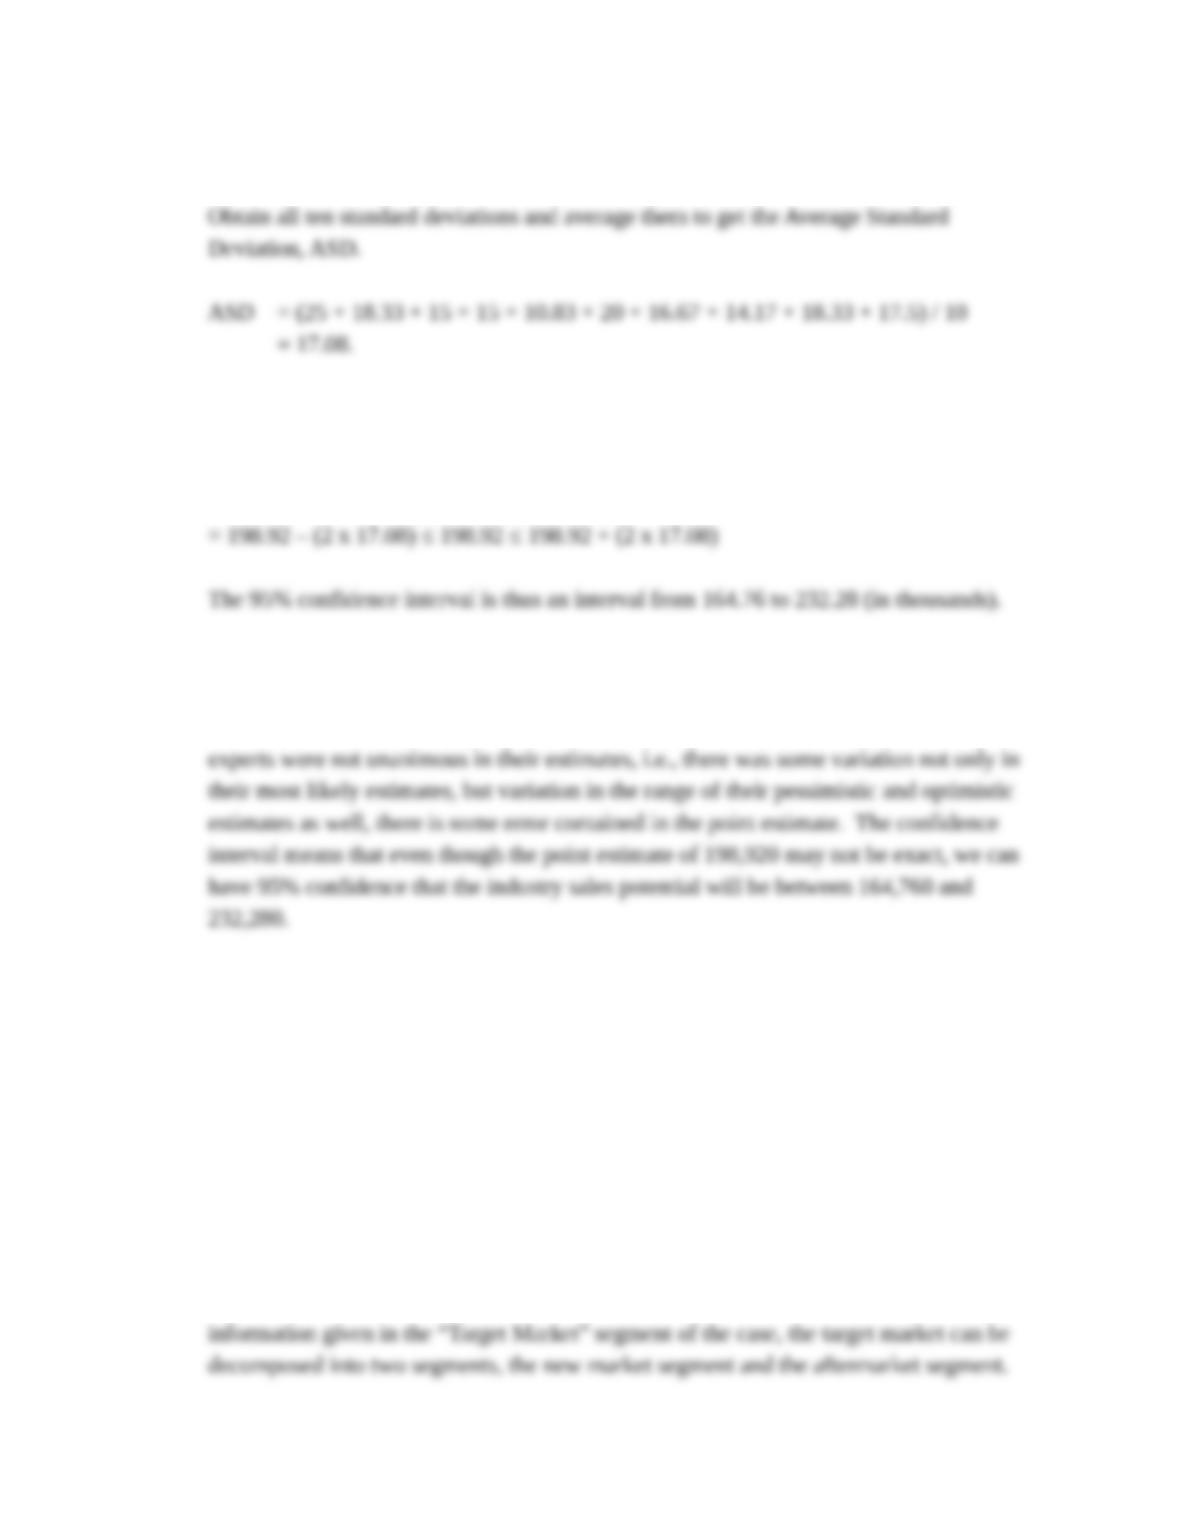
For Expert 1, SD1 = (300-150) / 6 = 25.
The 95% confidence interval is then expressed as:
[AEV – 2 x ASD] ≤ AEV≤ [AEV + 2 x ASD]
(c) Confidence interval interpretation: Using the Delphi approach to assessing industry sales
potential for integrated business communications systems, estimates from a panel of ten
experts produced an average expected sales potential of 198,920 units. Because the
2. What are the relative positions of the AT&T Magicphone and its major competitors on
the two most important attributes, convenience and productivity? Based on the
research indicating ideal brands for the aftermarket customers and new customers,
which are Magicphone’s most serious competitors (in each segment and overall)?
Answer:
(a) This question can be answered using the PERCEPTOR model of the Toolbox. According to
Also given in the case are the relative sizes of the two segments, 60% and 40%
SITUATION ANALYSIS — FOUR COMPETITORS IN INDUSTRY
SIZE OF
SEGMENT
ATTRIB. 1 ATTRIB. 2 REL. TO
MARKET
IDEAL BRANDS BY SEGMENT
(b) Based on the research indicating ideal brands for the aftermarket and new customers, we
can assess which are the most serious competitors to Magicphone using the
PERCEPTOR output provided below.
BRAND SHARE IN SHARE IN SHARE IN TOTAL
SEG. 1 SEG. 2 SEG. 3 MARKET SHARE
Based on this output, Magicphone PFC should achieve an 11.06% share of the market, 14.62%
of the aftermarket segment and 8.68% of the new market segment. The most serious competitor
overall is Executone (Brand D) with a 41.59% share of the market, followed by TIE (Brand C)
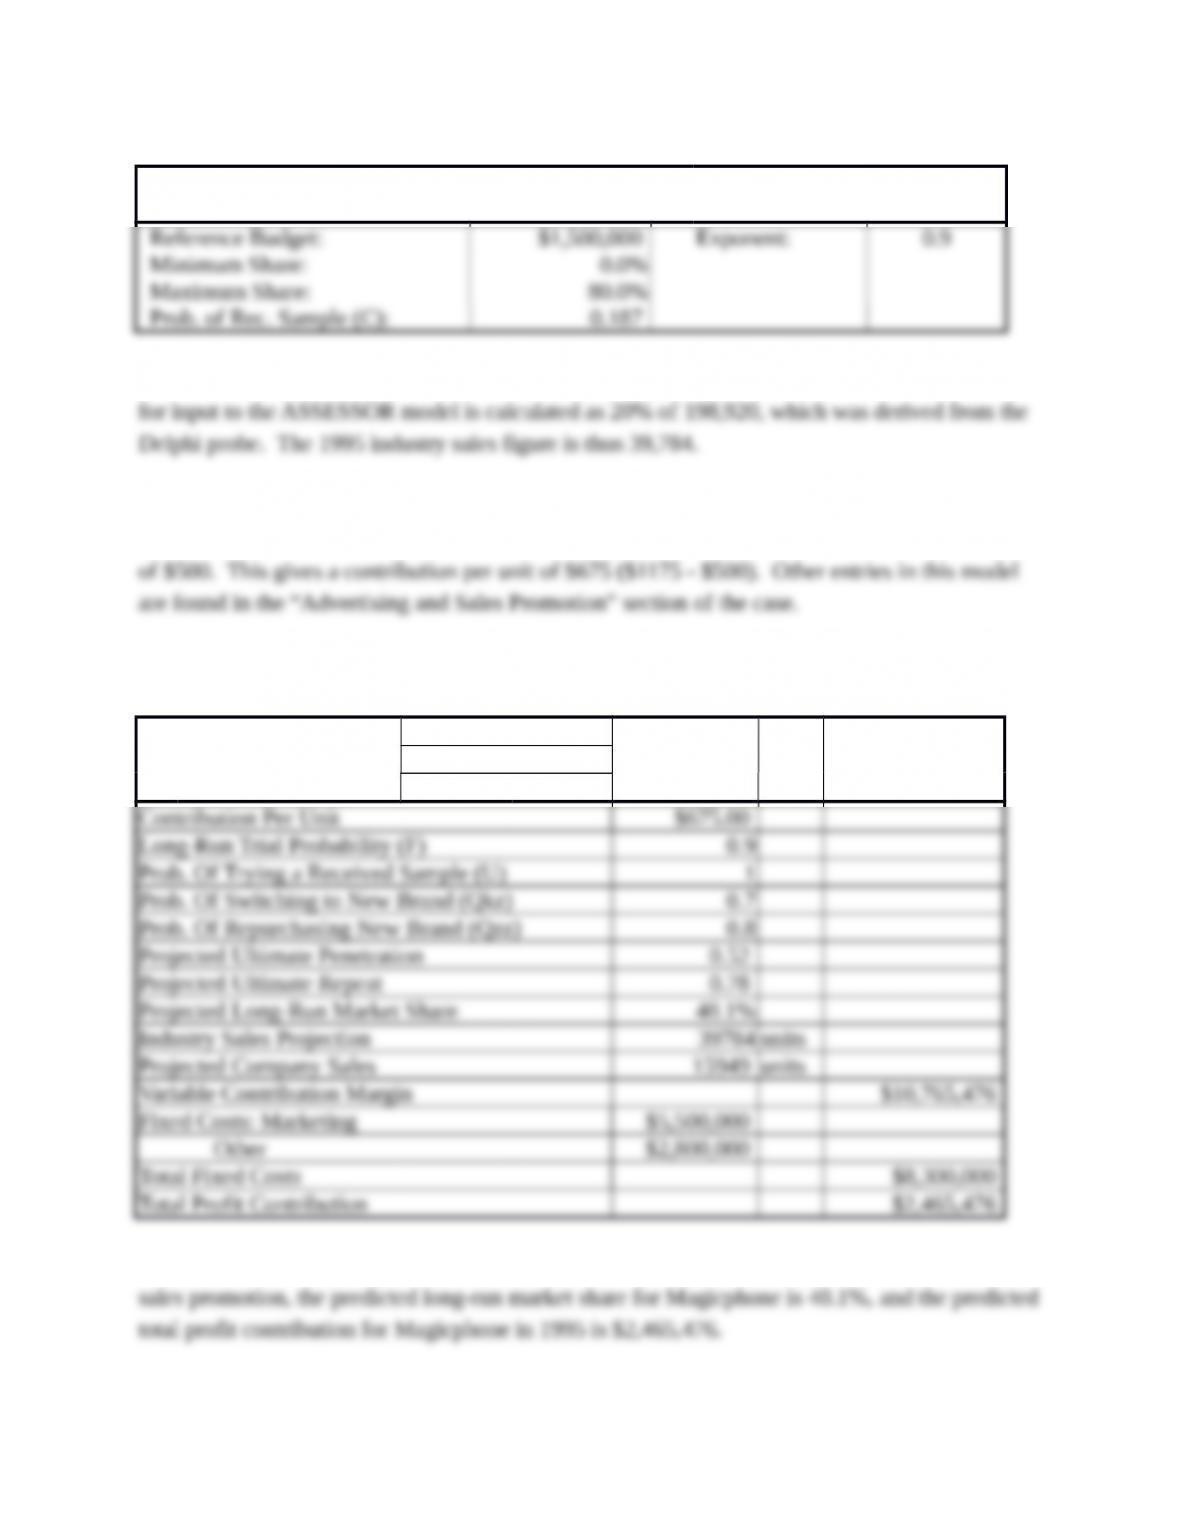
3. Assume that total industry sales in 1995 are expected to be 20% of the industry sales in
1999 (as projected by the experts in the Delphi probe). Use the ASSESSOR model to
develop a marketing mix for the Magicphone. Specifically, make recommendations for
advertising, distribution, and sales promotion budgets. What long-run market share
and profit contribution do you predict for Magicphone? Perform a sensitivity analysis:
observe the effect on long-run market share of slight variations (perhaps 10% or 15%
in each direction) in each of the three budgets.
Answer:
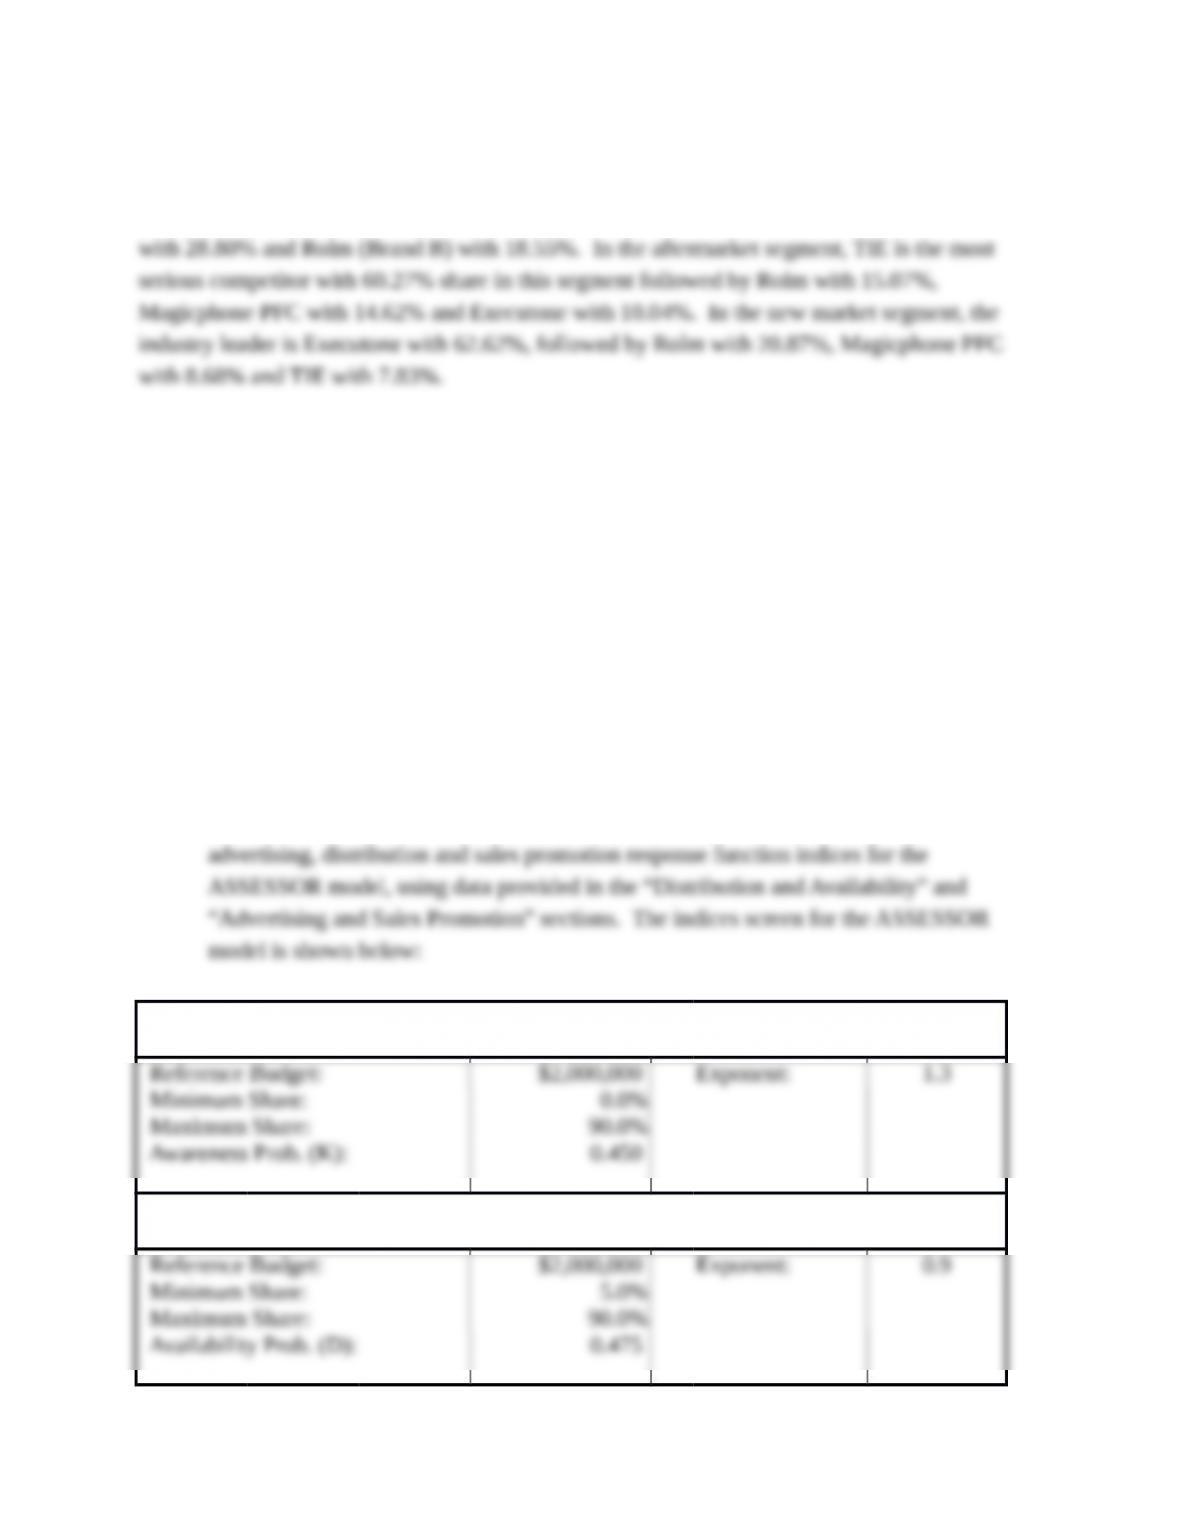
(a) Use the ASSESSOR model to make recommendations on the promotion budgets,
assuming that total industry sales in 1995 are expected to be 20% of the industry sales in
1999 (as projected by the experts in the Delphi probe). The first step is to set the
SETTING THE ADVERTISING RESPONSE
FUNCTION
SETTING THE DISTRIBUTION RESPONSE
FUNCTION
SETTING THE SALES PROMOTION RESPONSE
FUNCTION
The next step is to input the data for the ASSESSOR model itself. The 1995 industry sales figure
Contribution per unit was calculated as follows. Initial selling price of the Magicphone PFC is
given as $1175 in the “Magicphone PFC” section of the case, along with estimated variable costs
The ASSESSOR model screen is shown below:
ASSESSOR MODEL Advertising: $2,000,000 K: 0.450
Distribution: $2,000,000 D: 0.475
Sales Promo.: $1,500,000 C: 0.400
Using the initial budget figures of $2 million for advertising and distribution and $1.5 million for
Different recommendations can be made for the advertising, distribution and sales promotion
budgets by entering alternative figures into the input cells and observing the effect on the other
output variables such as market share and total profit contribution. One possible recommended
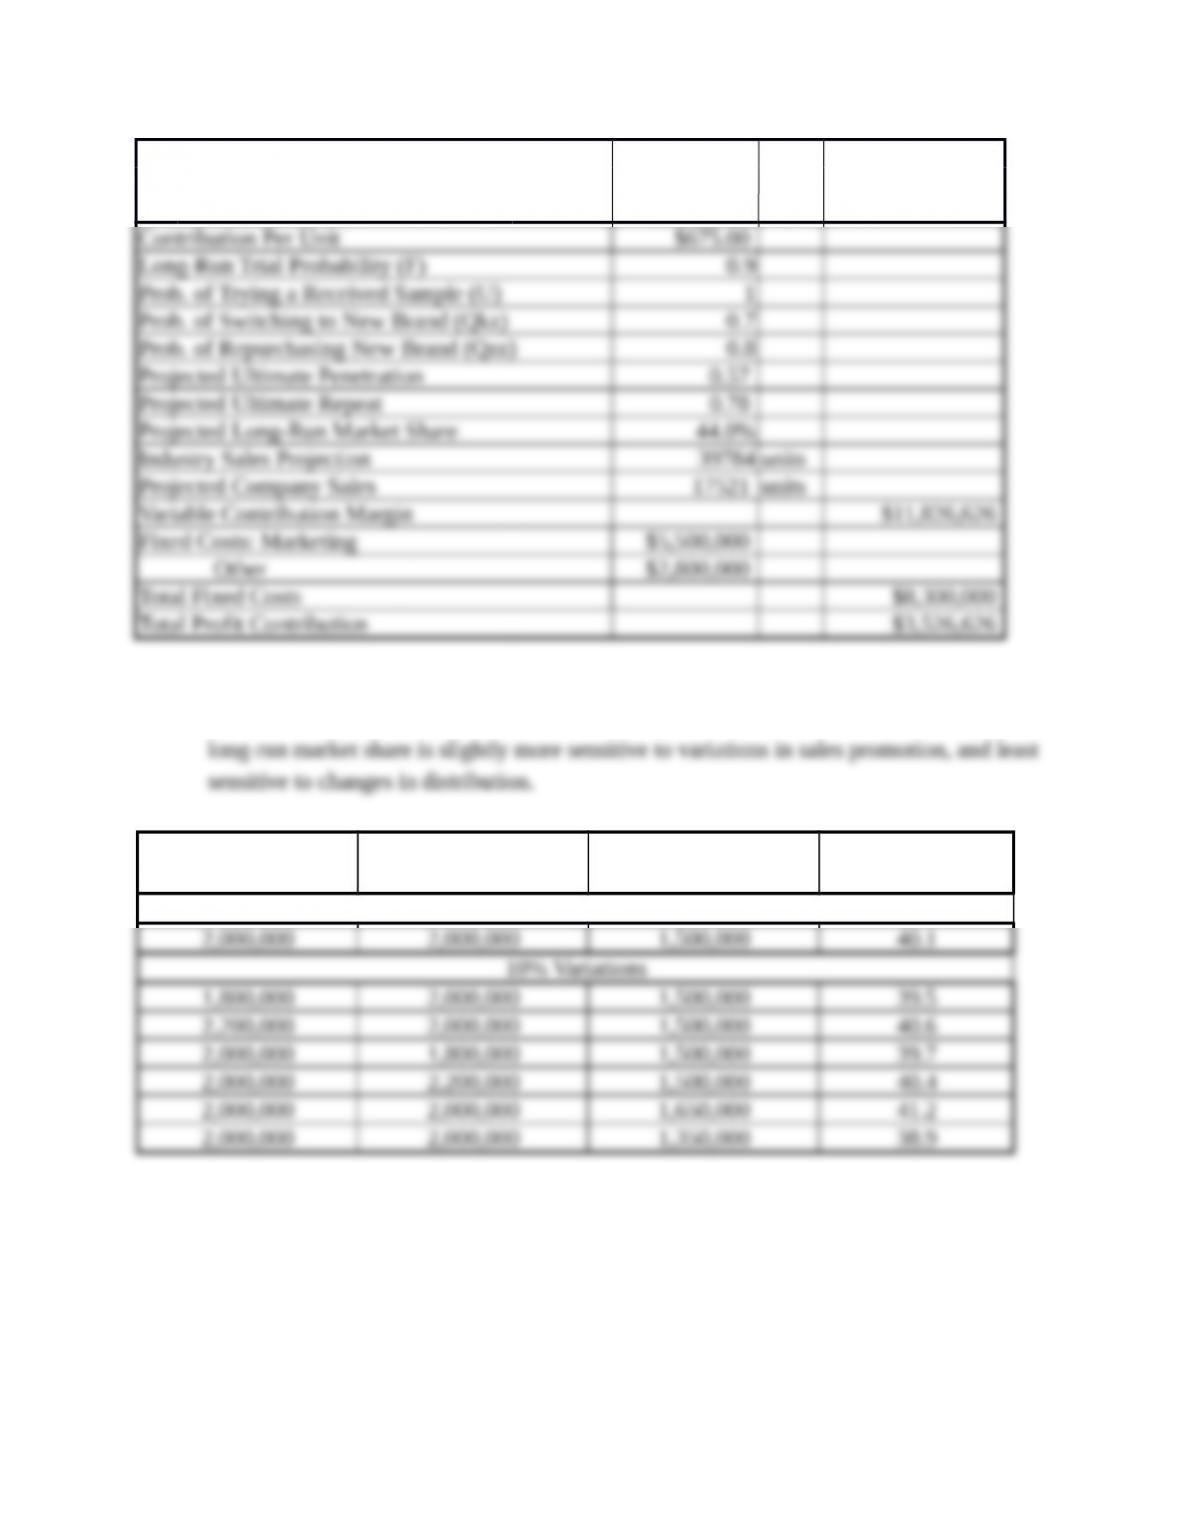
ASSESSOR MODEL Advertising: $1,200,000 K: 0.306
Distribution: $1,500,000 D: 0.420
Sales Promo.: $2,800,000 C: 0.509
(b) The chart below shows a sensitivity analysis on long-run market share with 10%
variations in each direction for each of the three promotion budgets. It shows that,
Advertising Distribution Sales Promotion L.R. Mkt. Shr.
(%)
Original
4. Use the PRICING model to determine the effect of sales on the Magicphone on AT&T’s
existing fax machines. Use quantity and fixed-cost estimates from the ASSESSOR
analysis in Question 3. How sensitive are these effects to changes in Magicphone price?
(Try a range of price around the initially proposed price.) Would you be concerned
about cannibalization of existing products by the Magicphone? Why or why not?
Answer:
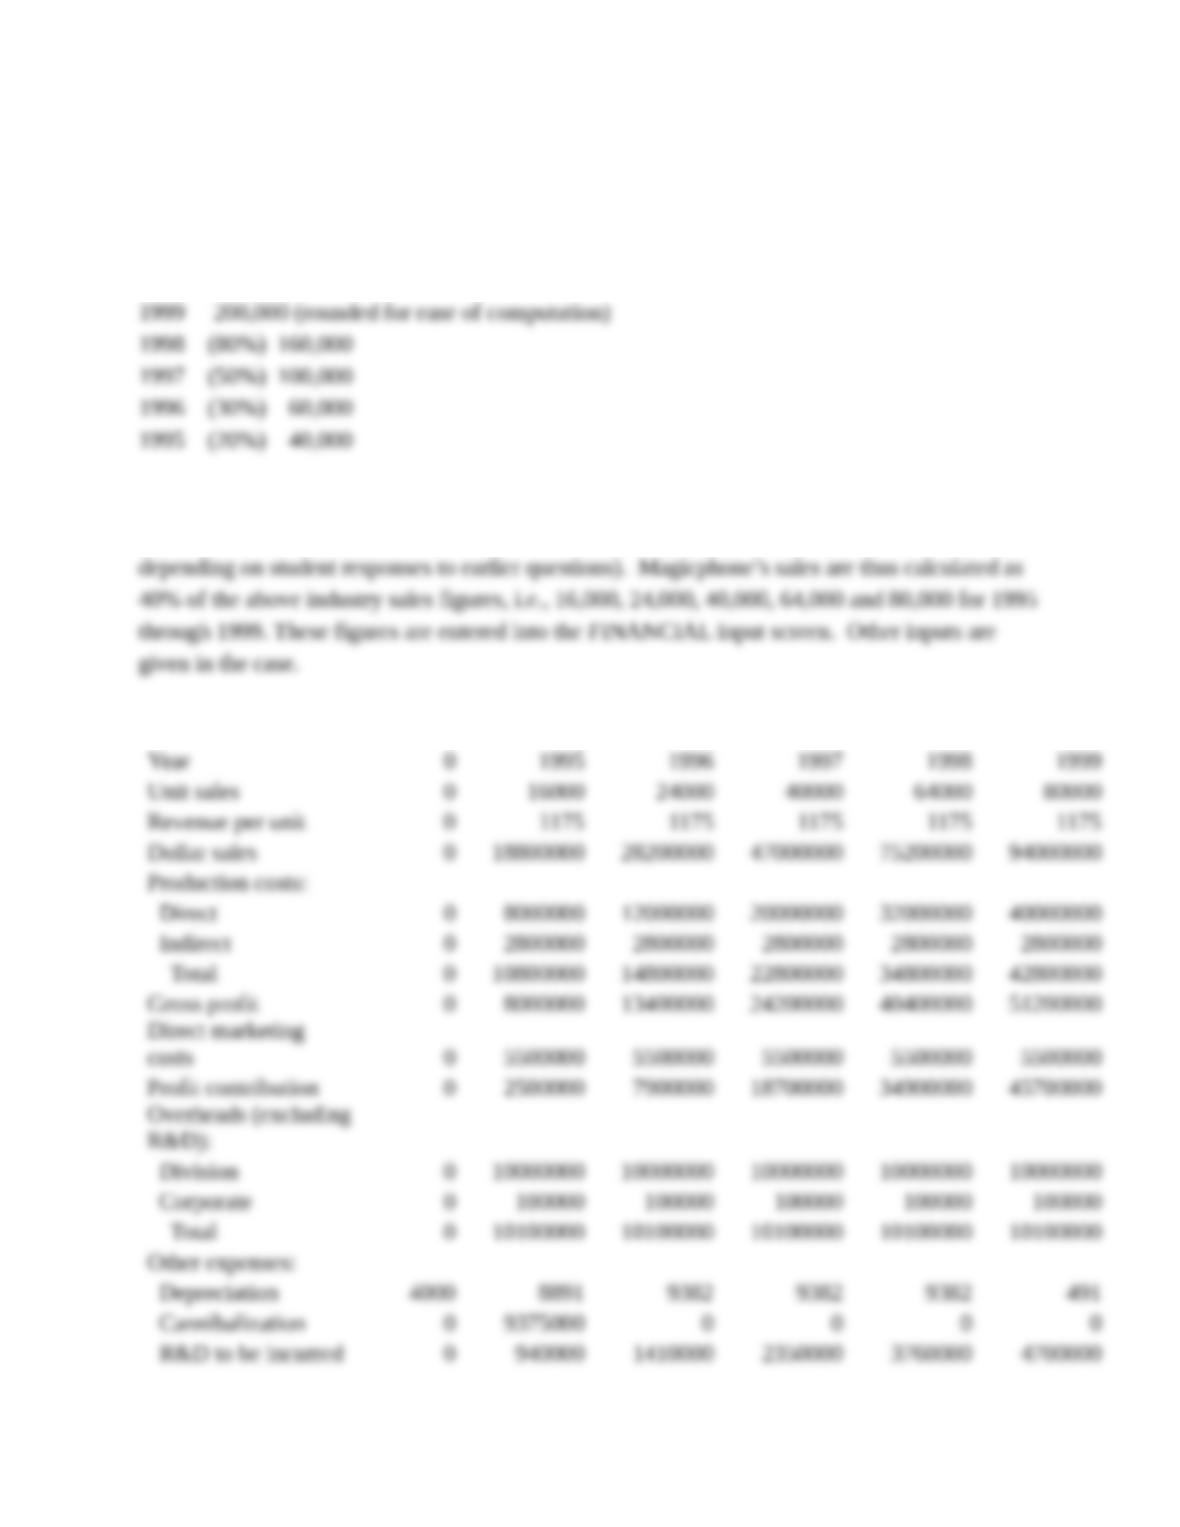
First, compute the industry sales for the five year period as follows:
Next, compute Magicphone’s estimated sales using previously derived market share estimates (in
this solution, 40% market share will be assumed for Magicphone; others are acceptable
FINANCIAL WORKSHEET
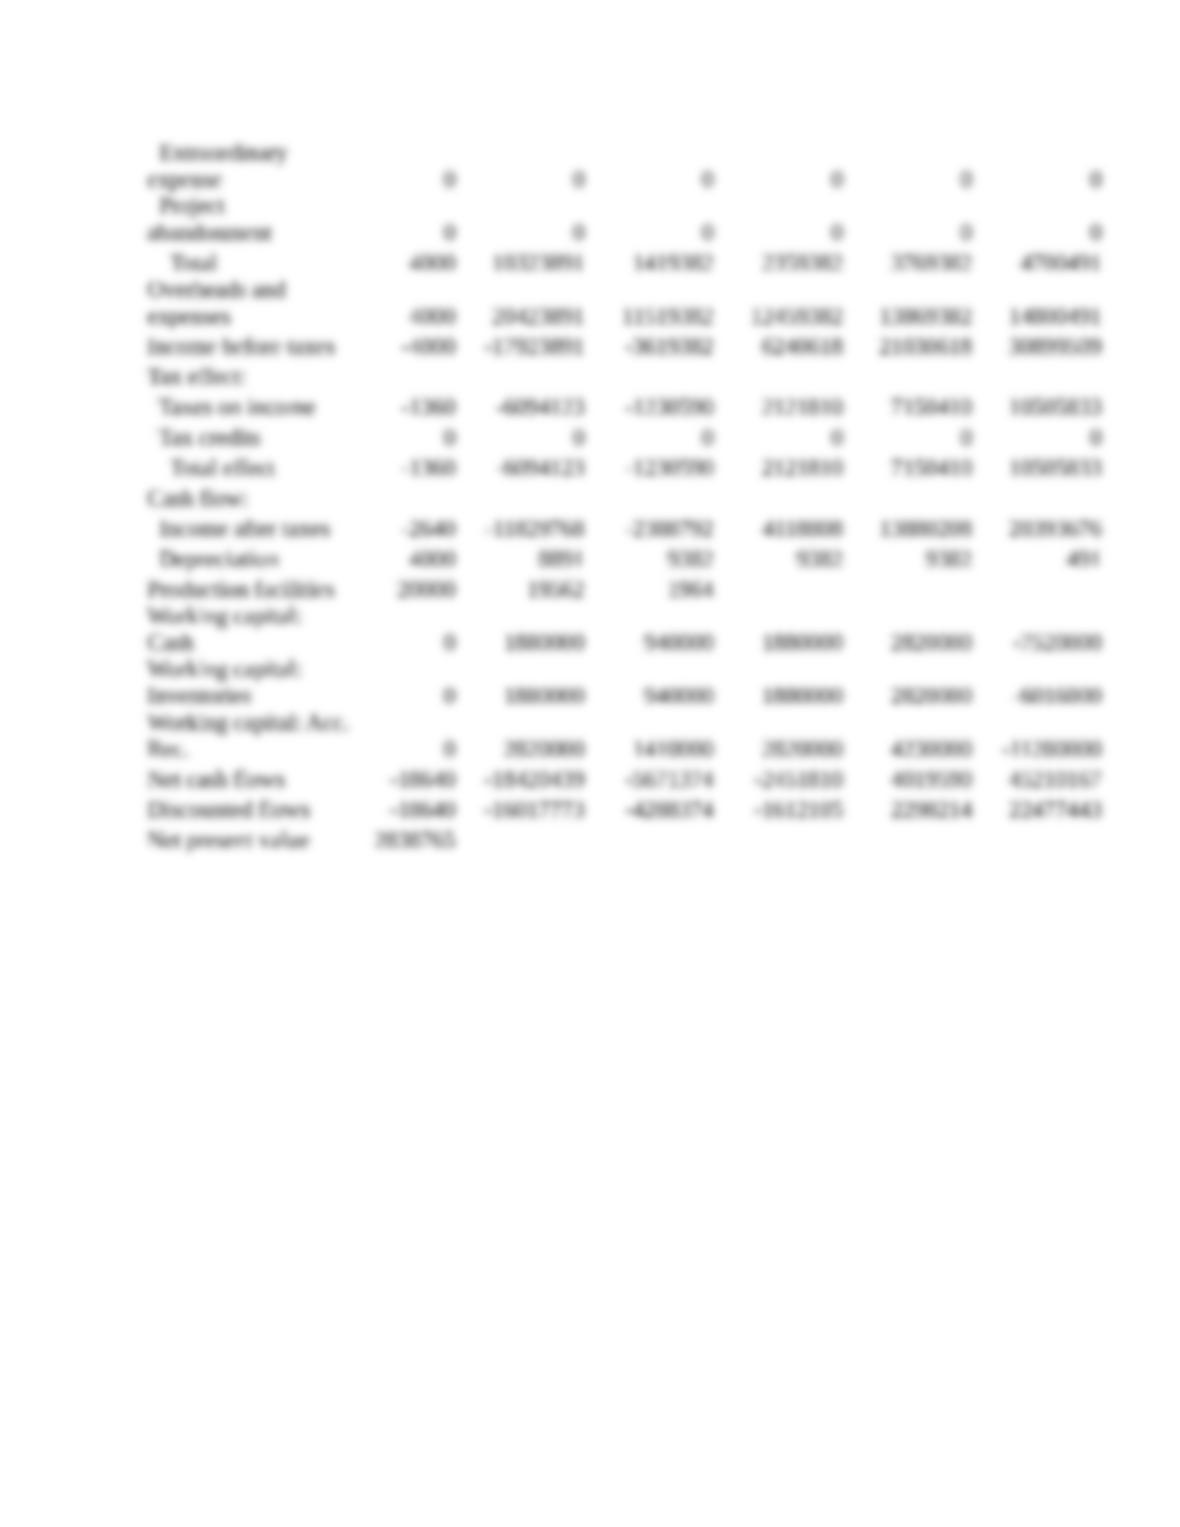
Net present value is calculated at $2,838,765, and the payback is during Year 4 (1998).
5. Assume that the growth rates in industry sales are as follow:
1995 industry sales = 20% of projected 1999 industry sales
1996 industry sales = 30% of projected 1999 industry sales
1997 industry sales = 50% of projected 1999 industry sales
1998 industry sales = 80% of projected 1999 industry sales
Also, assume that the Magicphone obtains the long-run market share (as projected by
ASSESSOR in the previous question) in 1995 and maintains that level through 1999.
Develop a five-year financial projection for the Magicphone, using the FINANCIAL
model. Provide estimates of discounted cash flow and payback period. How profitable
a product is it for AT&T?
Answer:
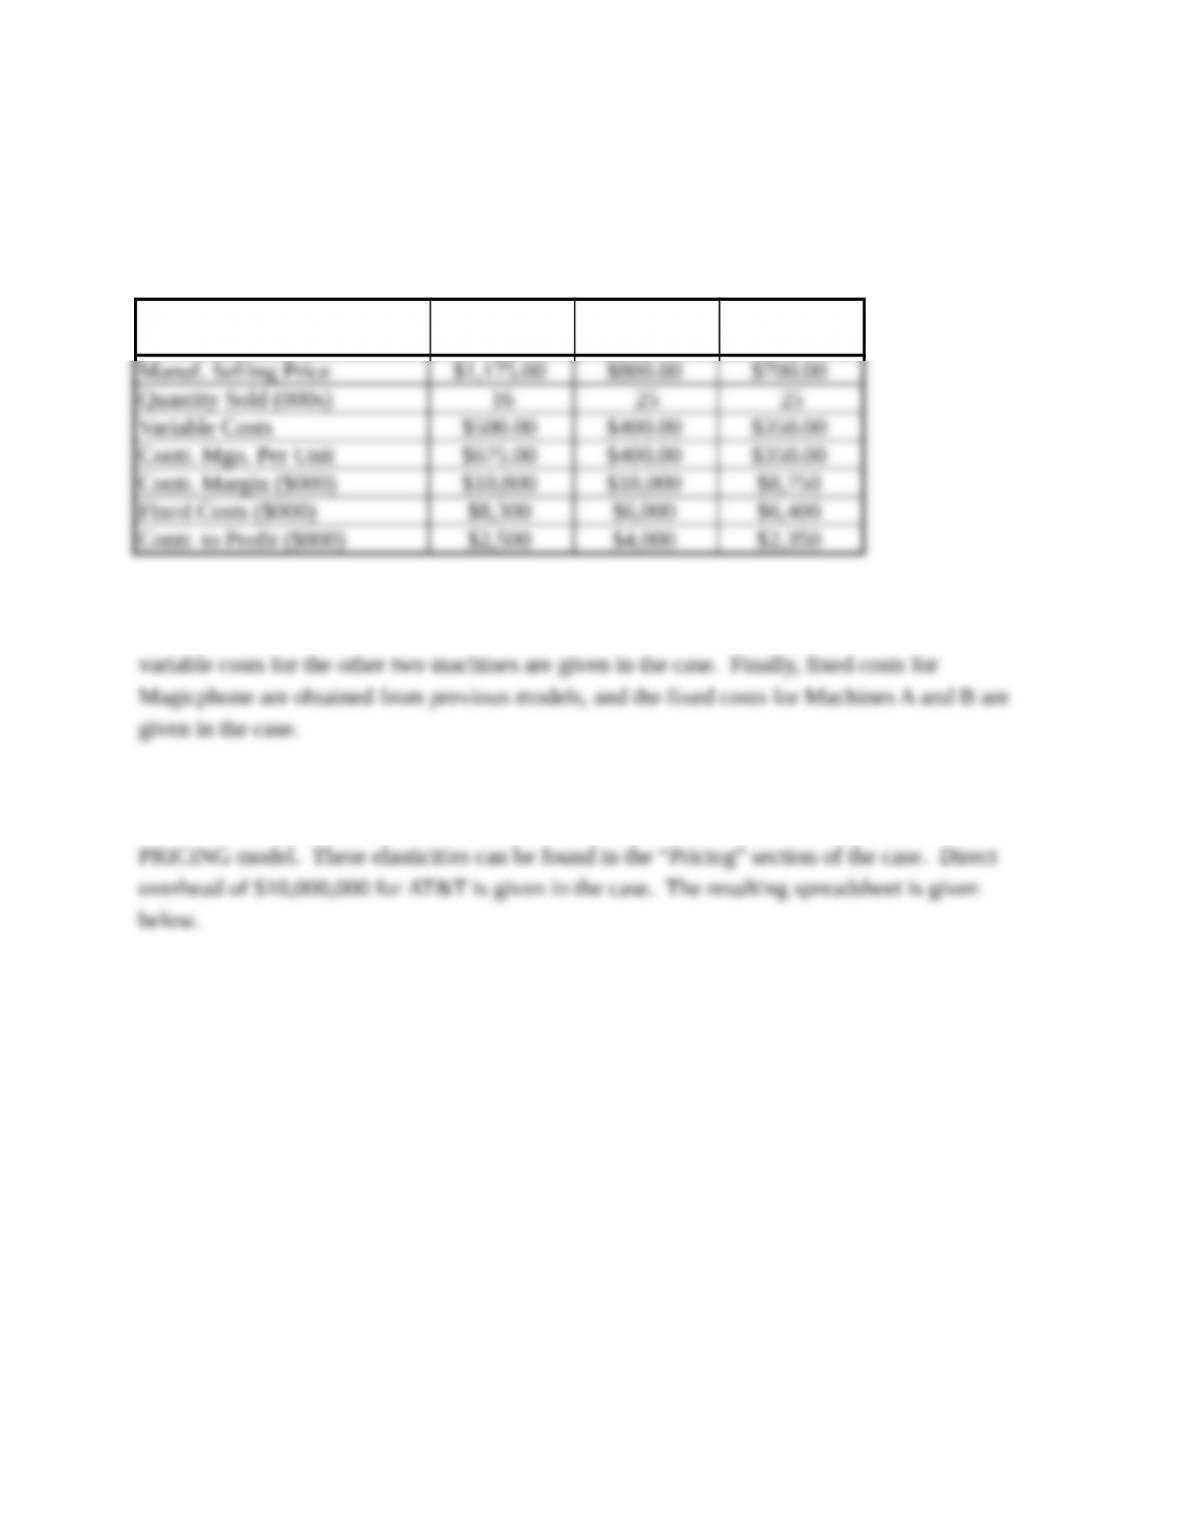
(a) The input data for the PRICING model are found in the case in the “Pricing” section.
The price for the Magicphone has been given previously as $1175. The prices for the old
fax machines A and B are given as $800 and $700. The input screen for the PRICING
model is given below.
SPREADSHEET 1 NEW
BRAND
OLD
BRAND A
OLD
BRAND B
The quantity sold for the Magicphone, 16,000, is based on the ASSESSOR model input for 1995
developed in Question 3. Variable cost for Magicphone is also derived in Question 3, and the
In addition to the inputs described above, the elasticity of demand for Magicphone and the
cross-elasticities between Magicphone and the two old machines need to be entered in the
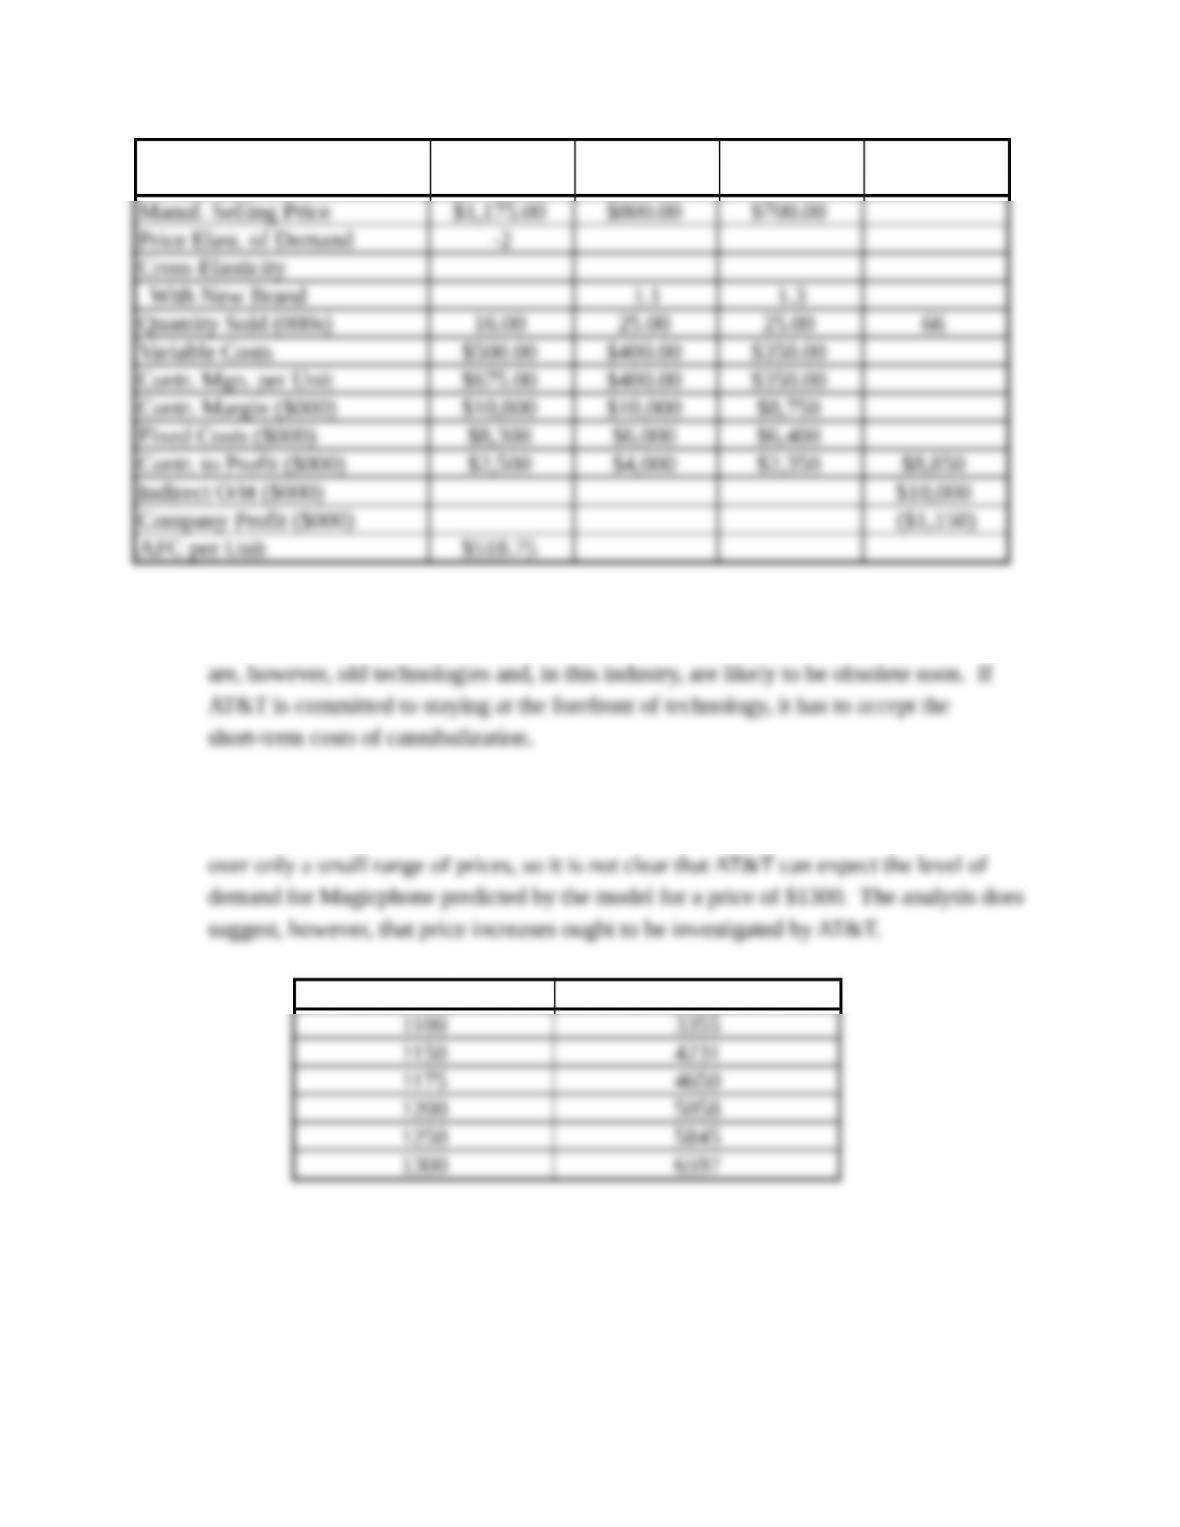
SPREADSHEET 2 NEW
BRAND
OLD BRAND
A
OLD BRAND
B
COMPANY
TOTALS
(b) Cannibalization is definitely an issue, since the Magicphone is a substitute for the older
models, and Brand A provides a nice contribution to company profits. Brands A and B
(c) Sensitivity analysis shows that company profitability is influenced by modest changes in
price (see table below). Keep in mind that the elasticity estimates are likely to be useful
Magicphone Price ($) Company Profit ($000)
Appendix: Analysis of Delphi Estimates
Each industry expert provided three estimates of industry sales potential for 1999 in the Delphi
probe: a pessimistic, most likely, and optimistic estimate. These judgments can be combined
into a point estimate and a confidence interval of industry potential that reflect the combined
judgments of all the experts.
First, to obtain the point estimate of industry sales potential, calculate each expert’s expeceted
value as follows:
where EV(I) = Expert I’s expected value (I can take on any value from 1 to N, where N is the
number of experts),
Then find AEV, the average expected value over all the experts, to obtain the point estimate of
industry sales potential. This point estimate is thus obtained from the combined judgments of all
participating experts.
where SD(I) = standard deviation of Expert I’s estimate.
Calculate the average of the SD(I) to obtain ASD, the average standard deviation. Finally, the