8-23
PROBLEM 8-26A (cont.)
c.
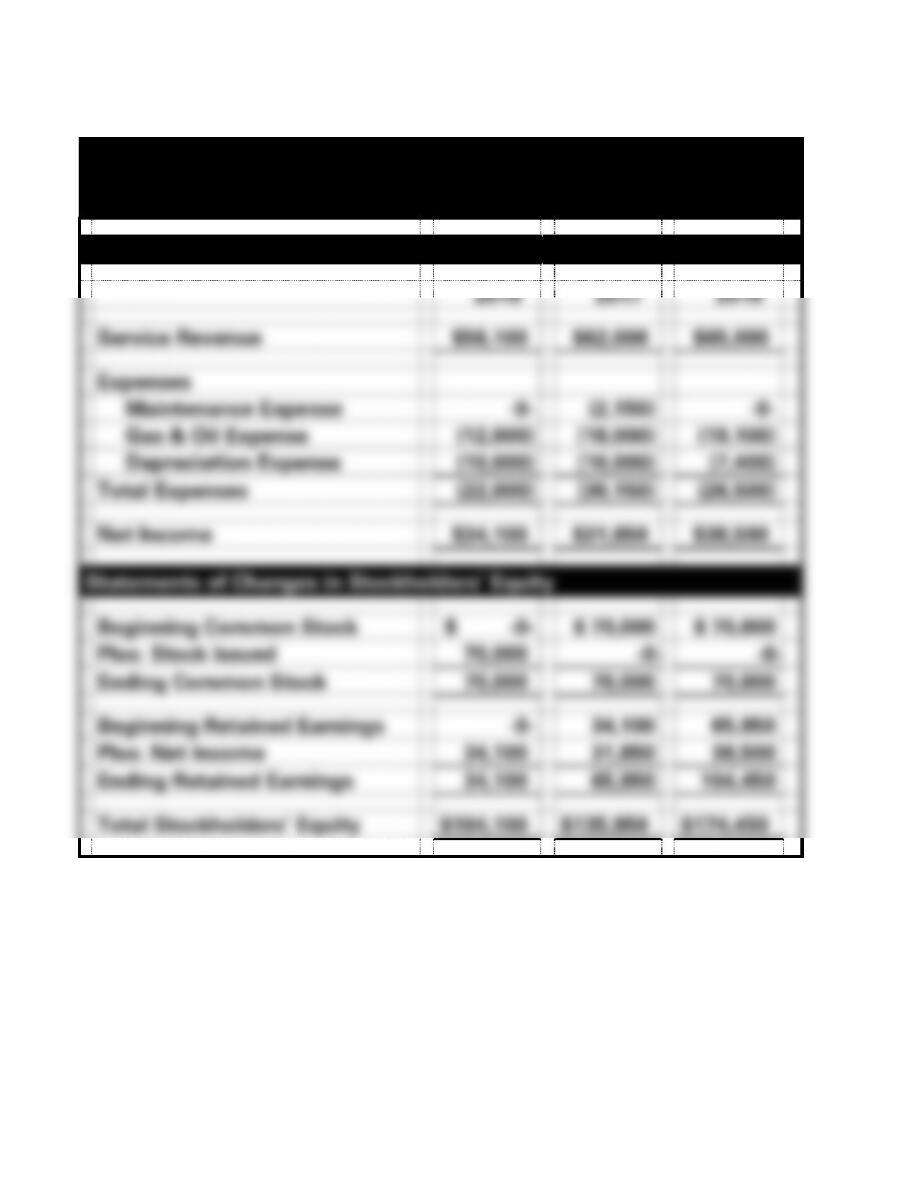
Academy Towing Service
Financial Statements
For the Year Ended December 31
Income Statements
2016
2017
2018
Service Revenue
$56,100
$62,000
$65,000
Expenses
Maintenance Expense
-0-
(2,150)
-0-
Gas & Oil Expense
(12,000)
(18,000)
(19,100)
Depreciation Expense
(10,000)
(10,000)
(7,400)
Total Expenses
(22,000)
(30,150)
(26,500)
Net Income
$34,100
$31,850
$38,500
Statements of Changes in Stockholders’ Equity
Beginning Common Stock
$ -0-
$ 70,000
$ 70,000
Plus: Stock Issued
70,000
-0-
-0-
Ending Common Stock
70,000
70,000
70,000
Beginning Retained Earnings
-0-
34,100
65,950
Plus: Net Income
34,100
31,850
38,500
Ending Retained Earnings
34,100
65,950
104,450
Total Stockholders’ Equity
$104,100
$135,950
$174,450
8-24
PROBLEM 8-26A c. (cont.)
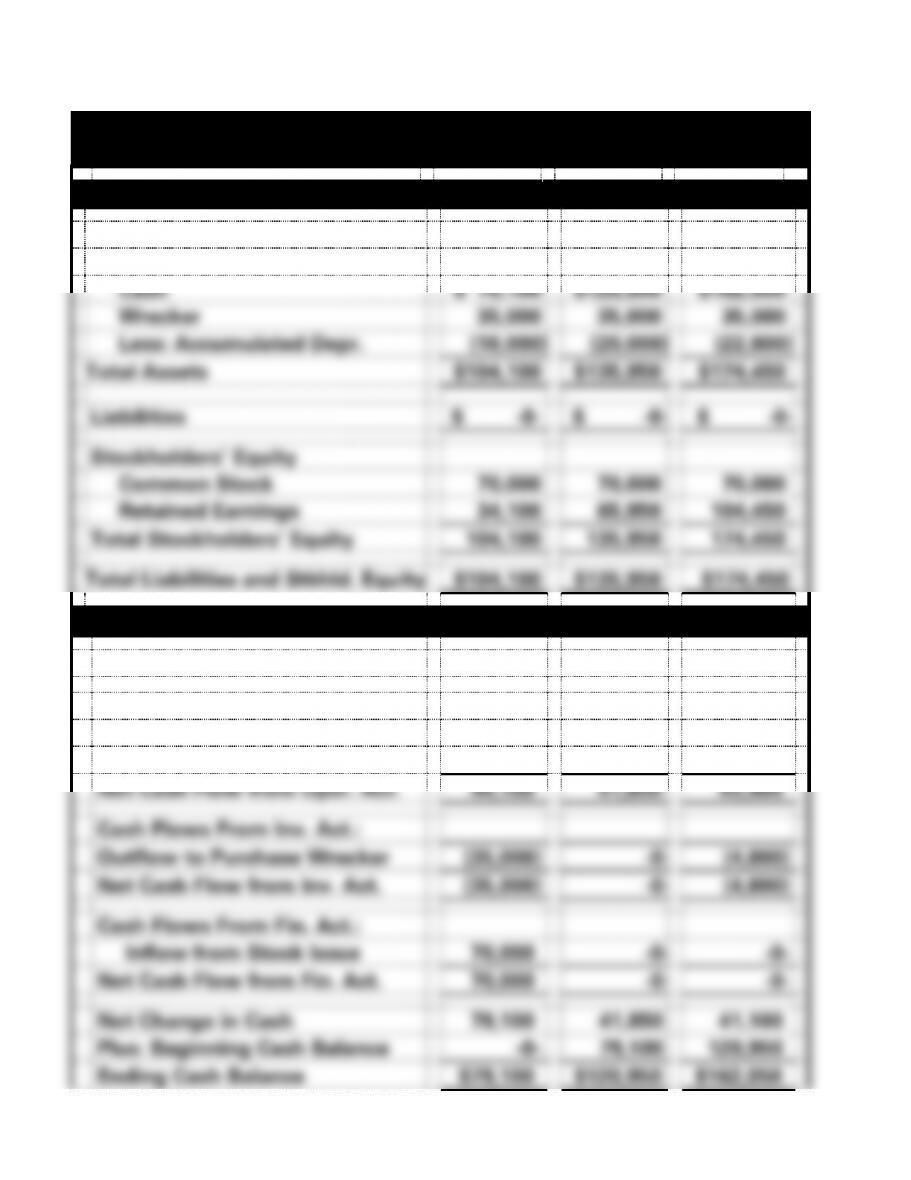
Academy Towing Service
Financial Statements
Balance Sheets as of December 31
2016
2017
2018
Assets
Cash
$ 79,100
$120,950
$162,050
Wrecker
35,000
35,000
35,000
Less: Accumulated Depr.
(10,000)
(20,000)
(22,600)
Total Assets
$104,100
$135,950
$174,450
Liabilities
$ -0-
$ -0-
$ -0-
Stockholders’ Equity
Common Stock
70,000
70,000
70,000
Retained Earnings
34,100
65,950
104,450
Total Stockholders’ Equity
104,100
135,950
174,450
Total Liabilities and Stkhld. Equity
$104,100
$135,950
$174,450
Statements of Cash Flows for the Year Ended December 31
2016
2017
2018
Cash Flows From Oper. Act.:
Inflow from Revenue
$56,100
$62,000
$65,000
Outflow for Expenses
(12,000)
(20,150)
(19,100)
Net Cash Flow from Oper. Act.
44,100
41,850
45,900
Cash Flows From Inv. Act.:
Outflow to Purchase Wrecker
(35,000)
-0-
(4,800)
Net Cash Flow from Inv. Act.
(35,000)
-0-
(4,800)
Cash Flows From Fin. Act.:
Inflow from Stock Issue
70,000
-0-
-0-
Net Cash Flow from Fin. Act.
70,000
-0-
-0-
Net Change in Cash
79,100
41,850
41,100
Plus: Beginning Cash Balance
-0-
79,100
120,950
Ending Cash Balance
$79,100
$120,950
$162,050

8-25
8-26
PROBLEM 8-27A
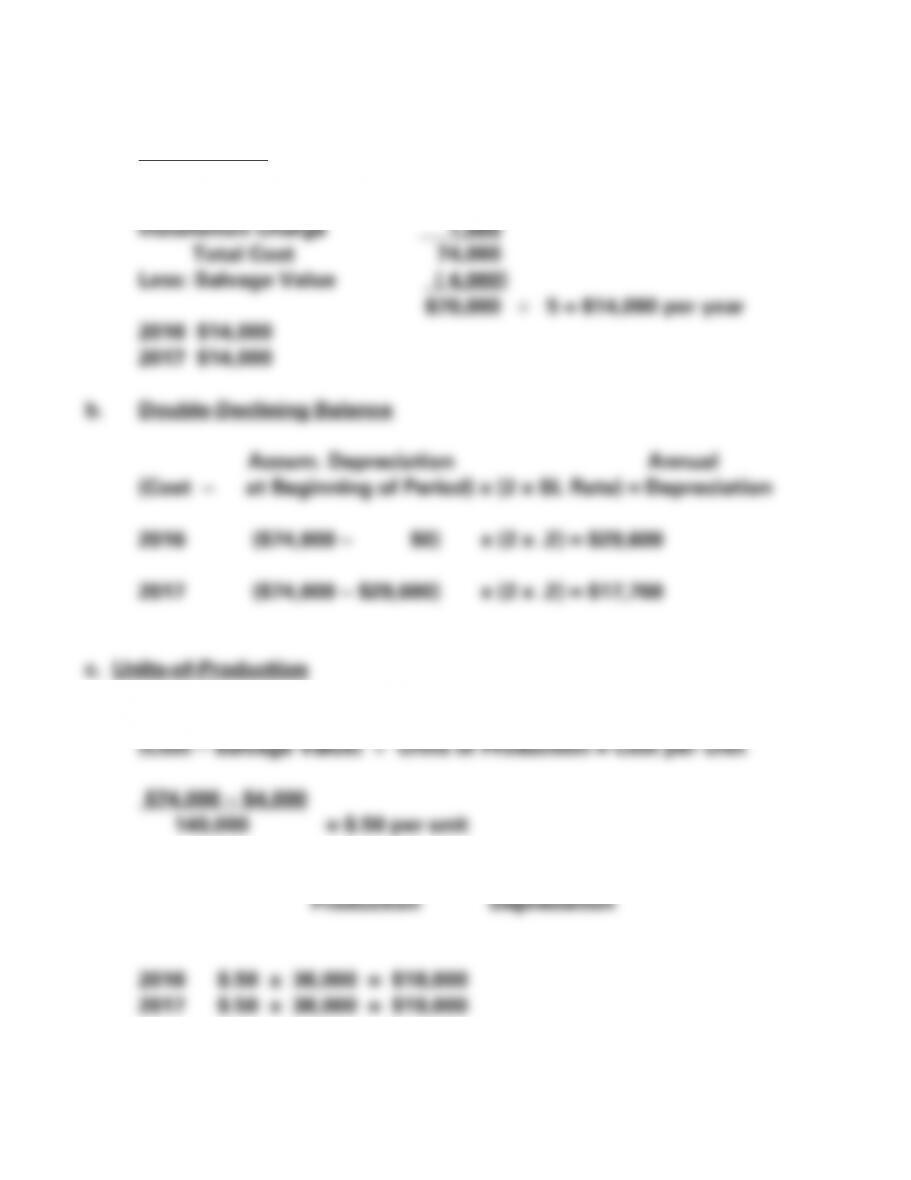
a. Straight-Line
Cost $70,000
Delivery Cost 3,000
1. Total Estimated
2. Cost per Unit x Current Units of = Annual
8-27
PROBLEM 8-27A (cont.)
d. MACRS
Cost x MACRS % = Annual Depreciation
8-28
PROBLEM 8-28A
a. Straight-Line
(Cost − Salvage Value) Useful Life = Annual Depreciation
Year 1 ($40,000 − $5,000) 5 = $7,000 per year
2 7,000
8-29
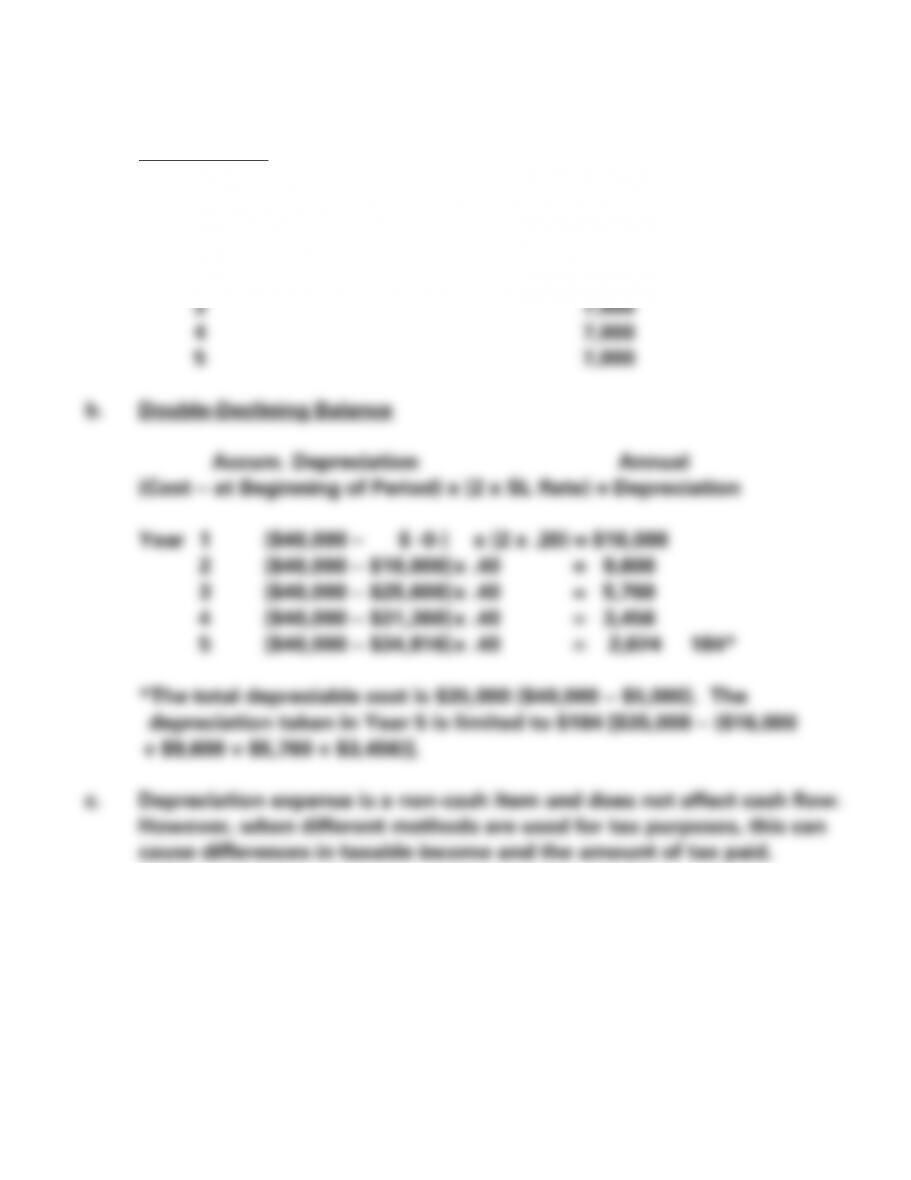
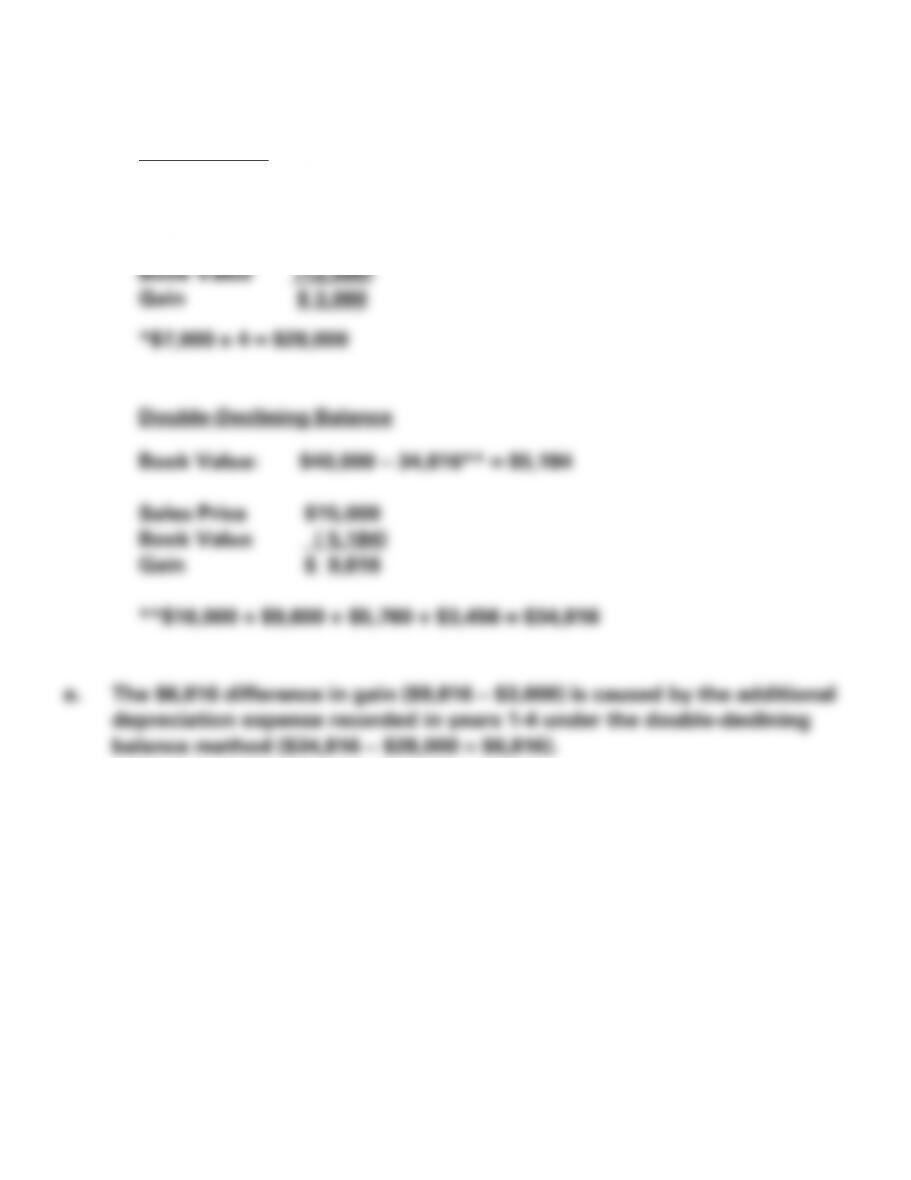
PROBLEM 8-28A (cont.)
d. Straight-Line
Book Value: $40,000 − 28,000* = $12,000
Sales Price $15,000
8-30
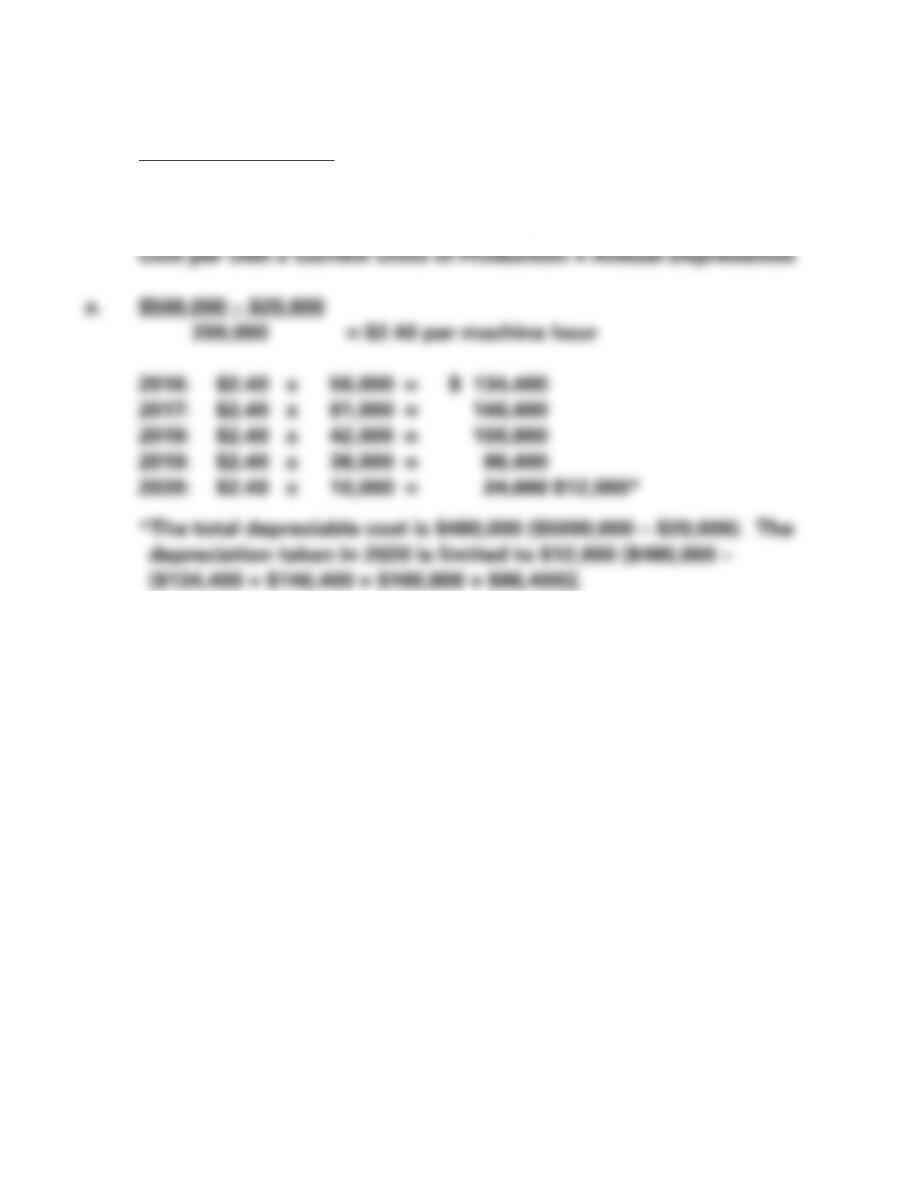
PROBLEM 8-29A
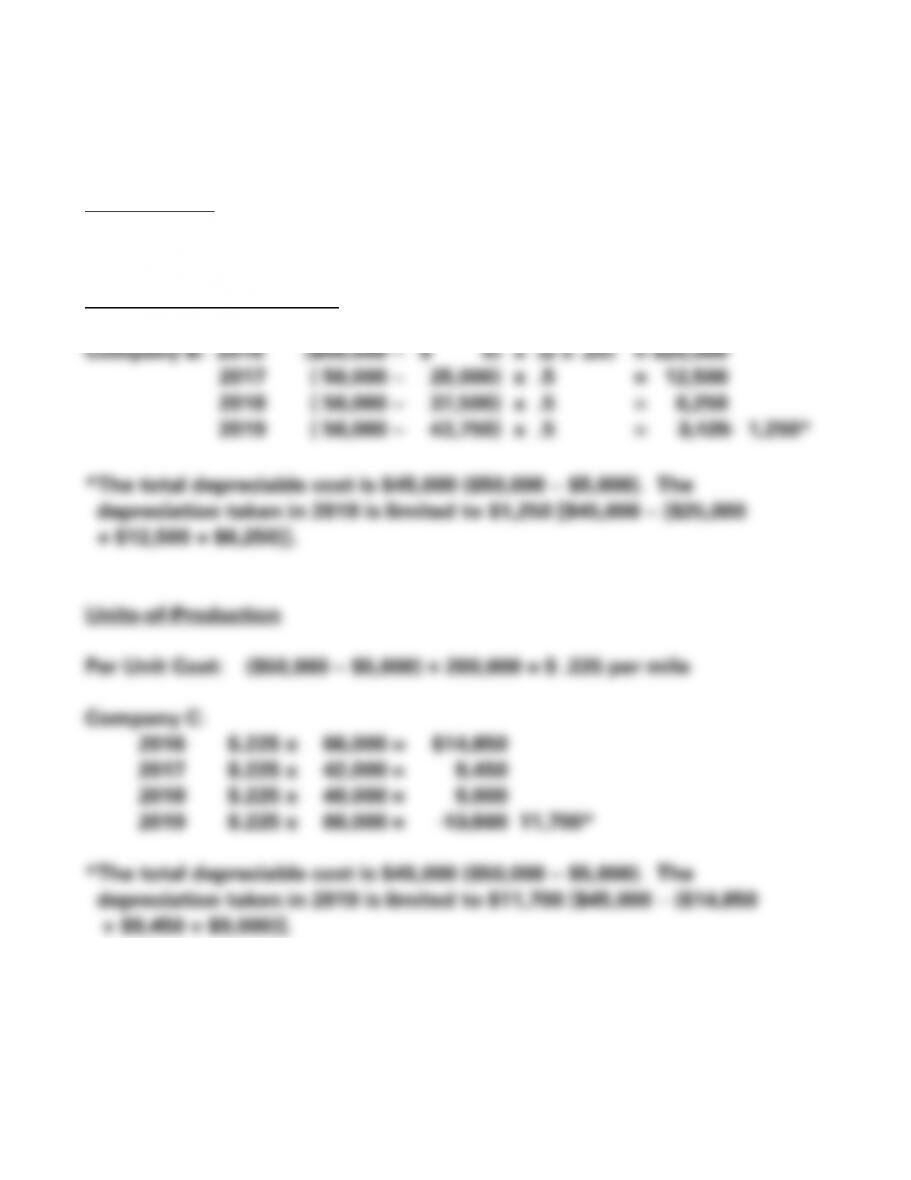
Units-of–Production
Total Estimated
(Cost − Salvage Value) Units of Production = Cost per Unit
8-31
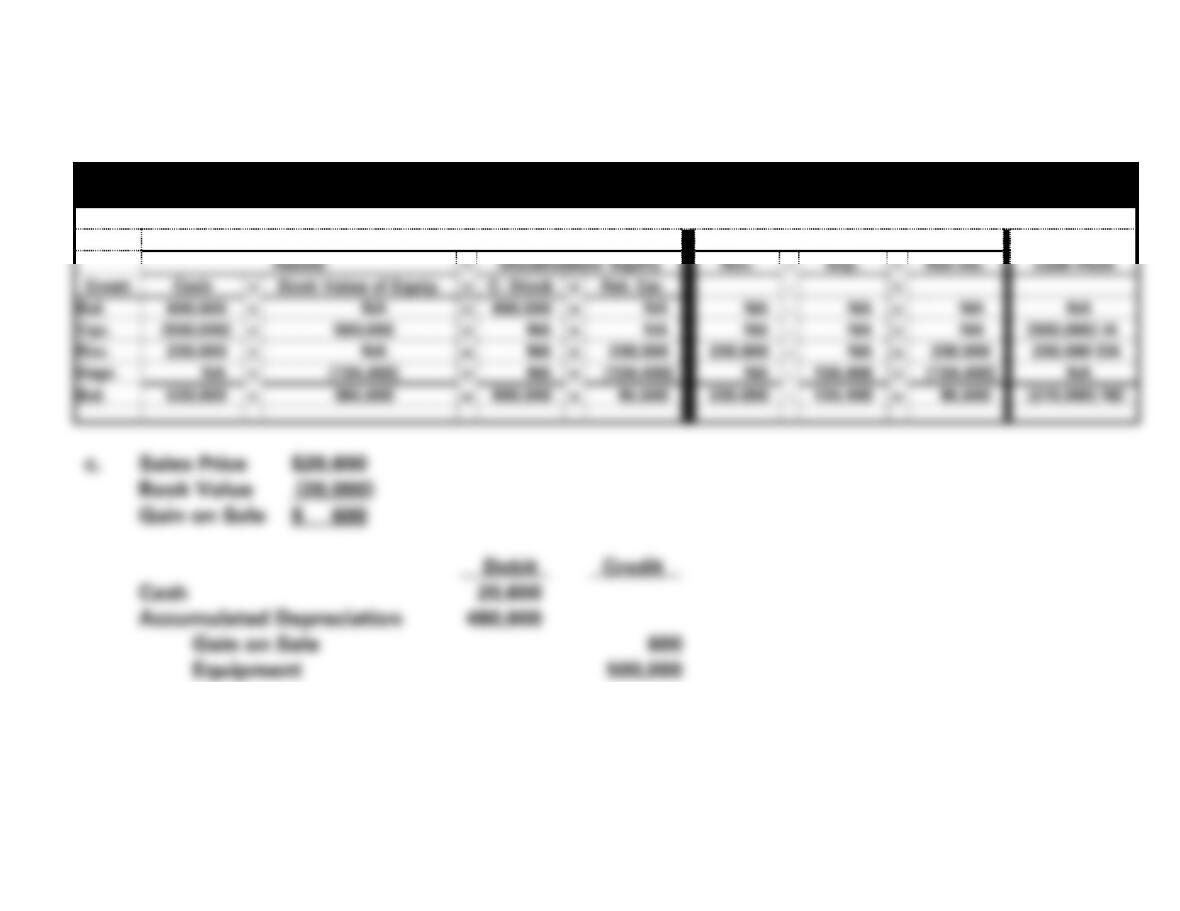
PROBLEM 8-29A (cont.)
b. NC = Net Change in Cash
Sobel Co.
Horizontal Statements Model for 2016
Balance Sheet
Income Statement
Assets
=
Stockholders’ Equity
Rev.
−
Exp.
=
Net Inc.
Cash Flow
Event
Cash
+
Book Value of Equip.
=
C. Stock
+
Ret. Ear.
−
=
Bal.
800,000
+
NA
=
800,000
+
NA
NA
−
NA
=
NA
NA
Equ.
(500,000)
+
500,000
=
NA
+
NA
NA
−
NA
=
NA
(500,000) IA
Rev.
230,000
+
NA
=
NA
+
230,000
230,000
−
NA
=
230,000
230,000 OA
Depr.
NA
+
(134,400)
=
NA
+
(134,400)
NA
−
134,400
=
(134,400)
NA
Bal.
530,000
+
365,600
=
800,000
+
95,600
230,000
−
134,400
=
95,600
(270,000) NC
c. Sales Price $20,600
Book Value (20,000)
Gain on Sale $ 600
Debit Credit
Cash 20,600
Accumulated Depreciation 480,000
Gain on Sale 600
Equipment 500,000
8-32
PROBLEM 8-30A
Depreciation Computations:
Straight-Line
Company A: ($50,000 − $5,000) 4 = $11,250 per year
Double-Declining Balance
8-33
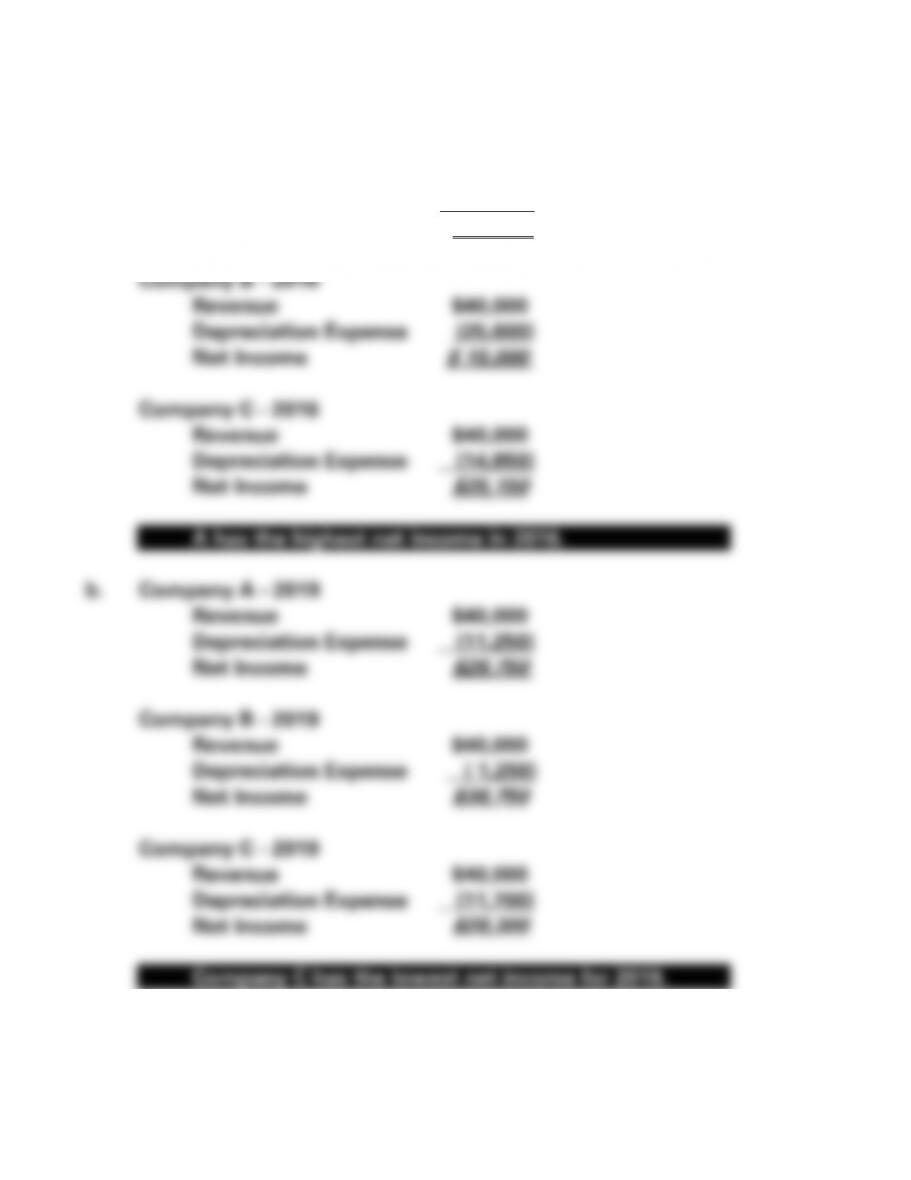
PROBLEM 8-30A (cont.)
a. Company A – 2016
Revenue $40,000
Depreciation Expense (11,250)
Net Income
$28,750
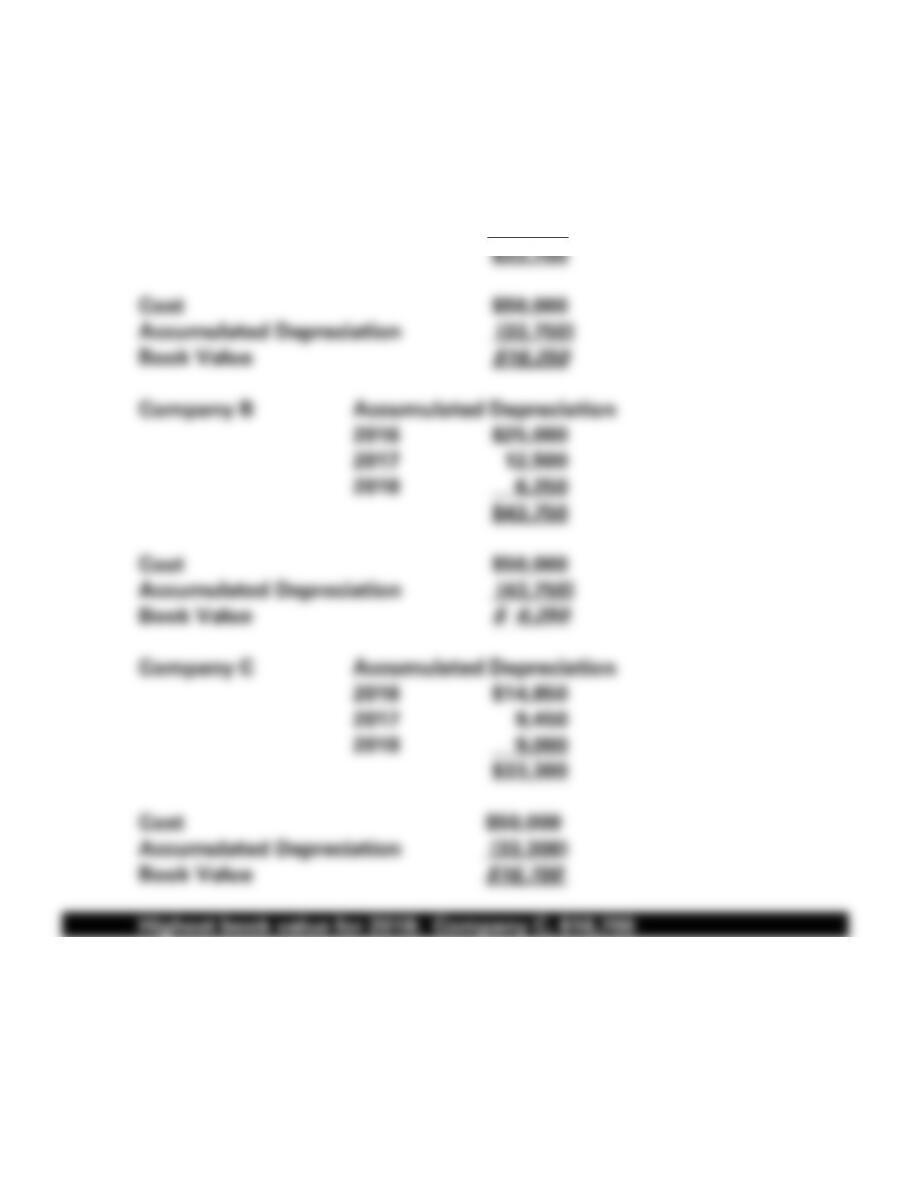
8-34
PROBLEM 8-30A (cont.)
c. Company A Accumulated Depreciation
2016 $ 11,250
2017 11,250
2018 11,250