PROBLEM 5-18B (cont.)
5-101
PROBLEM 5-18B (cont.)
b. (3) Weighted Average
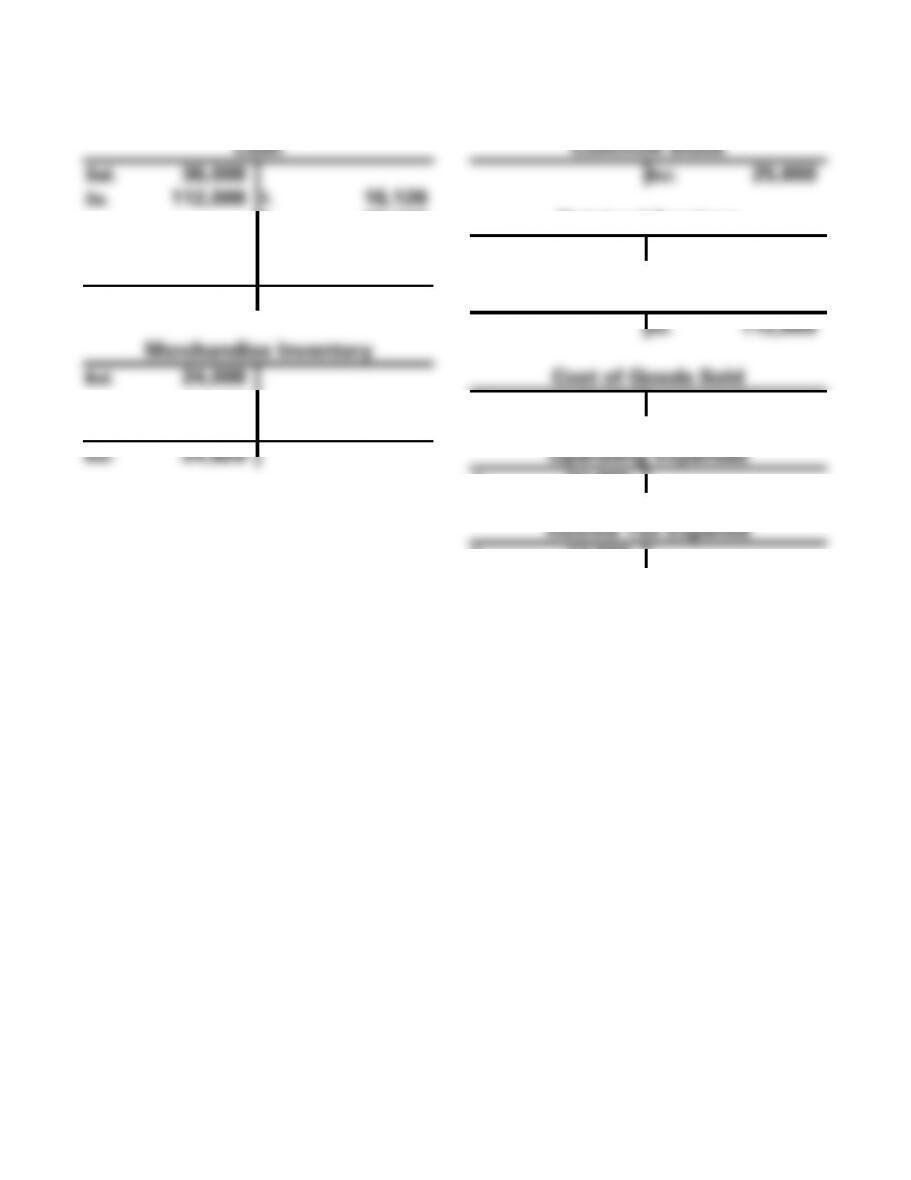
Cash
Common Stock
Bal. 36,000
Bal. 25,000
3a. 112,000
1. 16,120
2. 28,160
Retained Earnings
4. 24,000
Bal. 35,000
5. 17,820
Bal. 61,900
Sales Revenue
3a. 112,000
Merchandise Inventory
Bal. 24,000
Cost of Goods Sold
1. 16,120
3b. 43,451
2. 28,160
3b. 43,451
Bal. 24,829
Operating Expenses
4. 24,000
Income Tax Expense
5. 17,820
5-102
PROBLEM 5-18B (cont.)
c.
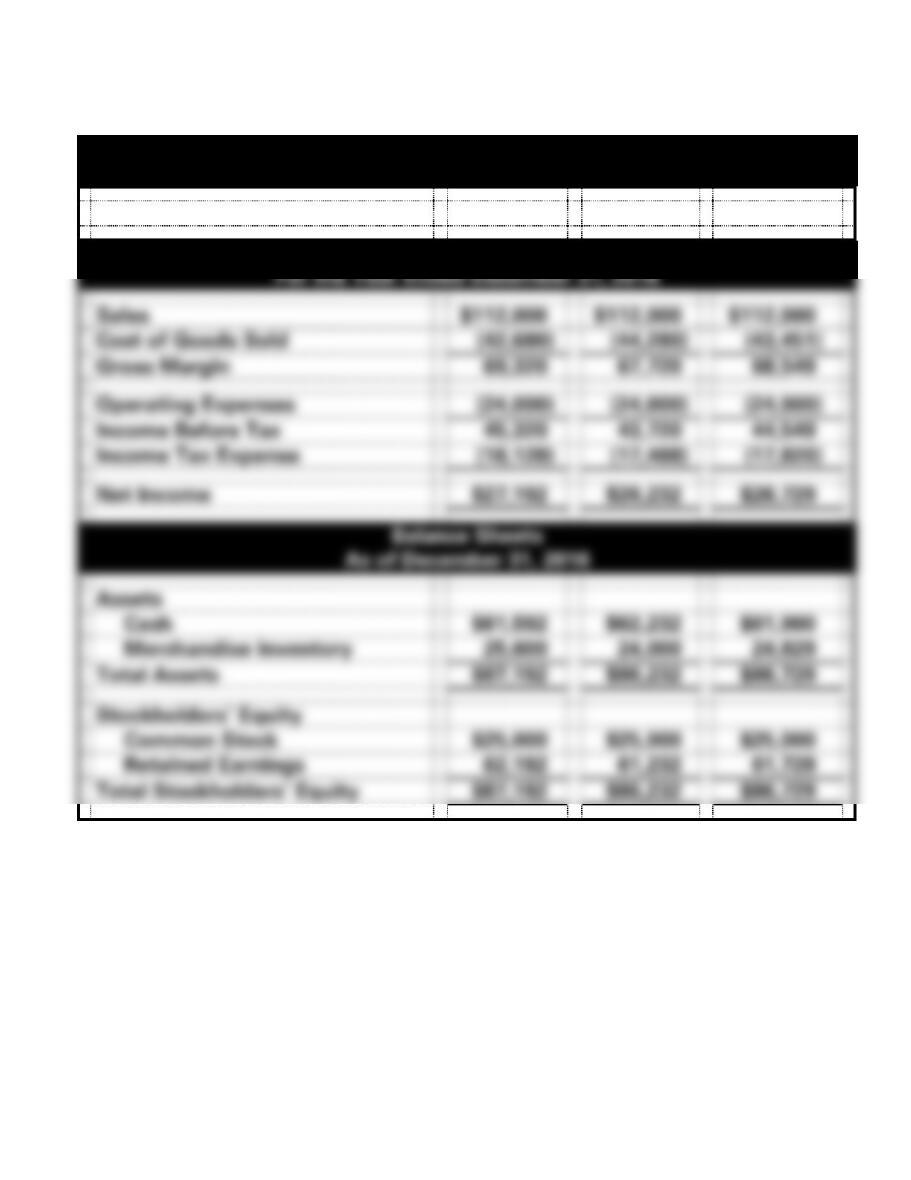
Allen Insulation, Inc.
Financial Statements
FIFO
LIFO
Weight. Av.
Income Statements
For the Year Ended December 31, 2016
Sales
$112,000
$112,000
$112,000
Cost of Goods Sold
(42,680)
(44,280)
(43,451)
Gross Margin
69,320
67,720
68,549
Operating Expenses
(24,000)
(24,000)
(24,000)
Income Before Tax
45,320
43,720
44,549
Income Tax Expense
(18,128)
(17,488)
(17,820)
Net Income
$27,192
$26,232
$26,729
Balance Sheets
As of December 31, 2016
Assets
Cash
$61,592
$62,232
$61,900
Merchandise Inventory
25,600
24,000
24,829
Total Assets
$87,192
$86,232
$86,729
Stockholders’ Equity
Common Stock
$25,000
$25,000
$25,000
Retained Earnings
62,192
61,232
61,729
Total Stockholders’ Equity
$87,192
$86,232
$86,729
5-103
PROBLEM 5-18B c. (cont.)
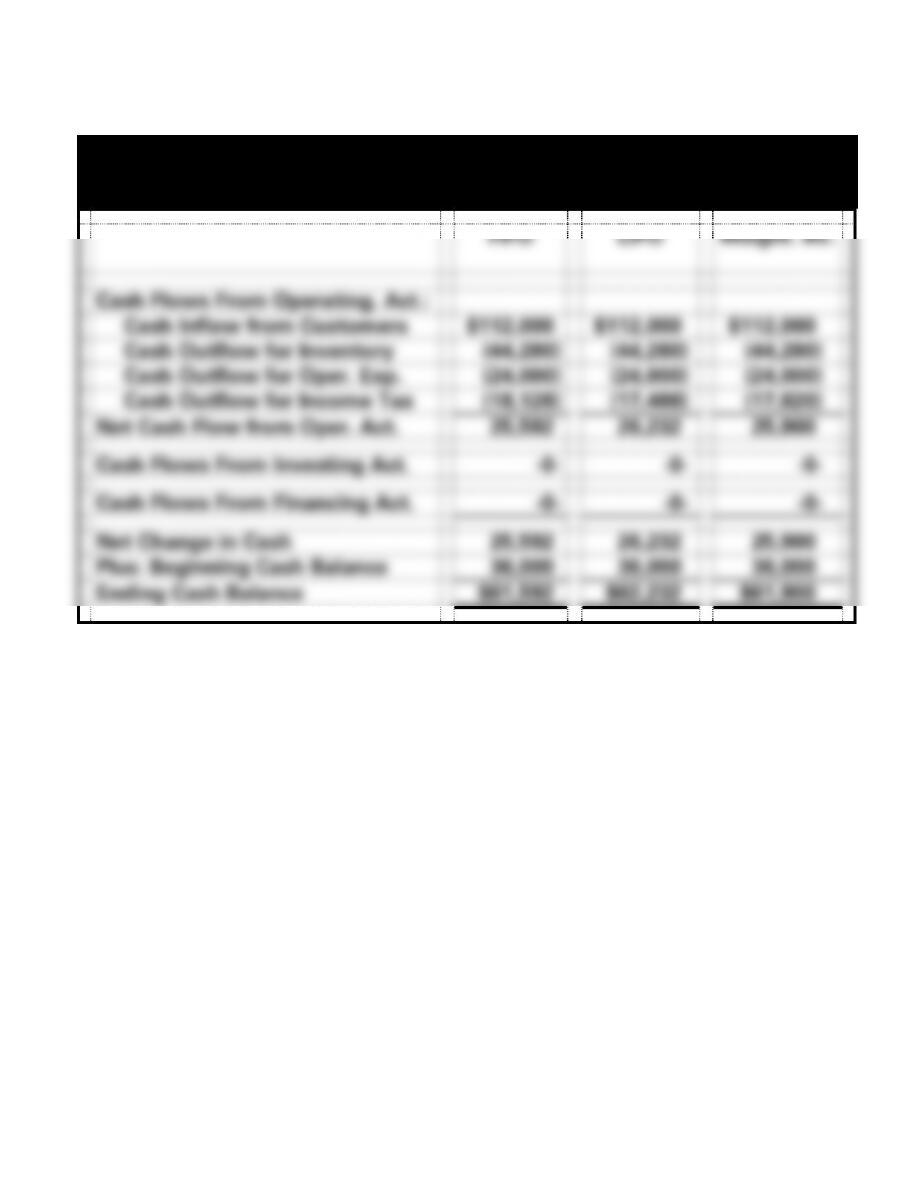
Allen Insulation, Inc.
Statements of Cash Flows
For the Year Ended December 31, 2016
FIFO
LIFO
Weight. Av.
Cash Flows From Operating. Act.:
Cash Inflow from Customers
$112,000
$112,000
$112,000
Cash Outflow for Inventory
(44,280)
(44,280)
(44,280)
Cash Outflow for Oper. Exp.
(24,000)
(24,000)
(24,000)
Cash Outflow for Income Tax
(18,128)
(17,488)
(17,820)
Net Cash Flow from Oper. Act.
25,592
26,232
25,900
Cash Flows From Investing Act.
-0-
-0-
-0-
Cash Flows From Financing Act.
-0-
-0-
-0-
Net Change in Cash
25,592
26,232
25,900
Plus: Beginning Cash Balance
36,000
36,000
36,000
Ending Cash Balance
$61,592
$62,232
$61,900
5-104
PROBLEM 5-19B
Provided for the use of the instructor:
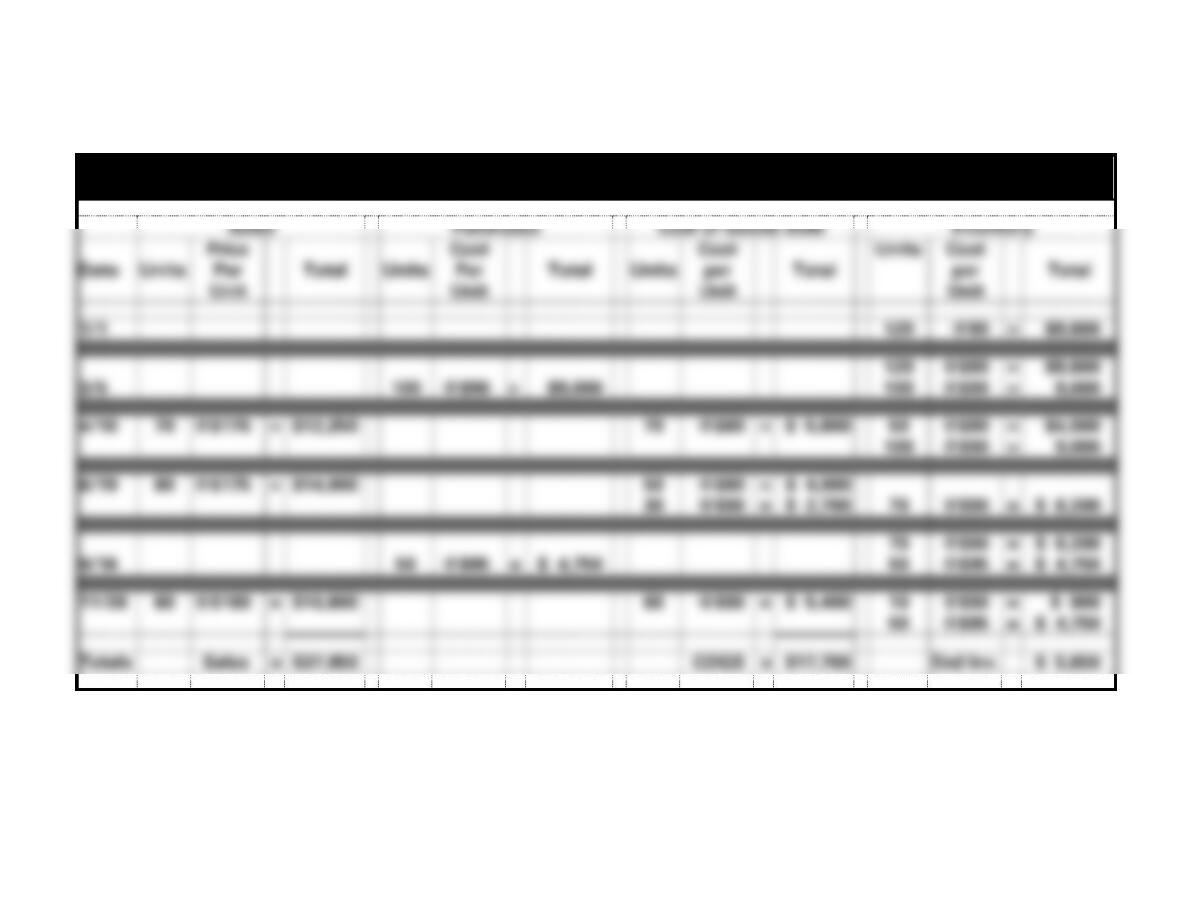
Donovan, Inc.
Sales and Purchase Transactions for 2016
Sales
Purchases
Cost of Goods Sold
Inventory
Date
Units
Price
Per
Unit
Total
Units
Cost
Per
Unit
Total
Units
Cost
per
Unit
Total
Units
Cost
per
Unit
Total
1/1
120
@80
=
$9,600
3/5
100
@$90
=
$9,000
120
100
@$80
@$90
=
=
$9,600
9,000
4/10
70
@$175
=
$12,250
70
@$80
=
$ 5,600
50
100
@$80
@$90
=
=
$4,000
9,000
6/19
80
@$175
=
$14,000
50
30
@$80
@$90
=
=
$ 4,000
$ 2,700
70
@$90
=
$ 6,300
9/16
50
@$95
=
$ 4,750
70
50
@$90
@$95
=
=
$ 6,300
$ 4,750
11/28
60
@$180
=
$10,800
60
@$90
=
$ 5,400
10
50
@$90
@$95
=
=
$ 900
$ 4,750
Totals
Sales
=
$37,050
COGS
=
$17,700
End Inv.
$ 5,650
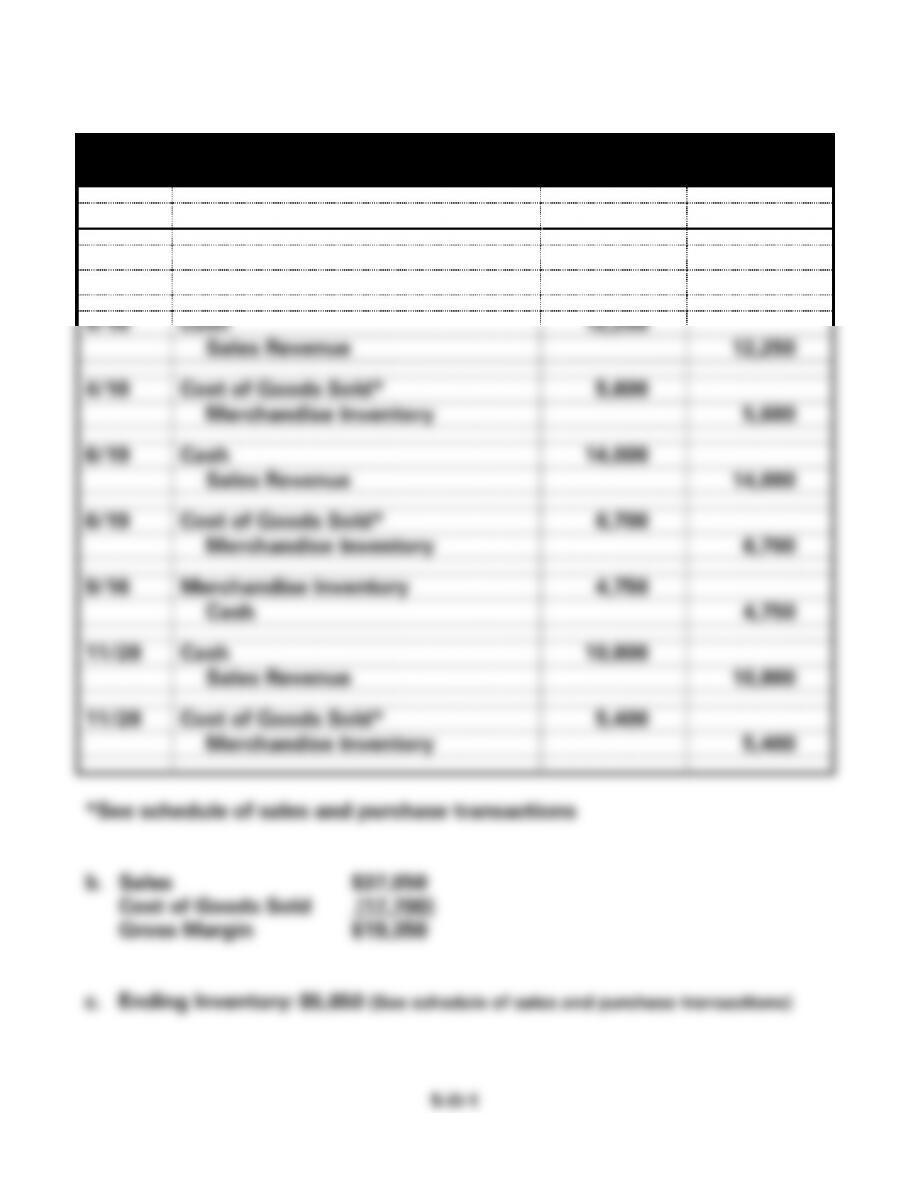
PROBLEM 5-19B (cont.)
a.
Donovan, Inc.
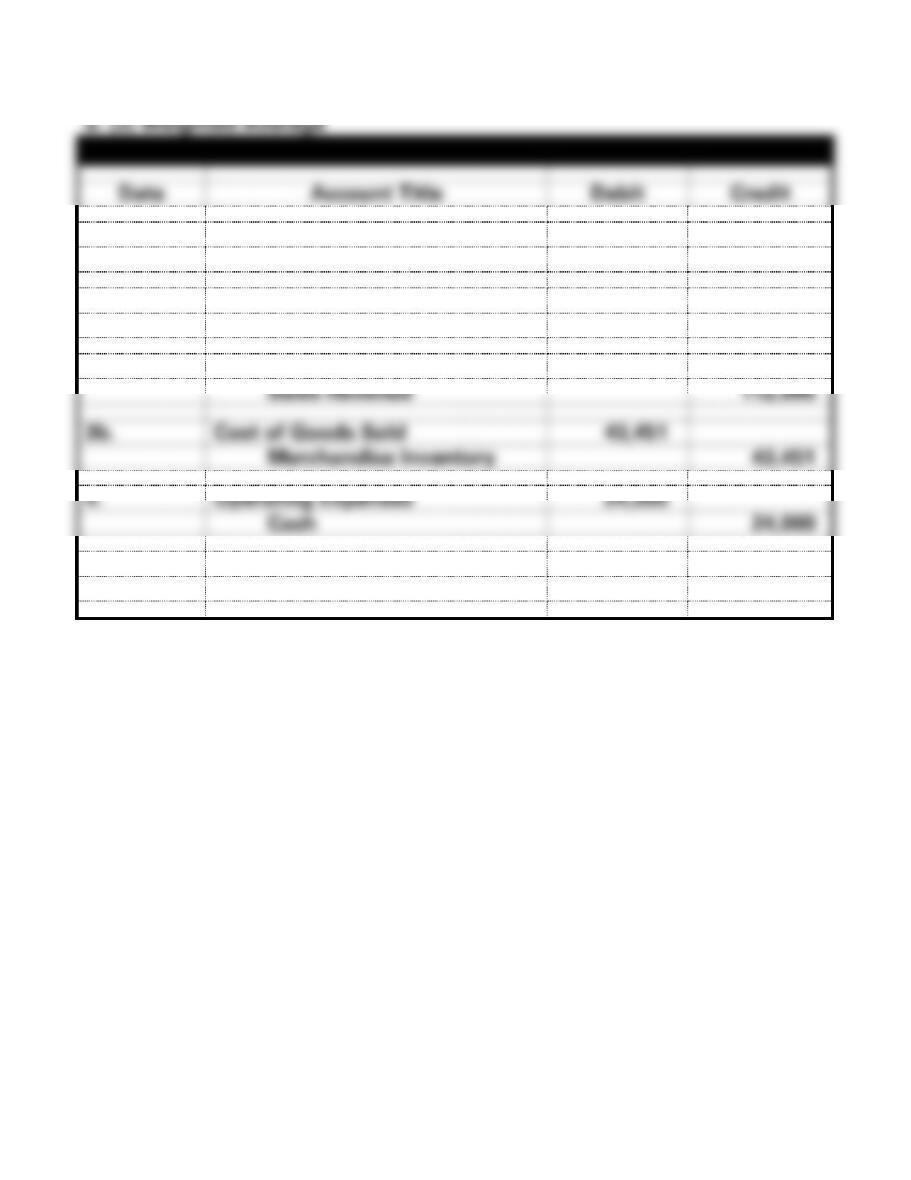
General Journal, 2016
Date
Account Titles
Debit
Credit
3/5
Merchandise Inventory
9,000
Cash
9,000
4/10
Cash
12,250
Sales Revenue
12,250
4/10
Cost of Goods Sold*
5,600
Merchandise Inventory
5,600
6/19
Cash
14,000
Sales Revenue
14,000
6/19
Cost of Goods Sold*
6,700
Merchandise Inventory
6,700
9/16
Merchandise Inventory
4,750
Cash
4,750
11/28
Cash
10,800
Sales Revenue
10,800
11/28
Cost of Goods Sold*
5,400
Merchandise Inventory
5,400
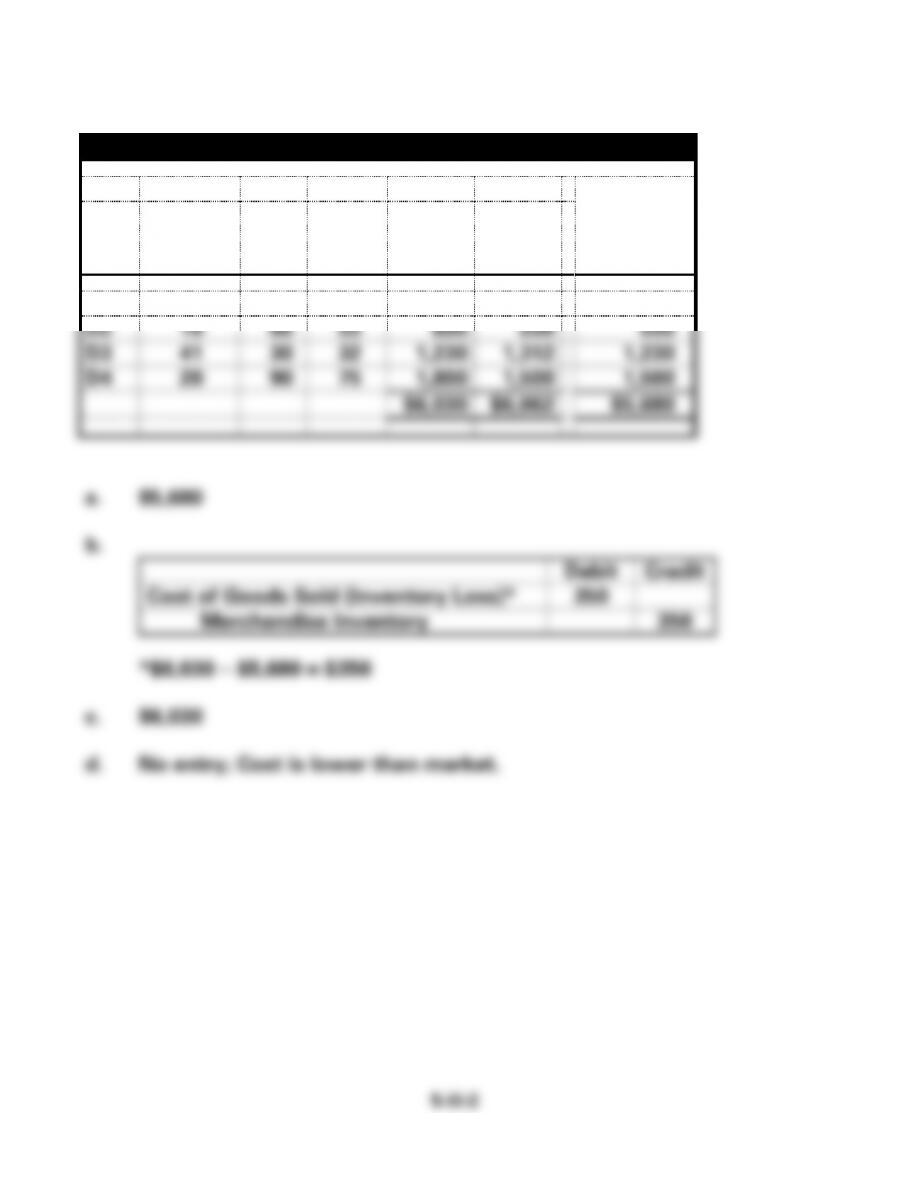
PROBLEM 5-20B
Ronaldo Jewelers
Ind. Item
Item
Quantity
Unit
Cost
Unit
Marke
t
Total
Cost
Total
Market
Lower of
Cost/Mkt.
D1
30
$80
$90
$2,400
$2,700
$2,400
D2
10
60
55
600
550
550
D3
41
30
32
1,230
1,312
1,230
D4
20
90
75
1,800
1,500
1,500
$6,030
$6,062
$5,680
a. $5,680
b.
Debit
Credit
Cost of Goods Sold (Inventory Loss)*
350
Merchandise Inventory
350
*$6,030 − $5,680 = $350
c. $6,030
d. No entry; Cost is lower than market.
PROBLEM 5-21B
a. (1) Estimated Gross Margin:
Sales x Gross Margin %: $800,000 x .35 = $280,000
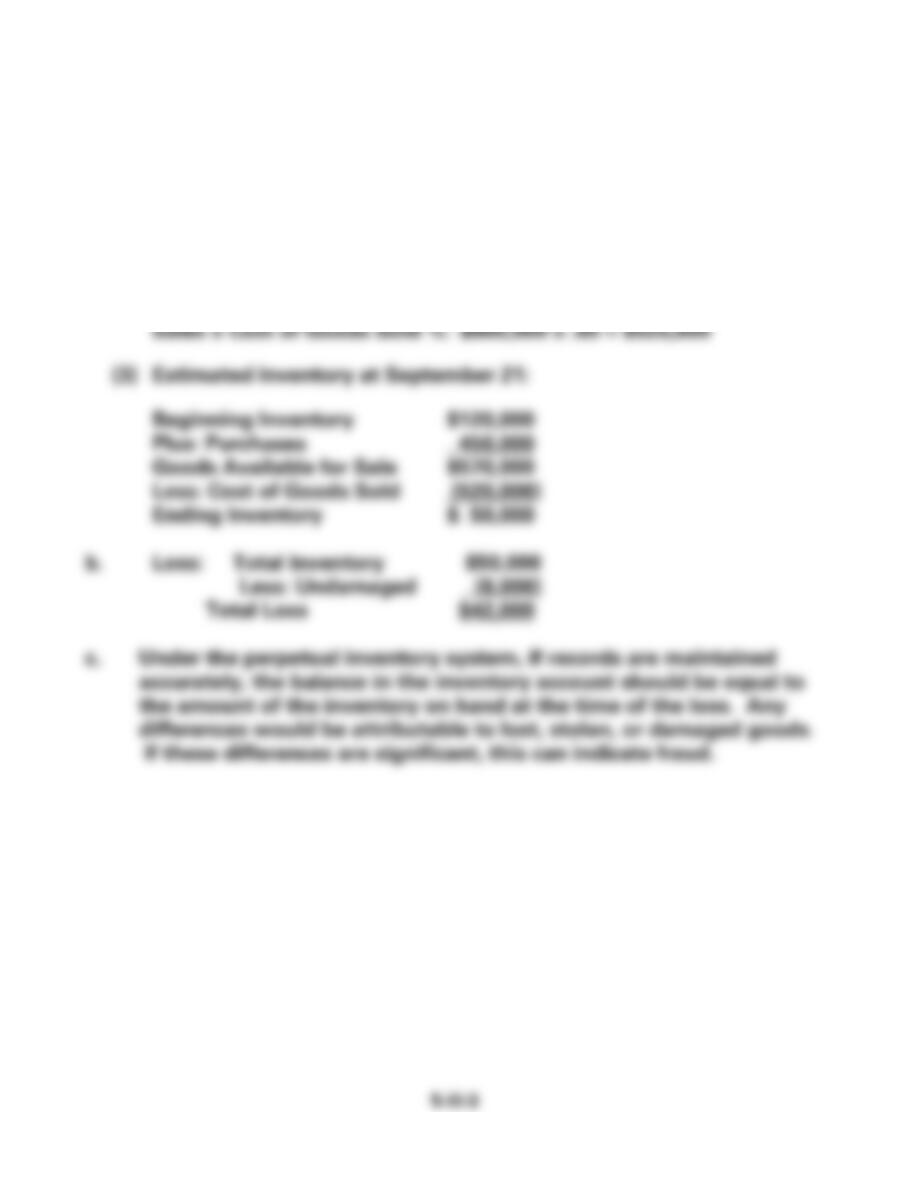
(2) Estimated Cost of Goods Sold:
Sales − Gross Margin: $800,000 − $280,000= $520,000
Or:
PROBLEM 5-22B
Todd Company
2016
2017
Total
Net Sales
$220,000
$250,000
$470,000
Cost of Goods Sold
(99,000)
(117,200)
(216,200)
Gross Margin
121,000
132,800
253,800
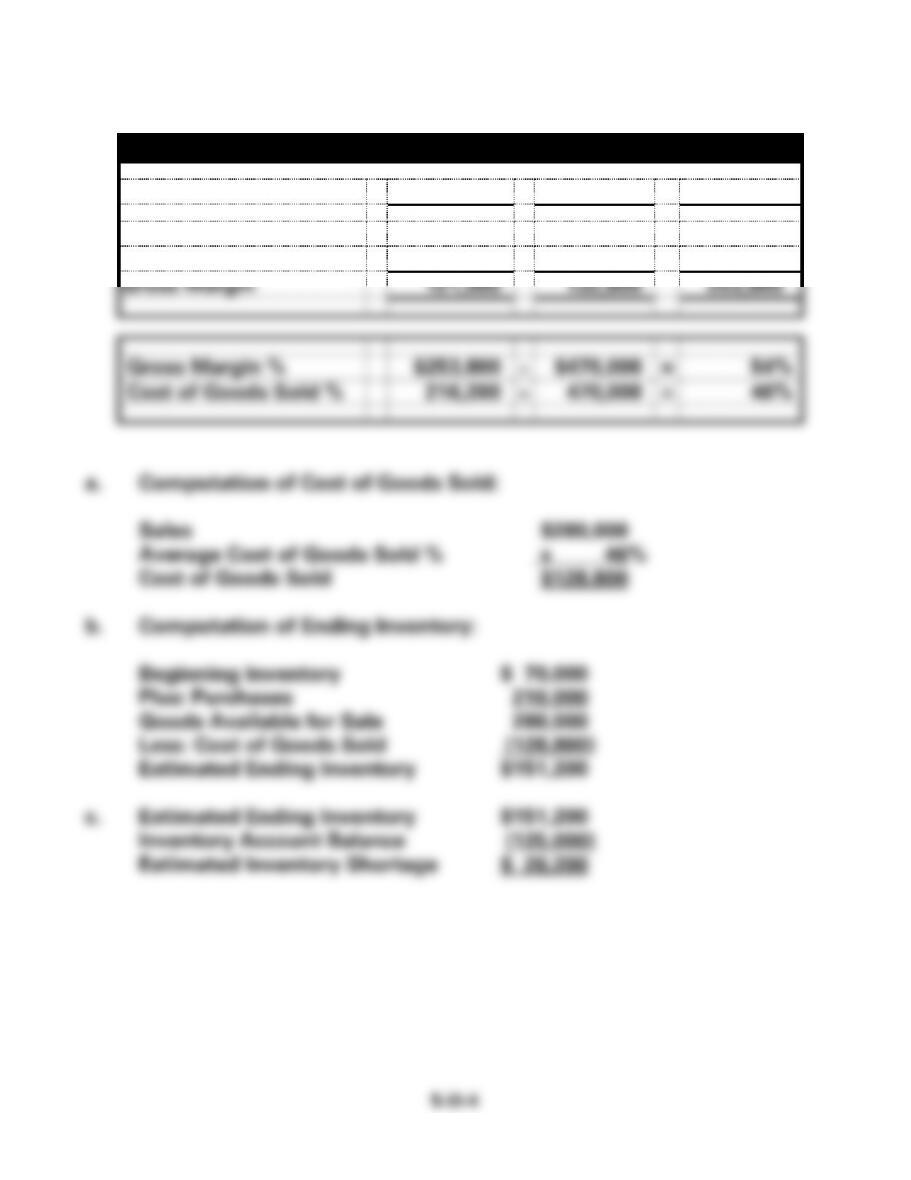
Gross Margin %
$253,800
$470,000
=
54%
Cost of Goods Sold %
216,200
470,000
=
46%
a. Computation of Cost of Goods Sold:
Sales $280,000
Average Cost of Goods Sold % x 46%
Cost of Goods Sold $128,800
b. Computation of Ending Inventory:
Beginning Inventory $ 70,000
Plus: Purchases 210,000
Goods Available for Sale 280,000
Less: Cost of Goods Sold (128,800)
Estimated Ending Inventory $151,200
c. Estimated Ending Inventory $151,200
Inventory Account Balance (125,000)
Estimated Inventory Shortage $ 26,200
PROBLEM 5-23B
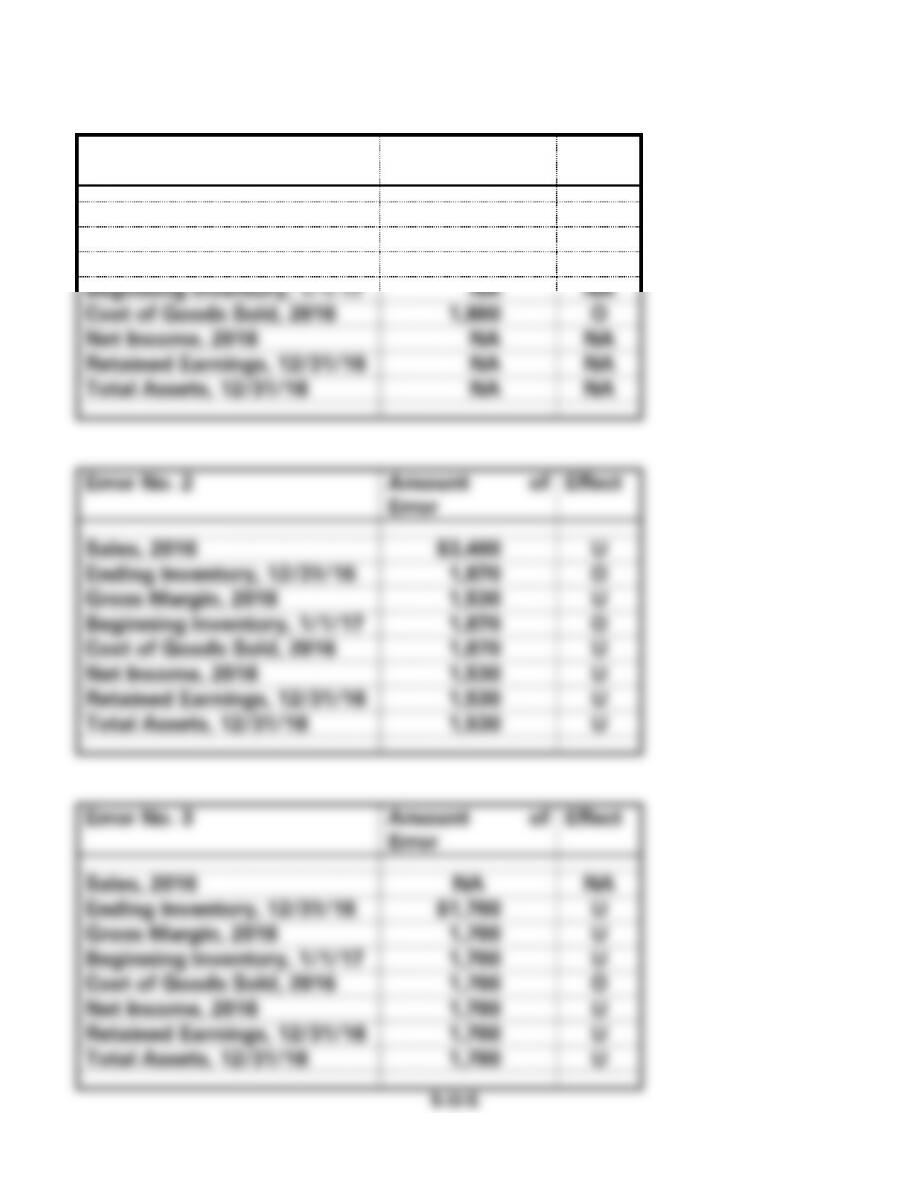
Error No. 1
Amount of
Error
Effect
Sales, 2016
NA
NA
Ending Inventory, 12/31/16
NA
NA
Gross Margin, 2016
$1,800
U
Beginning Inventory, 1/1/17
NA
NA
Cost of Goods Sold, 2016
1,800
O
Net Income, 2016
NA
NA
Retained Earnings, 12/31/16
NA
NA
Total Assets, 12/31/16
NA
NA
Error No. 2
Amount of
Error
Effect
Sales, 2016
$3,400
U
Ending Inventory, 12/31/16
1,870
O
Gross Margin, 2016
1,530
U
Beginning Inventory, 1/1/17
1,870
O
Cost of Goods Sold, 2016
1,870
U
Net Income, 2016
1,530
U
Retained Earnings, 12/31/16
1,530
U
Total Assets, 12/31/16
1,530
U
Error No. 3
Amount of
Error
Effect
Sales, 2016
NA
NA
Ending Inventory, 12/31/16
$1,700
U
Gross Margin, 2016
1,700
U
Beginning Inventory, 1/1/17
1,700
U
Cost of Goods Sold, 2016
1,700
O
Net Income, 2016
1,700
U
Retained Earnings, 12/31/16
1,700
U
Total Assets, 12/31/16
1,700
U

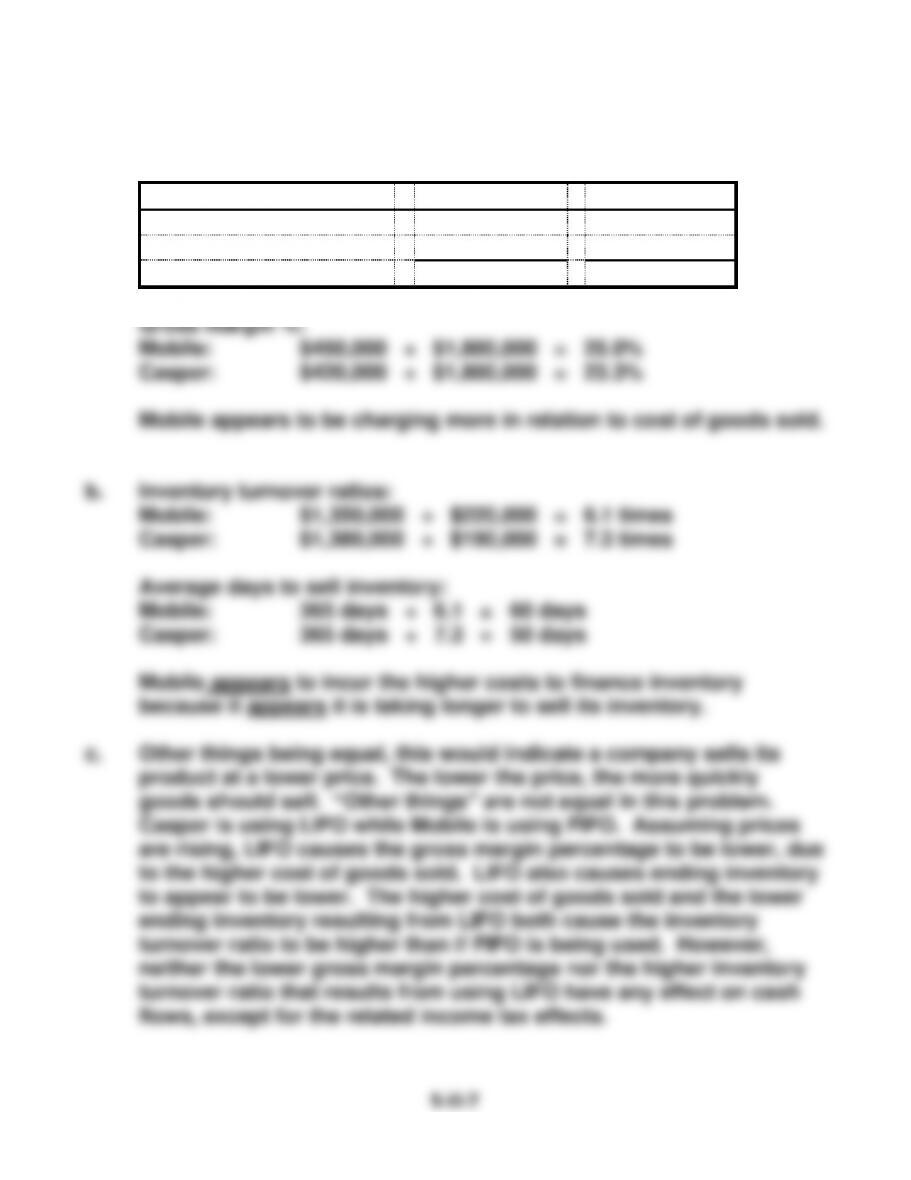
PROBLEM 5-24B
a. First the company’s gross margins must be calculated:
Mobile
Casper
Sales
$1,800,000
$1,800,000
Cost of Goods Sold
(1,350,000)
(1,380,000)
Gross Margin
$ 450,000
$ 420,000