EXERCISE 5-2B
Harris Co.
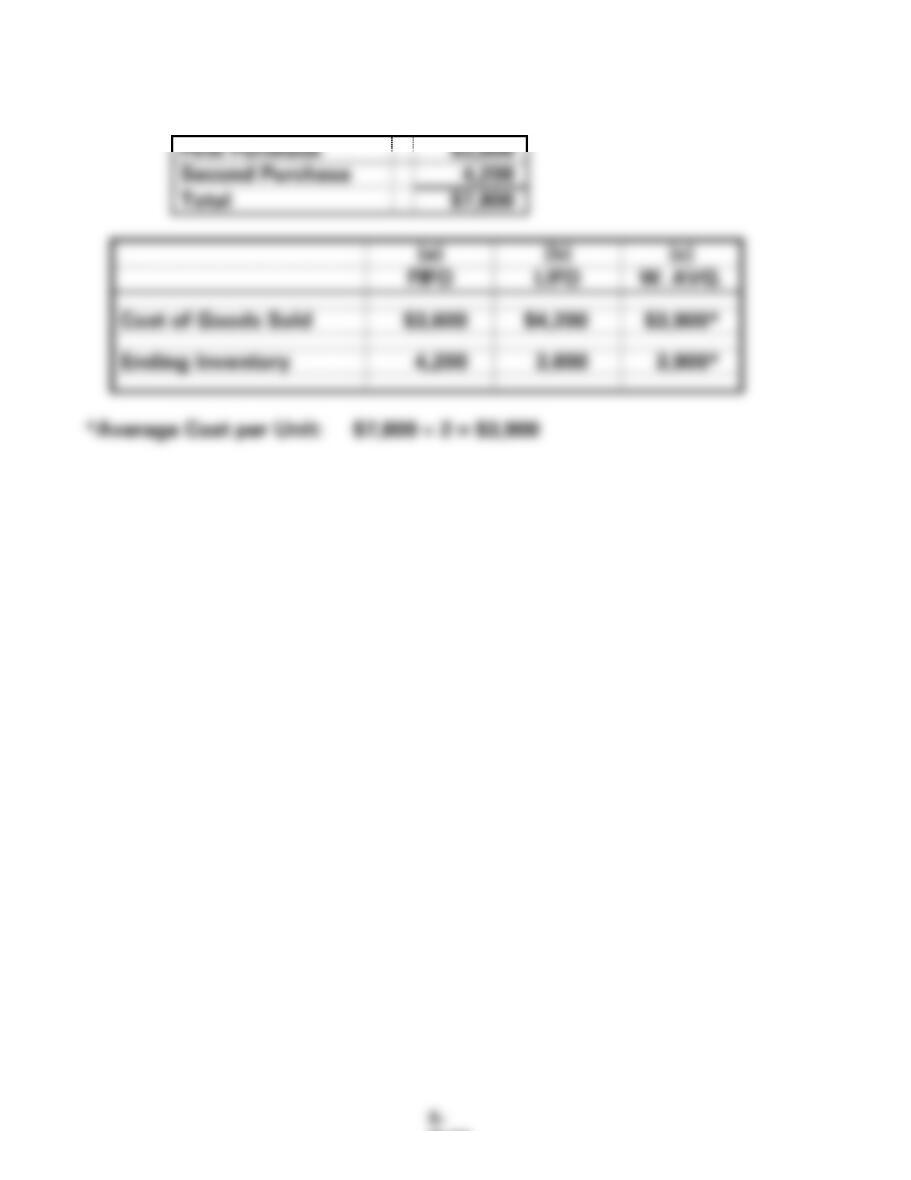
First Purchase
$3,600
Second Purchase
4,200
Total
$7,800
(a)
(b)
(c)
FIFO
LIFO
W. AVG.
Cost of Goods Sold
$3,600
$4,200
$3,900*
Ending Inventory
4,200
3,600
3,900*
*Average Cost per Unit: $7,800 2 = $3,900
EXERCISE 5-3B
Marley Company
Inventory Purchases
Beginning Inventory
400
@
$50
=
$20,000
First Purchase
500
@
55
=
27,500
Second Purchase
600
@
58
=
34,800
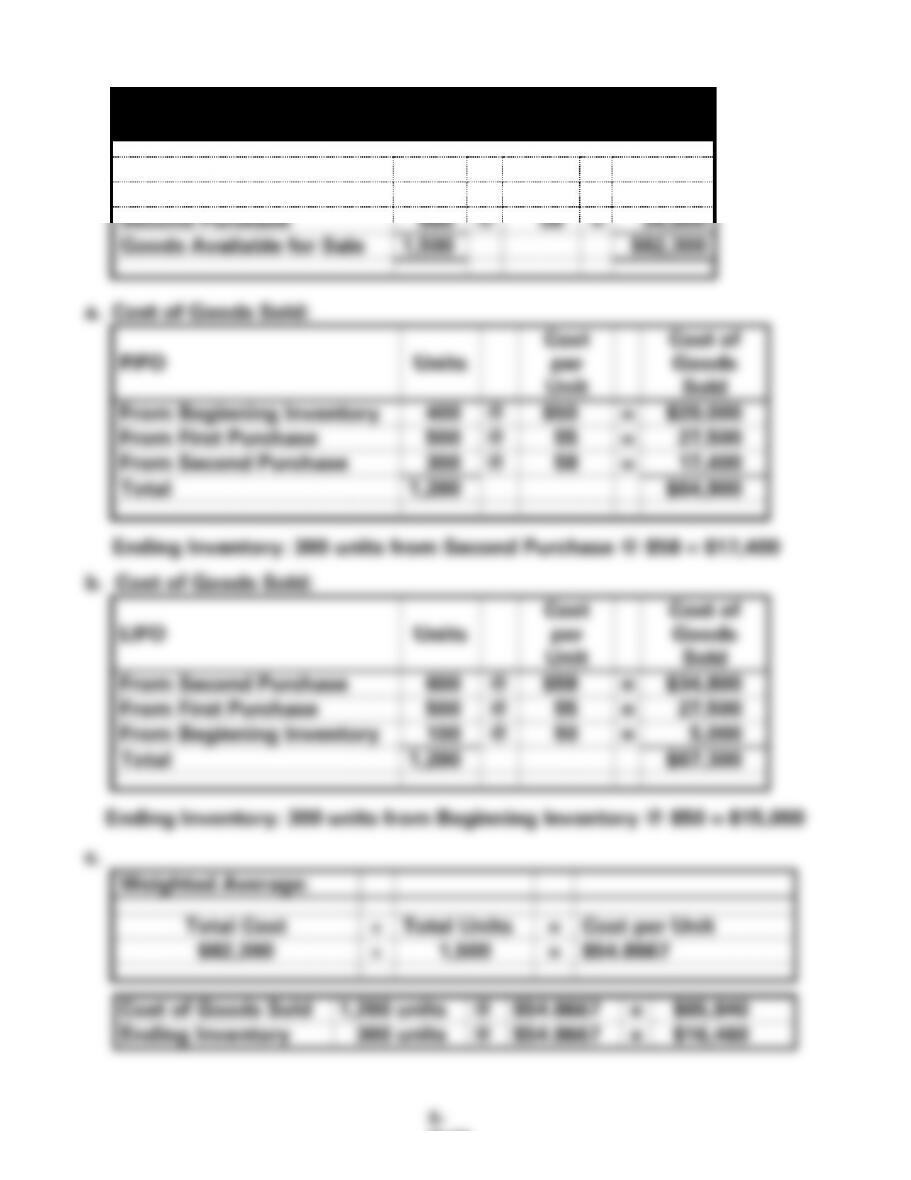
Goods Available for Sale
1,500
$82,300
a. Cost of Goods Sold:
FIFO
Units
Cost
per
Unit
Cost of
Goods
Sold
From Beginning Inventory
400
@
$50
=
$20,000
From First Purchase
500
@
55
=
27,500
From Second Purchase
300
@
58
=
17,400
Total
1,200
$64,900
Ending Inventory: 300 units from Second Purchase @ $58 = $17,400
b. Cost of Goods Sold:
LIFO
Units
Cost
per
Unit
Cost of
Goods
Sold
From Second Purchase
600
@
$58
=
$34,800
From First Purchase
500
@
55
=
27,500
From Beginning Inventory
100
@
50
=
5,000
Total
1,200
$67,300
Ending Inventory: 300 units from Beginning Inventory @ $50 = $15,000
c.
Weighted Average:
Total Cost
Total Units
=
Cost per Unit
$82,300
1,500
=
$54.8667
Cost of Goods Sold
1,200 units
@
$54.8667
Ending Inventory
300 units
EXERCISE 5-4B
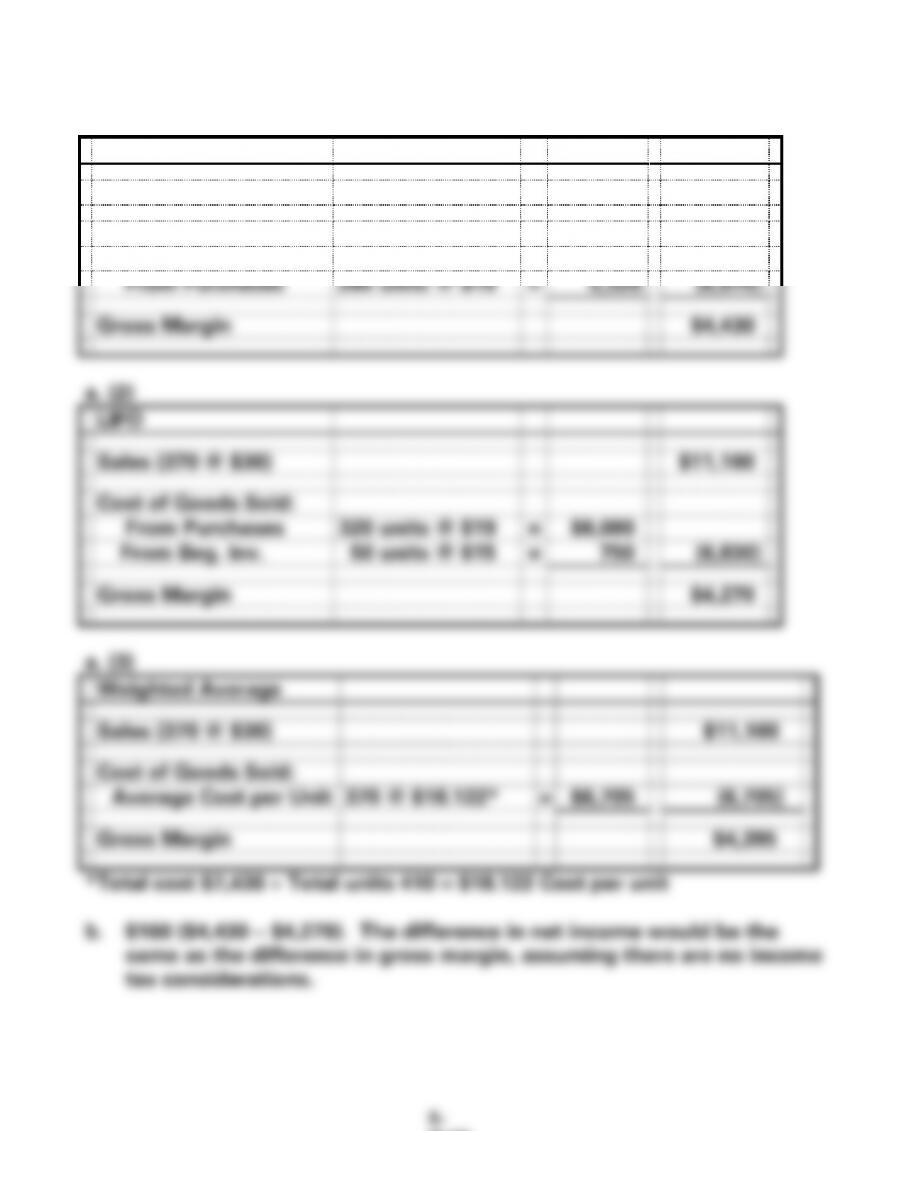
a. (1) Stanley Company
FIFO
Sales (370 @ $30)
$11,100
Cost of Goods Sold:
From Beginning Inv.
90 units @ $15
=
$ 1,350
From Purchases
280 units @ $19
=
5,320
(6,670)
Gross Margin
$4,430
a. (2)
LIFO
Sales (370 @ $30)
$11,100
Cost of Goods Sold:
From Purchases
320 units @ $19
=
$6,080
From Beg. Inv.
50 units @ $15
=
750
(6,830)
Gross Margin
$4,270
Weighted Average
Sales (370 @ $30)
$11,100
Cost of Goods Sold:
Average Cost per Unit
370 @ $18.122*
=
$6,705
(6,705)
Gross Margin
$4,395
*Total cost $7,430 Total units 410 = $18.122 Cost per unit
b. $160 ($4,430 − $4,270). The difference in net income would be the
same as the difference in gross margin, assuming there are no income
tax considerations.
EXERCISE 5-4B (cont.)
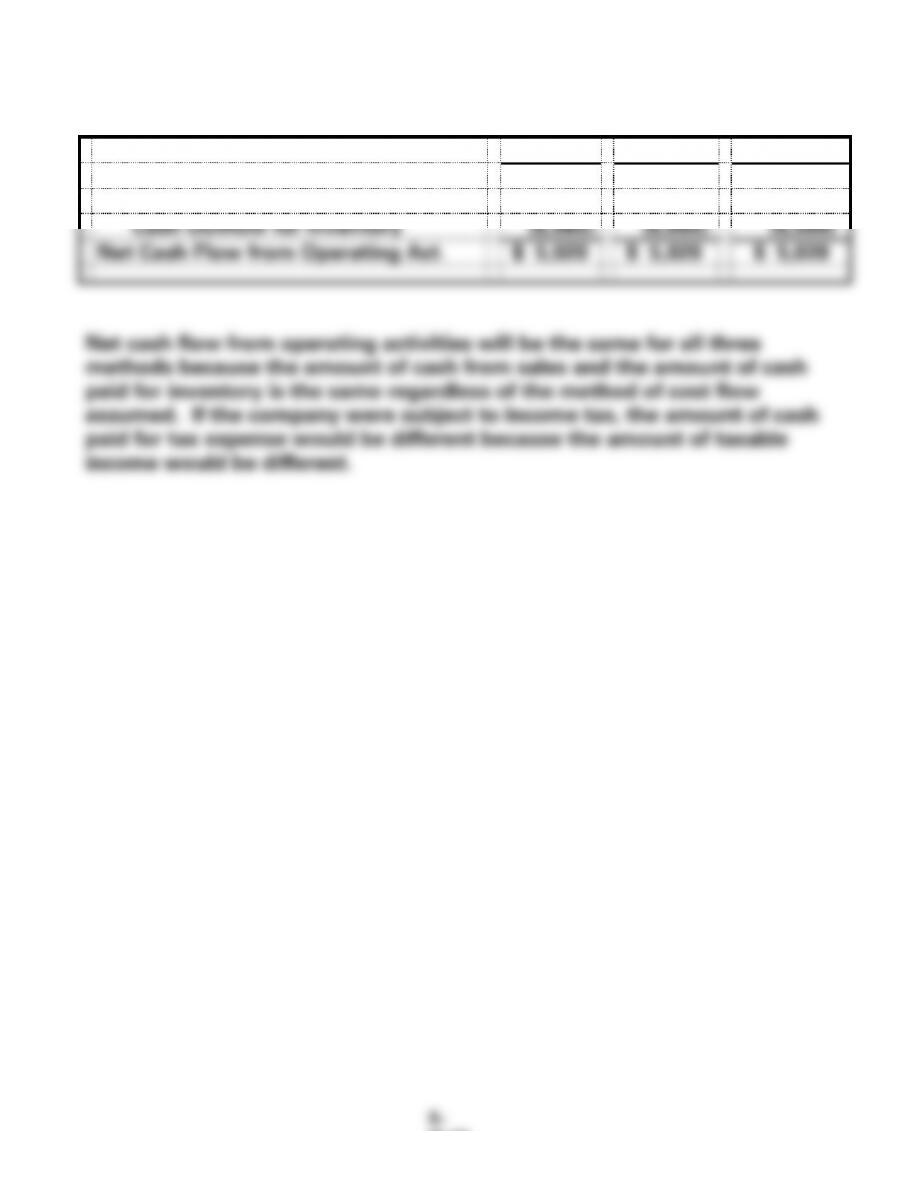
c.
FIFO
LIFO
W. Avg.
Cash Flows From Operating Activities:
Cash Inflow from Customers
$11,100
$11,100
$11,100
Cash Outflow for Inventory
(6,080)
(6,080)
(6,080)
Net Cash Flow from Operating Act.
$ 5,020
$ 5,020
$ 5,020
Net cash flow from operating activities will be the same for all three
methods because the amount of cash from sales and the amount of cash
paid for inventory is the same regardless of the method of cost flow
assumed. If the company were subject to income tax, the amount of cash
paid for tax expense would be different because the amount of taxable
income would be different.
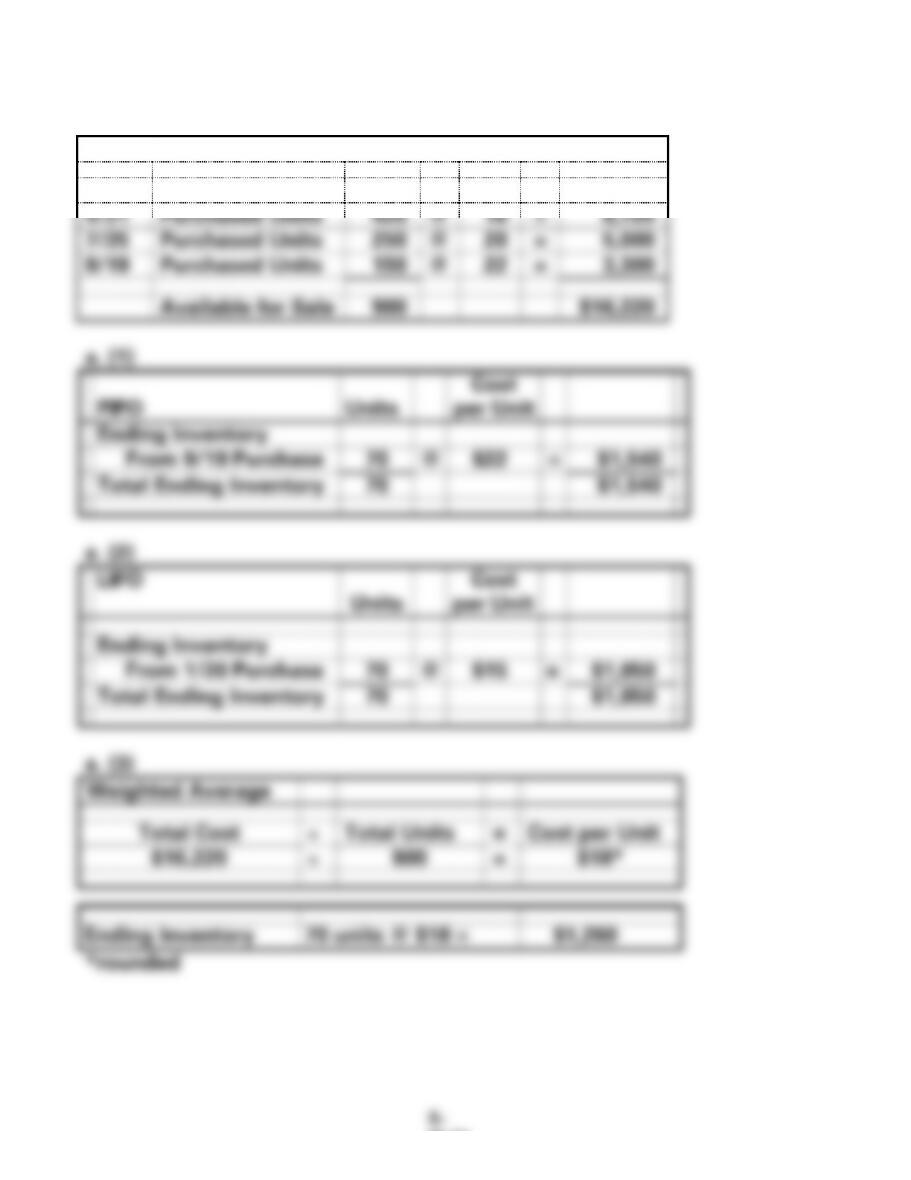
EXERCISE 5-5B
a.
Scott Sales
Summary of Purchase Transactions
1/20
Purchased Units
80
@
$15
=
$ 1,200
4/21
Purchased Units
420
@
16
=
6,720
7/25
Purchased Units
250
@
20
=
5,000
9/19
Purchased Units
150
@
22
=
3,300
Available for Sale
900
$16,220
a. (1)
FIFO
Units
Cost
per Unit
Ending Inventory
From 9/19 Purchase
70
@
$22
=
$1,540
Total Ending Inventory
70
$1,540
a. (2)
LIFO
Units
Cost
per Unit
Ending Inventory
From 1/20 Purchase
70
@
$15
=
$1,050
Total Ending Inventory
70
$1,050
a. (3)
Weighted Average
Total Cost
Total Units
=
Cost per Unit
$16,220
900
=
$18*
Ending Inventory
70 units @ $18 =
$1,260
*rounded
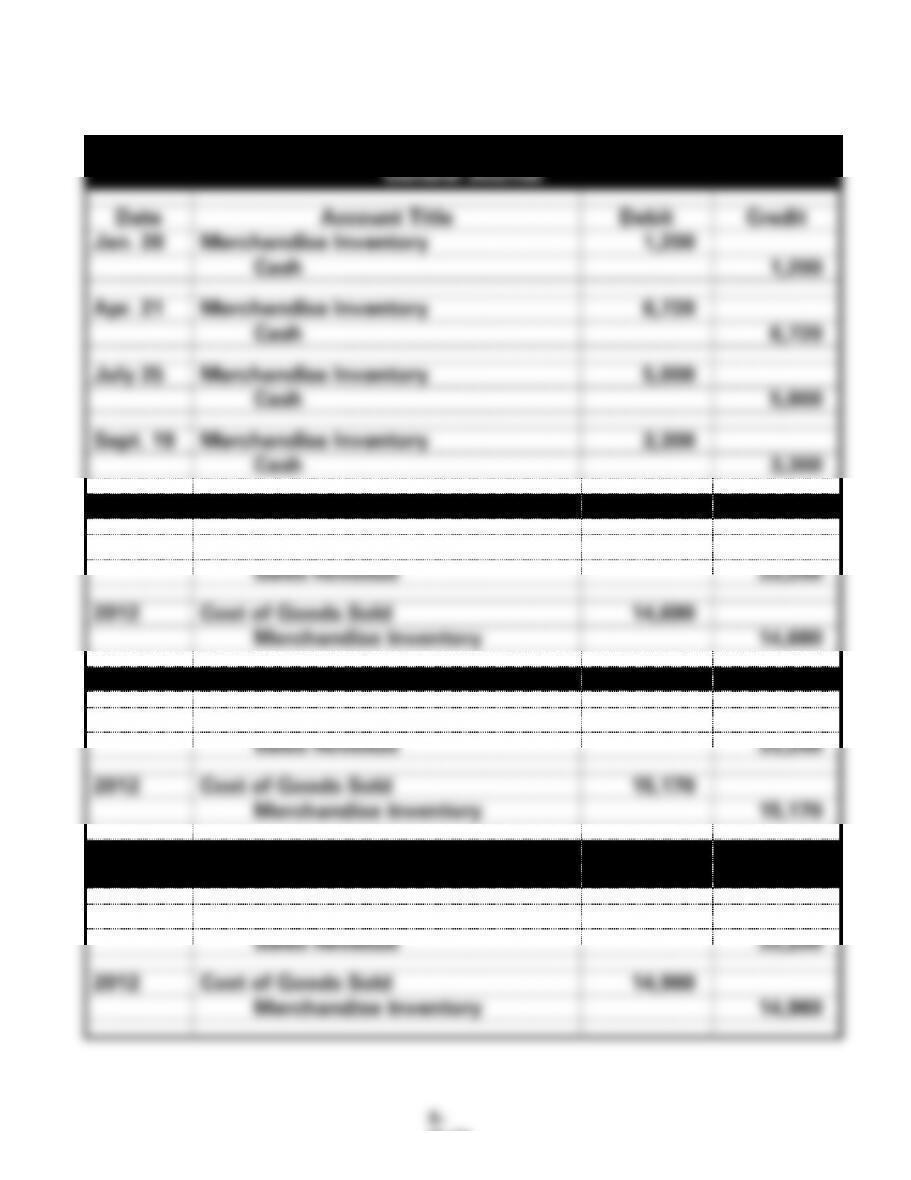
EXERCISE 5-5B (cont.)
b.
Note: The purchase entries are the same for all three methods.
Scott Sales
General Journal
Date
Account Title
Debit
Credit
Jan. 20
Merchandise Inventory
1,200
Cash
1,200
Apr. 21
Merchandise Inventory
6,720
Cash
6,720
July 25
Merchandise Inventory
5,000
Cash
5,000
Sept. 19
Merchandise Inventory
3,300
Cash
3,300
(1) FIFO Sales and Cost of Goods Sold
2012
Cash
33,200
Sales Revenue
33,200
2012
Cost of Goods Sold
14,680
Merchandise Inventory
14,680
(2) LIFO Sales and Cost of Goods Sold
2012
Cash
33,200
Sales Revenue
33,200
2012
Cost of Goods Sold
15,170
Merchandise Inventory
15,170
(3) Weighted Average Sales and Cost of Goods
Sold
2012
Cash
33,200
Sales Revenue
33,200
2012
Cost of Goods Sold
14,960
Merchandise Inventory
14,960
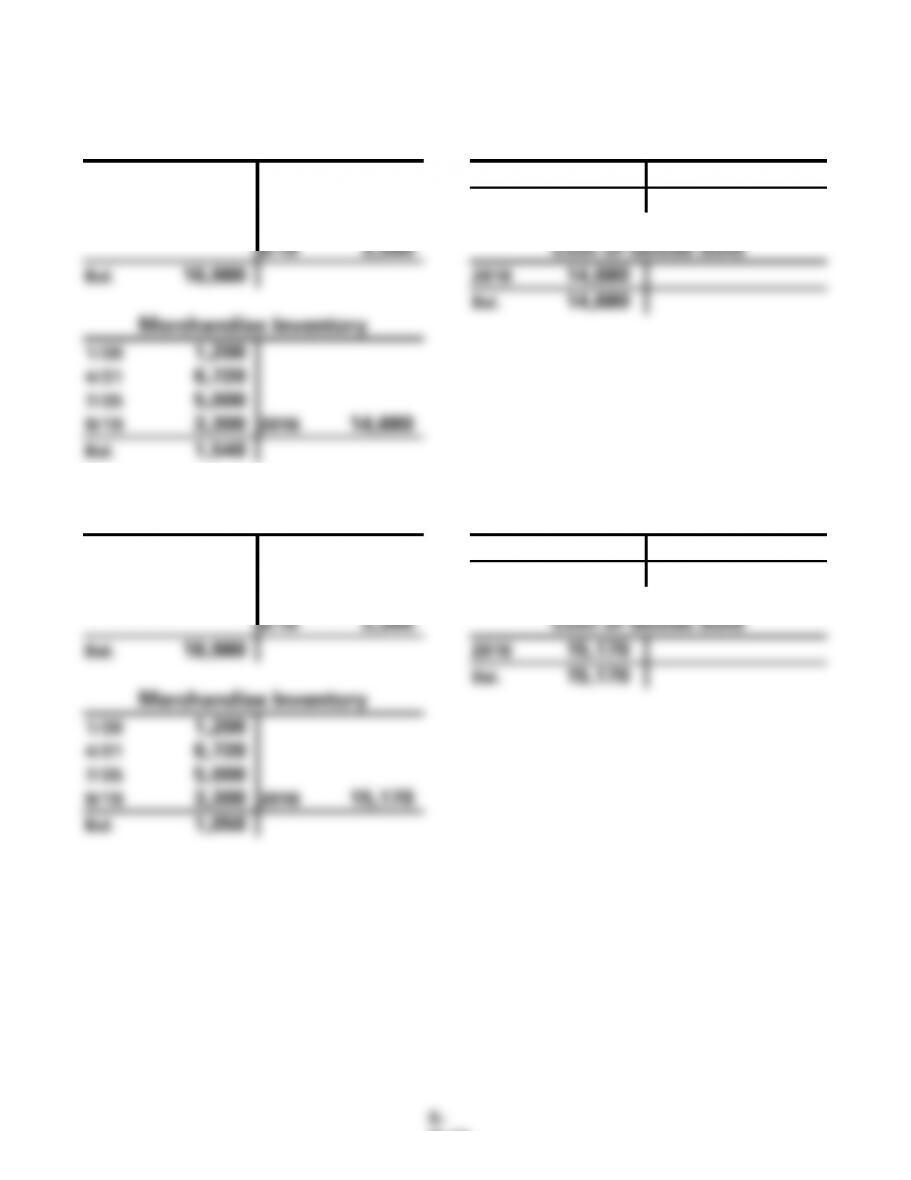
EXERCISE 5-5B b. (cont.)
(1) FIFO
Cash
Sales Revenue
2016 33,200
1/20 1,200
2016 33,200
4/21 6,720
Bal. 33,200
7/25 5,000
9/19 3,300
Cost of Goods Sold
Bal. 16,980
2016 14,680
Bal. 14,680
Merchandise Inventory
1/20 1,200
4/21 6,720
7/25 5,000
9/19 3,300
2016 14,680
Bal. 1,540
(2) LIFO
Cash
Sales Revenue
2016 33,200
1/20 1,200
2016 33,200
4/21 6,720
Bal. 33,200
7/25 5,000
9/19 3,300
Cost of Goods Sold
Bal. 16,980
2016 15,170
Bal. 15,170
Merchandise Inventory
1/20 1,200
4/21 6,720
7/25 5,000
9/19 3,300
2016 15,170
Bal. 1,050
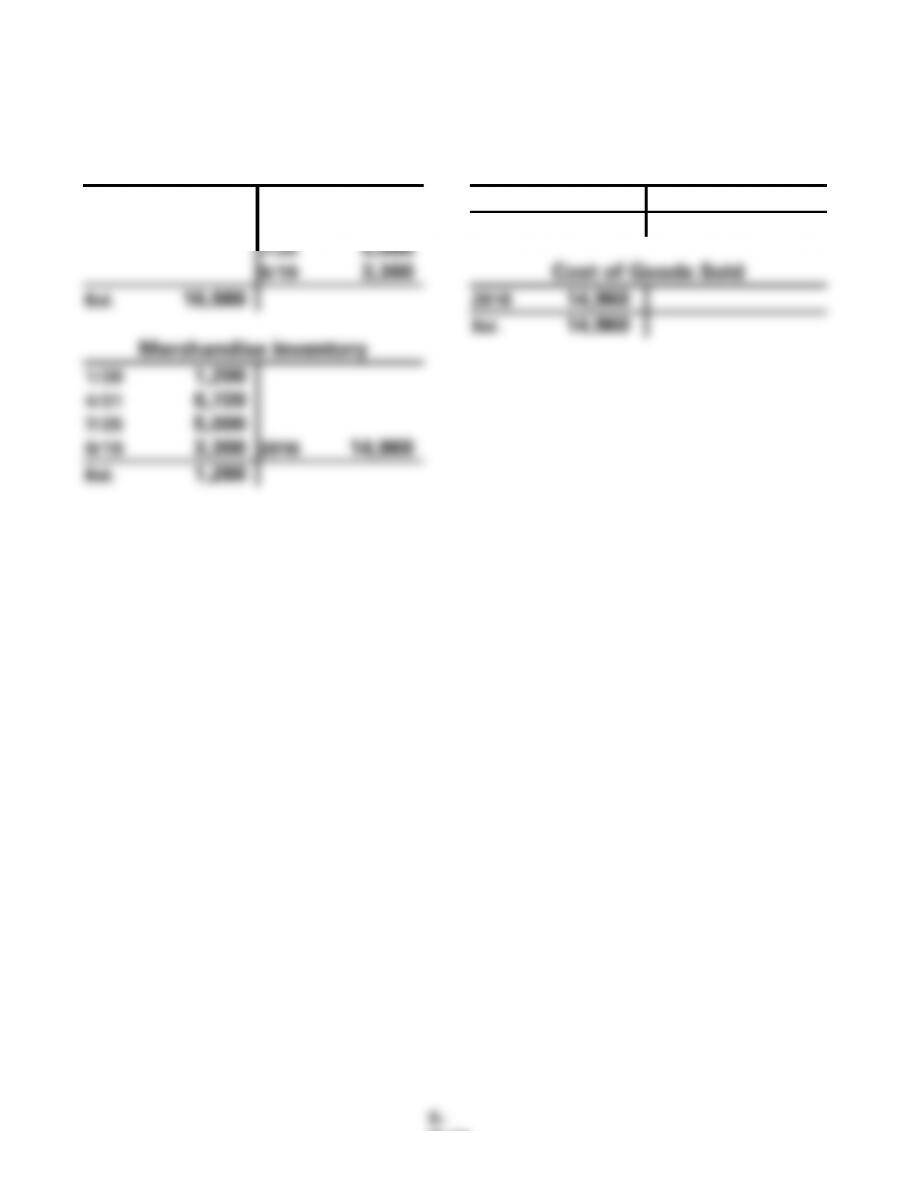
EXERCISE 5-5B b. (cont.)
(3) Weighted Average
Cash
Sales Revenue
2016 33,200
1/20 1,200
2013 33,200
4/21 6,720
Bal. 33,200
7/25 5,000
9/19 3,300
Cost of Goods Sold
Bal. 16,980
2016 14,960
Bal. 14,960
Merchandise Inventory
1/20 1,200
4/21 6,720
7/25 5,000
9/19 3,300
2016 14,960
Bal. 1,260
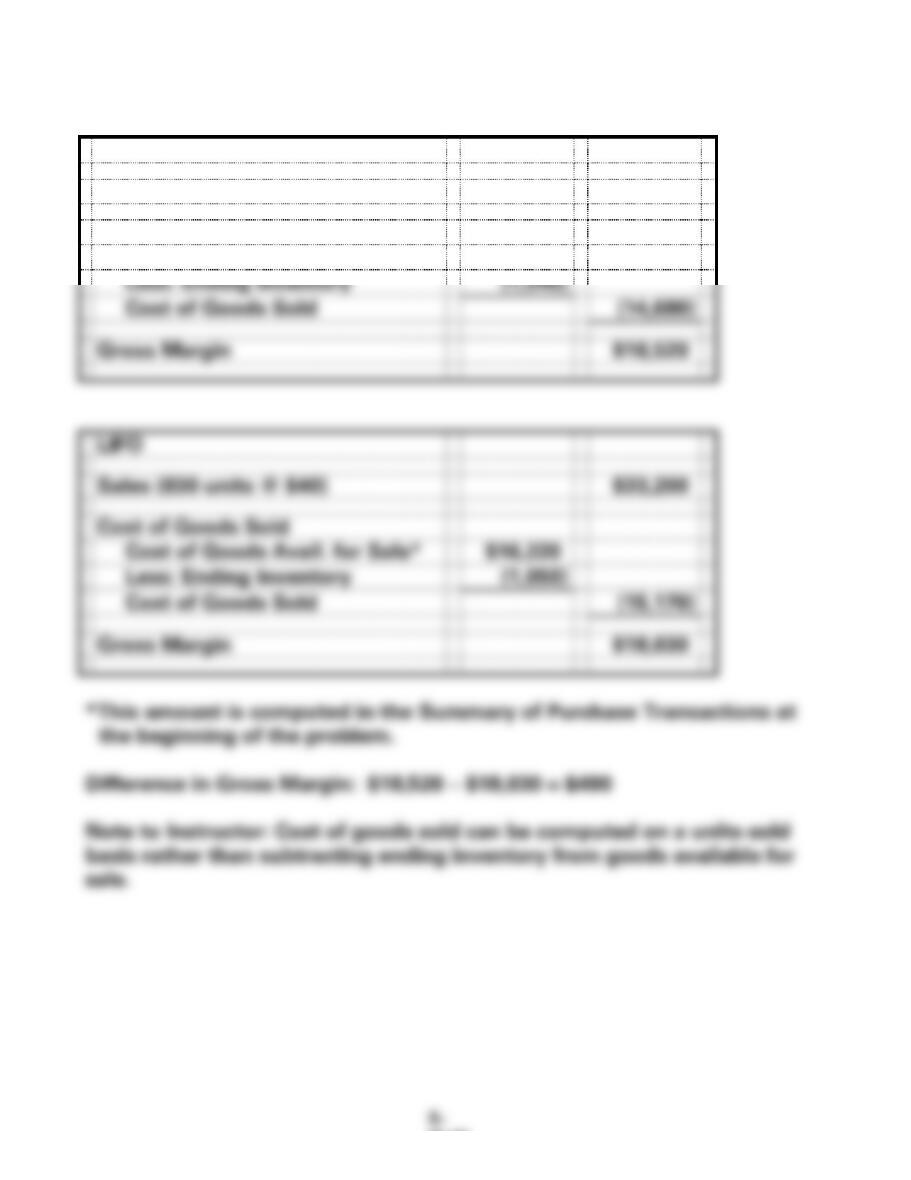
EXERCISE 5-5B (cont.)
c.
FIFO
Sales (830 units @ $40)
$33,200
Cost of Goods Sold
Cost of Goods Avail. for Sale*
$16,220
Less: Ending Inventory
(1,540)
Cost of Goods Sold
(14,680)
Gross Margin
$18,520
LIFO
Sales (830 units @ $40)
$33,200
Cost of Goods Sold
Cost of Goods Avail. for Sale*
$16,220
Less: Ending Inventory
(1,050)
Cost of Goods Sold
(15,170)
Gross Margin
$18,030
*This amount is computed in the Summary of Purchase Transactions at
the beginning of the problem.
Difference in Gross Margin: $18,520 − $18,030 = $490
Note to Instructor: Cost of goods sold can be computed on a units-sold
basis rather than subtracting ending inventory from goods available for
sale.
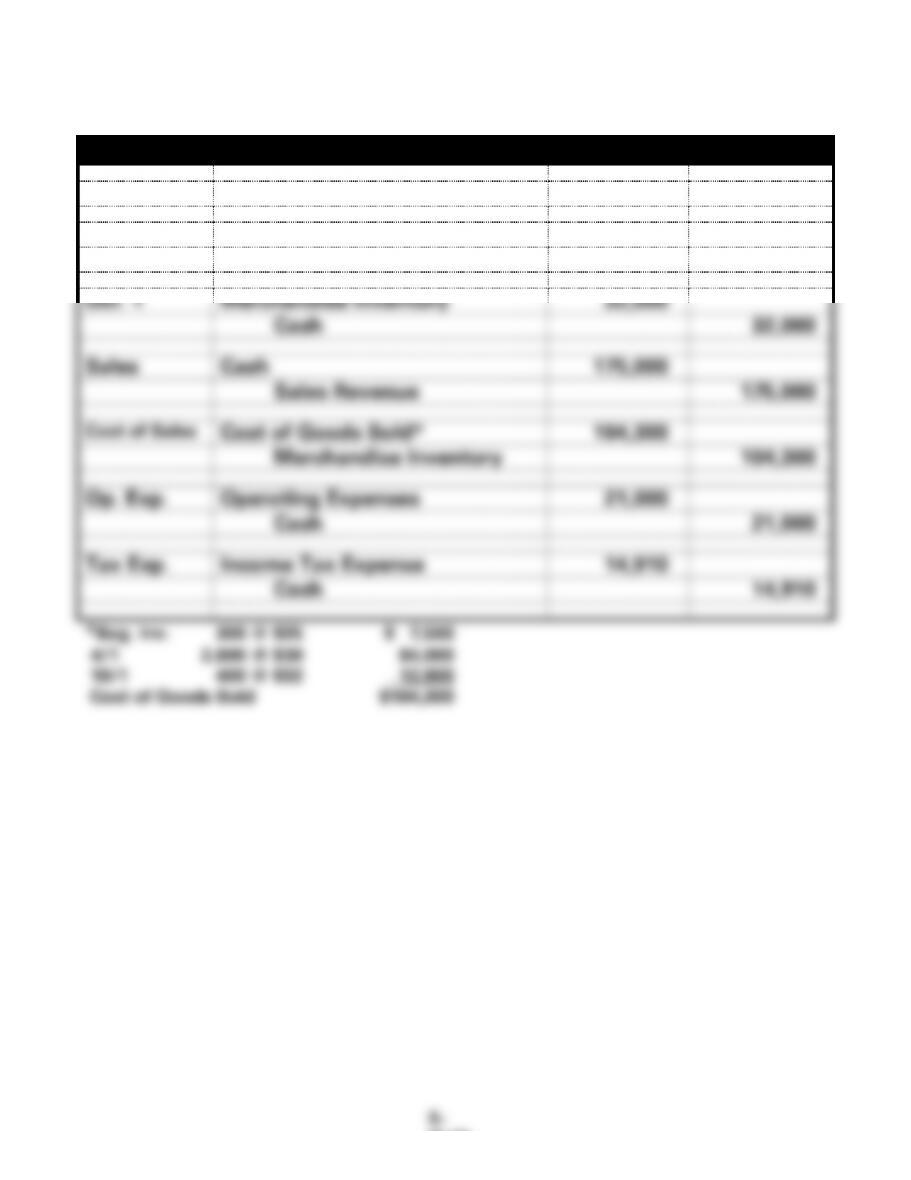
EXERCISE 5-6B
a. (1) FIFO
Date
Account Title
Debit
Credit
Apr. 1
Merchandise Inventory
84,000
Cash
84,000
Oct. 1
Merchandise Inventory
32,000
Cash
32,000
Sales
Cash
175,000
Sales Revenue
175,000
Cost of Sales
Cost of Goods Sold*
104,300
Merchandise Inventory
104,300
Op. Exp.
Operating Expenses
21,000
Cash
21,000
Tax Exp.
Income Tax Expense
14,910
Cash
14,910
*Beg. Inv. 300 @ $25 $ 7,500
4/1 2,800 @ $30 84,000
10/1 400 @ $32 12,800
Cost of Goods Sold $104,300

EXERCISE 5-6B a. (cont.)
(1) FIFO
Cash
Common Stock
Bal. 36,000
Bal. 20,000
sales 175,000
4/1 84,000
10/1 32,000
Retained Earnings
Op. Exp. 21,000
Bal. 23,500
Tax 14,910
Bal. 59,090
Sales Revenue
sales 175,000
Merchandise Inventory
Bal. 7,500
Cost of Goods Sold
4/1 84,000
sold 104,300
10/1 32,000
sold 104,300
Bal. 19,200
Operating Expenses
21,000
Income Tax Expense
14,910
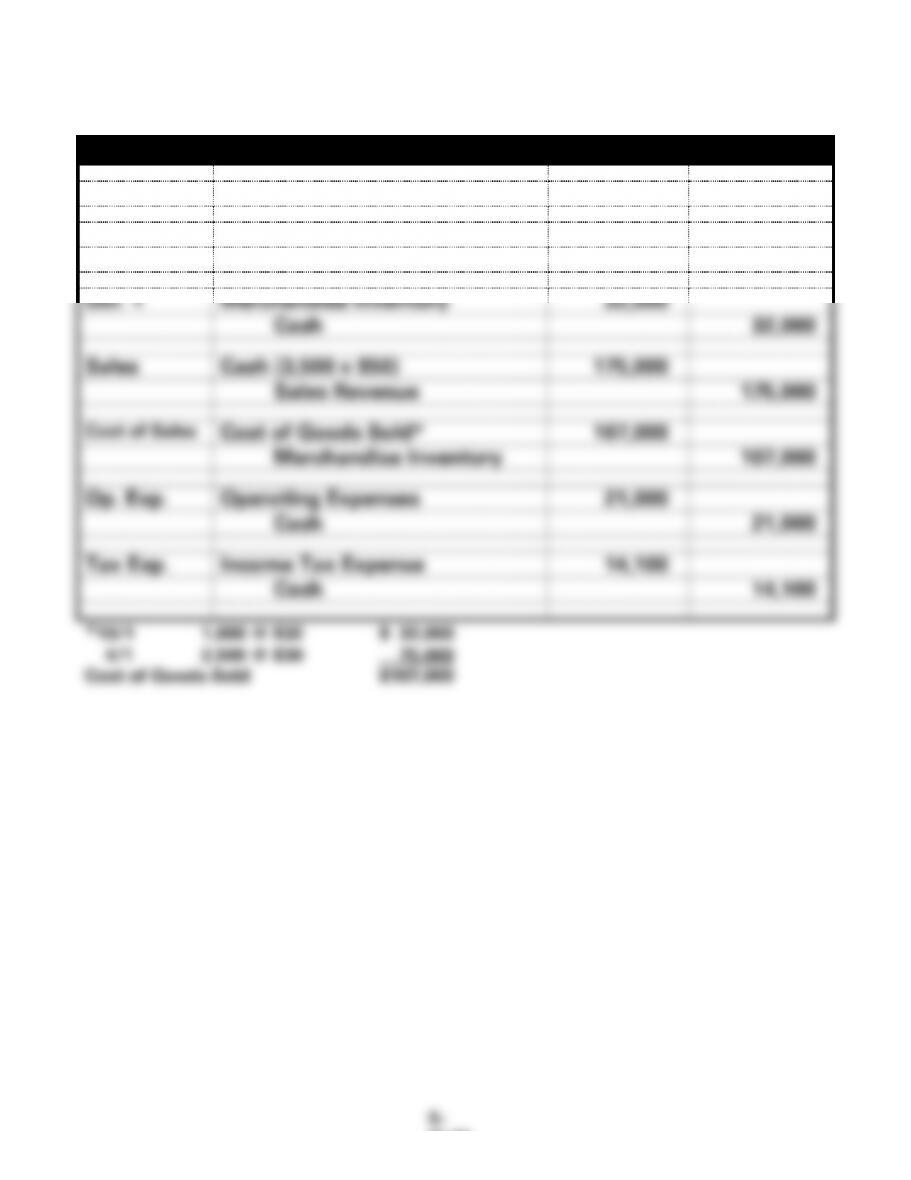
EXERCISE 5-6B a. (cont.)
a. (2) LIFO
Date
Account Title
Debit
Credit
Apr. 1
Merchandise Inventory
84,000
Cash
84,000
Oct. 1
Merchandise Inventory
32,000
Cash
32,000
Sales
Cash (3,500 x $50)
175,000
Sales Revenue
175,000
Cost of Sales
Cost of Goods Sold*
107,000
Merchandise Inventory
107,000
Op. Exp.
Operating Expenses
21,000
Cash
21,000
Tax Exp.
Income Tax Expense
14,100
Cash
14,100
*10/1 1,000 @ $32 $ 32,000
4/1 2,500 @ $30 75,000
Cost of Goods Sold $107,000
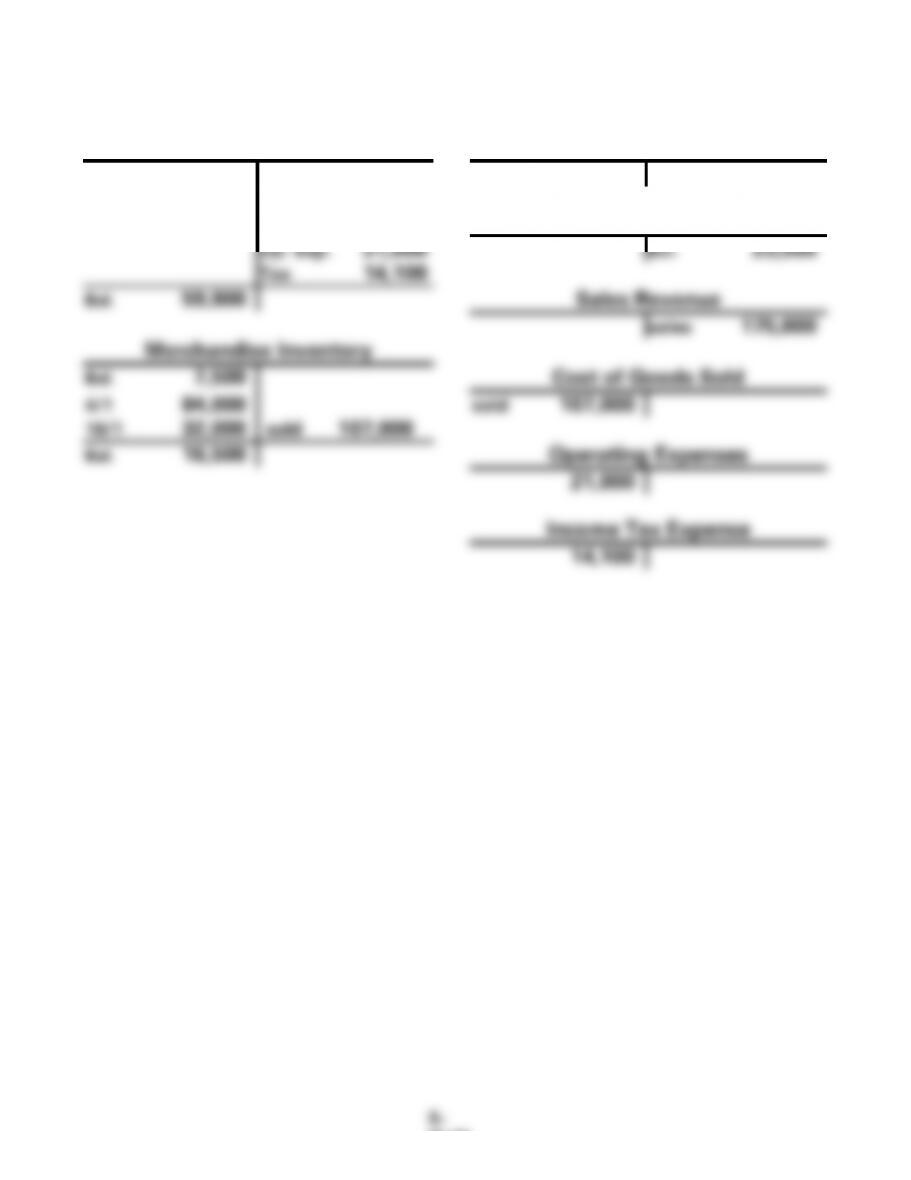
EXERCISE 5-6B a. (cont.)
(2) LIFO
Cash
Common Stock
Bal. 36,000
Bal. 20,000
sales 175,000
4/1 84,000
10/1 32,000
Retained Earnings
Op. Exp. 21,000
Bal. 23,500
Tax 14,100
Bal. 59,900
Sales Revenue
sales 175,000
Merchandise Inventory
Bal. 7,500
Cost of Goods Sold
4/1 84,000
sold 107,000
10/1 32,000
sold 107,000
Bal. 16,500
Operating Expenses
21,000
Income Tax Expense
14,100
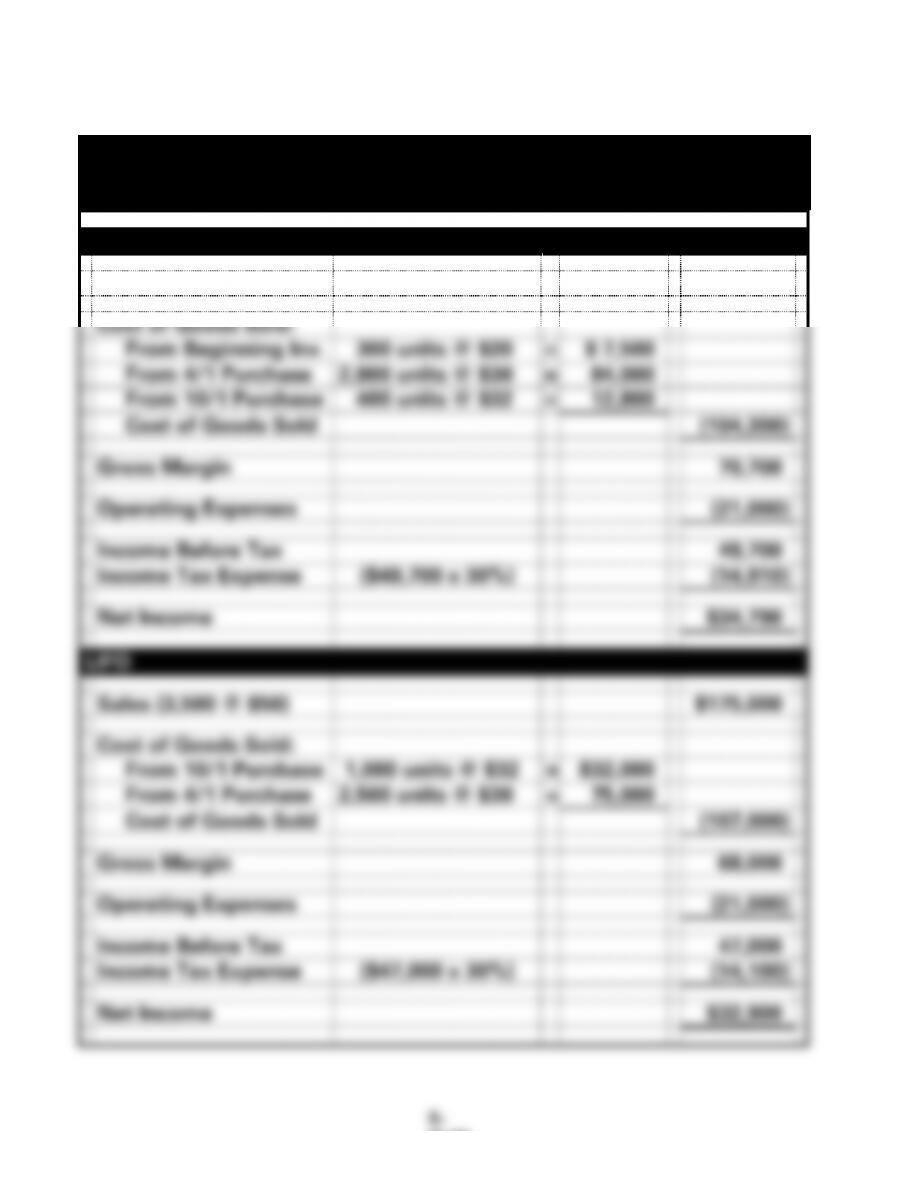
EXERCISE 5-6B (cont.)
b.
Bryant Company
Income Statements
For the Year Ended December 31, 20XX
FIFO
Sales (3,500 @ $50)
$175,000
Cost of Goods Sold:
From Beginning Inv.
300 units @ $20
=
$ 7,500
From 4/1 Purchase
2,800 units @ $30
=
84,000
From 10/1 Purchase
400 units @ $32
=
12,800
Cost of Goods Sold
(104,300)
Gross Margin
70,700
Operating Expenses
(21,000)
Income Before Tax
49,700
Income Tax Expense
($49,700 x 30%)
(14,910)
Net Income
$34,790
LIFO
Sales (3,500 @ $50)
$175,000
Cost of Goods Sold:
From 10/1 Purchase
1,000 units @ $32
=
$32,000
From 4/1 Purchase
2,500 units @ $30
=
75,000
Cost of Goods Sold
(107,000)
Gross Margin
68,000
Operating Expenses
(21,000)
Income Before Tax
47,000
Income Tax Expense
($47,000 x 30%)
(14,100)
Net Income
$32,900
EXERCISE 5-6B (cont.)
c. Income tax savings would be the difference between the tax using
FIFO and the tax using LIFO, or $14,910 − $14,100 = $810.
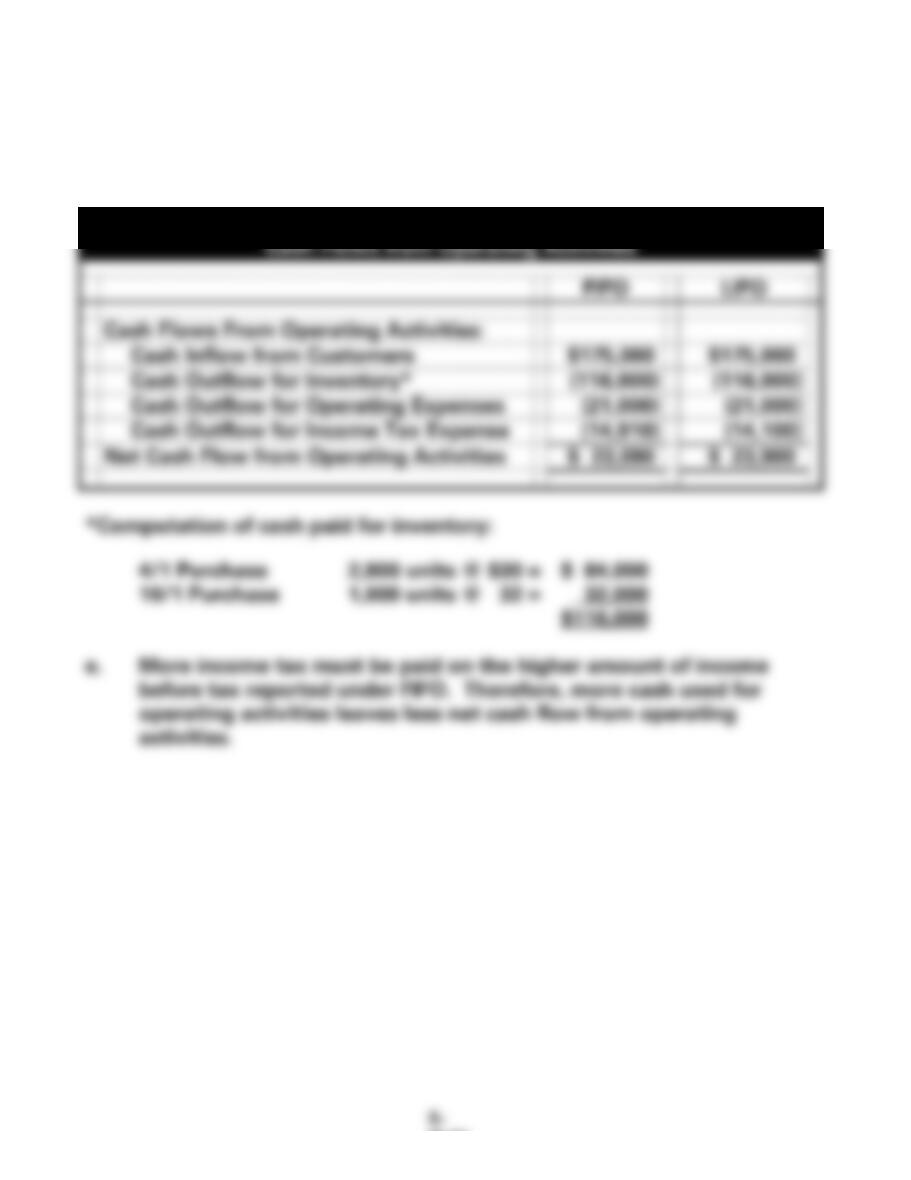
d.
Bryant Company
Cash Flows from Operating Activities
FIFO
LIFO
Cash Flows From Operating Activities:
Cash Inflow from Customers
$175,000
$175,000
Cash Outflow for Inventory*
(116,000)
(116,000)
Cash Outflow for Operating Expenses
(21,000)
(21,000)
Cash Outflow for Income Tax Expense
(14,910)
(14,100)
Net Cash Flow from Operating Activities
$ 23,090
$ 23,900
*Computation of cash paid for inventory:
4/1 Purchase 2,800 units @ $30 = $ 84,000
10/1 Purchase 1,000 units @ 32 = 32,000
$116,000
e. More income tax must be paid on the higher amount of income
before tax reported under FIFO. Therefore, more cash used for
operating activities leaves less net cash flow from operating
activities.
5-82
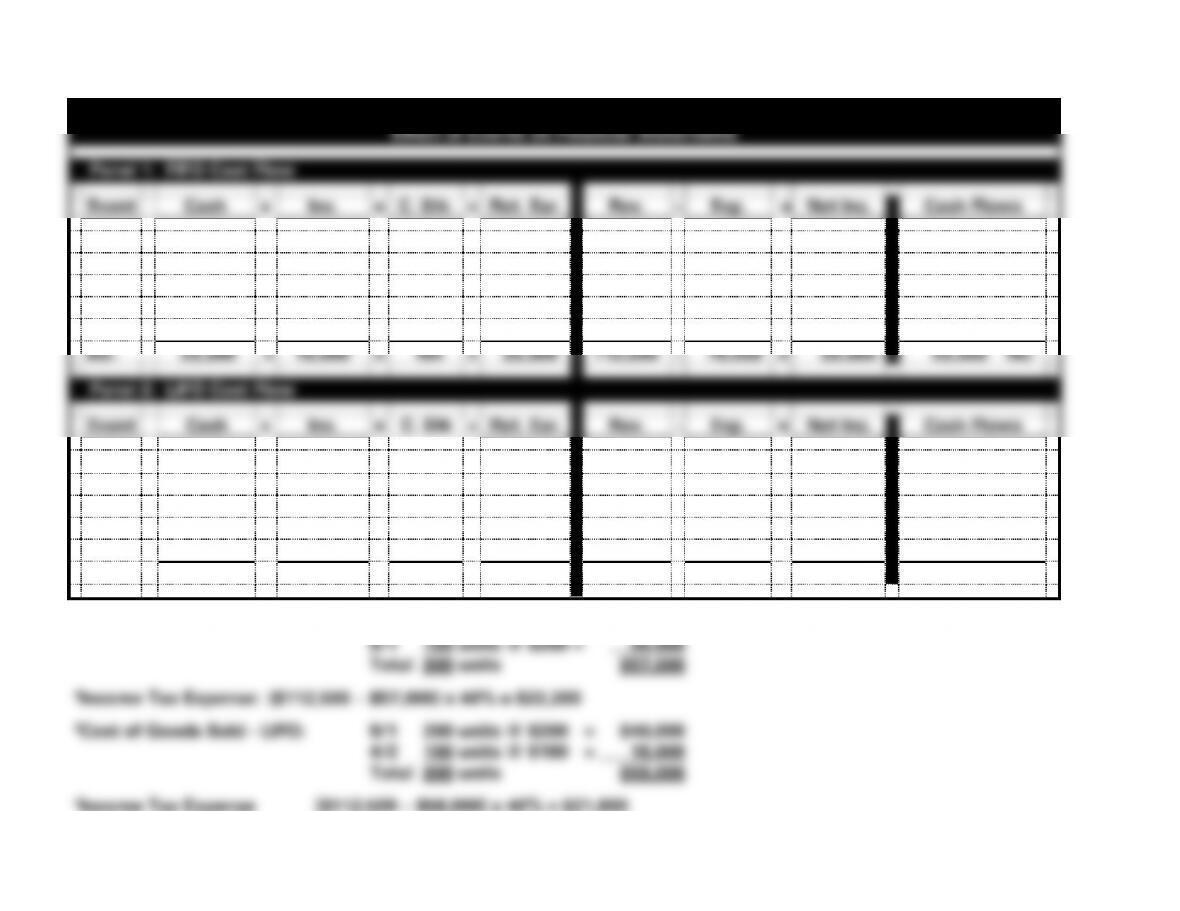
EXERCISE 5-7B a. NC = Net Change in Cash
Home Gifts, Inc.
Effect of Events on Financial Statements
Panel 1: FIFO Cost Flow
Event
Cash
+
Inv.
=
C. Stk.
+
Ret. Ear.
Rev.
−
Exp.
=
Net Inc.
Cash Flows
1.
112,500
+
NA
=
NA
+
112,500
112,500
−
NA
=
112,500
112,500 OA
2.
(27,000)
+
27,000
=
NA
+
NA
NA
−
NA
=
NA
(27,000) OA
3.
(40,000)
+
40,000
=
NA
+
NA
NA
−
NA
=
NA
(40,000) OA
4.
NA
+
(57,000)1
=
NA
+
(57,000)
NA
−
57,000
=
(57,000)
NA
5.
(22,200)2
+
NA
=
NA
+
(22,200)
NA
−
22,200
=
(22,200)
(22,200) OA
Bal.
23,300
+
10,000
=
NA
+
33,300
112,500
−
79,200
=
33,300
23,300 NC
Panel 2: LIFO Cost Flow
Event
Cash
+
Inv.
=
C. Stk
+
Ret. Ear.
Rev.
−
Exp.
=
Net Inc.
Cash Flows
1.
112,500
+
NA
=
NA
+
112,500
112,500
−
NA
=
112,500
112,500 OA
2.
(27,000)
+
27,000
=
NA
+
NA
NA
−
NA
=
NA
(27,000) OA
3.
(40,000)
+
40,000
=
NA
+
NA
NA
−
NA
=
NA
(40,000) OA
4.
NA
+
(58,000)3
=
NA
+
(58,000)
NA
−
58,000
=
(58,000)
NA
5.
(21,800)4
+
NA
=
NA
+
(21,800)
NA
−
21,800
=
(21,800)
(21,800) OA
Bal.
23,700
+
9,000
=
NA
+
32,700
112,500
−
79,800
=
32,700
23,700 NC
1Cost of Goods Sold – FIFO: 4/2 150 units @ $180 = $27,000
5-83
EXERCISE 5-7B (cont.)
b. Net Income assuming FIFO cost flow: $33,300 (see statements model
above).
c. Net Income assuming LIFO cost flow: $32,700 (see statements model
above).
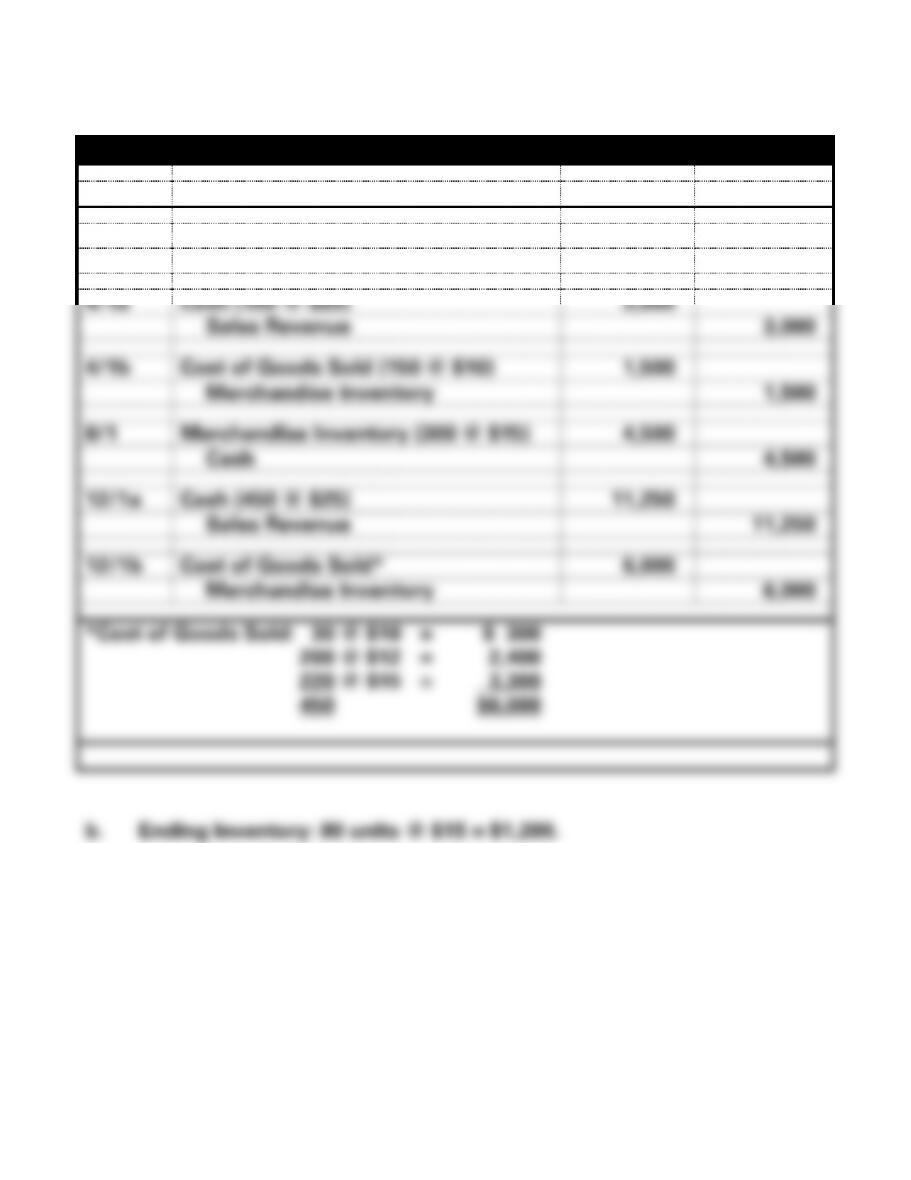
EXERCISE 5-8B
a.
Duncan Steel Company General Journal
Date
Account Titles
Debit
Credit
1/1/11
Merchandise Inventory (200 @ $12)
2,400
Cash
2,400
4/1a
Cash (150 @ $20)
3,000
Sales Revenue
3,000
4/1b
Cost of Goods Sold (150 @ $10)
1,500
Merchandise Inventory
1,500
8/1
Merchandise Inventory (300 @ $15)
4,500
Cash
4,500
12/1a
Cash (450 @ $25)
11,250
Sales Revenue
11,250
12/1b
Cost of Goods Sold*
6,000
Merchandise Inventory
6,000
*Cost of Goods Sold: 30 @ $10 = $ 300
200 @ $12 = 2,400
220 @ $15 = 3,300
450 $6,000
5-85
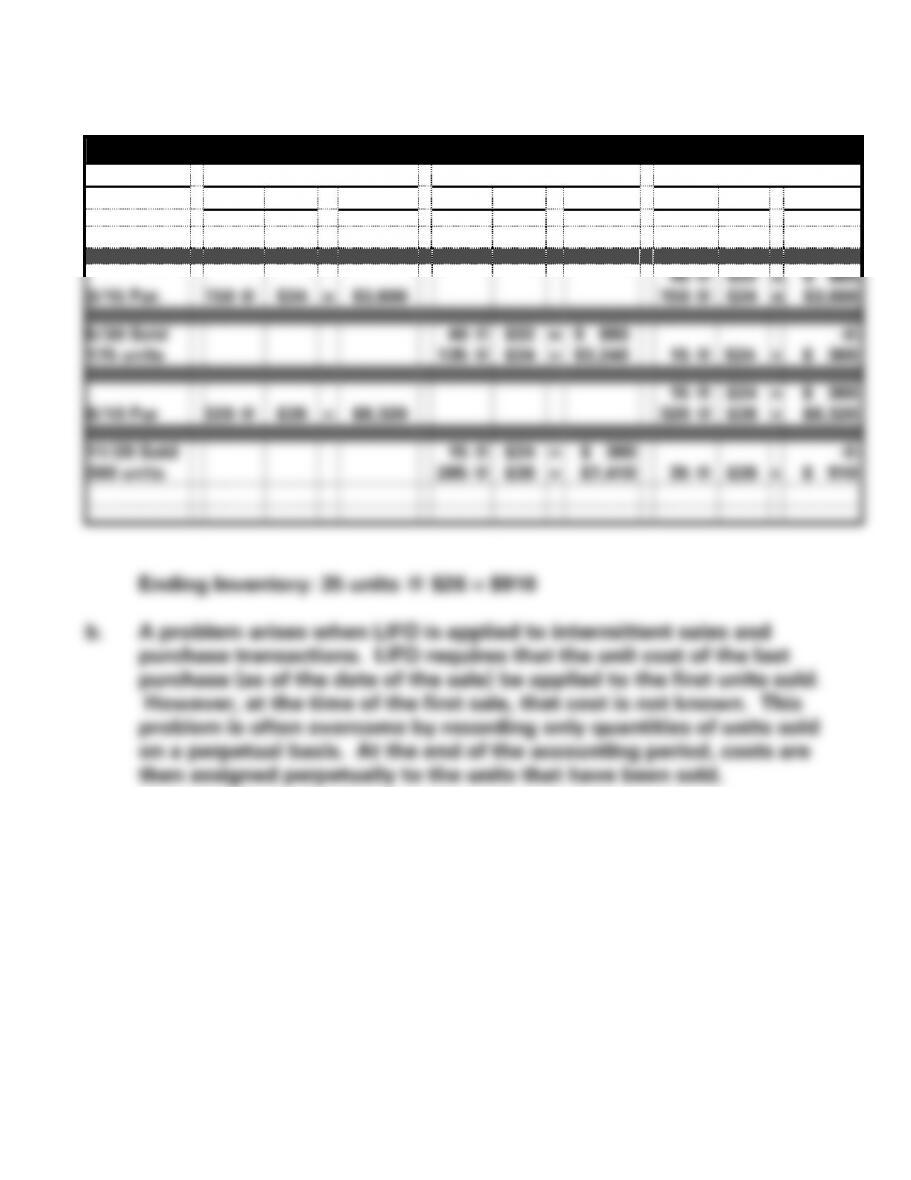
EXERCISE 5-9A
a.
Nash Auto Parts, Inc.
Date
Purchased
Sold
Inventory Balance
Units
Cost
Total
Units
Cost
Total
Units
Cost
Total
1/1 Beg. Inv.
40 @
$22
=
$ 880
3/15 Pur.
150 @
$24
=
$3,600
40 @
150 @
$22
$24
=
=
$ 880
$3,600
5/30 Sold
175 units
40 @
135 @
$22
$24
=
=
$ 880
$3,240
15 @
$24
=
-0-
$ 360
8/10 Pur
320 @
$26
=
$8,320
15 @
320 @
$24
$26
=
=
$ 360
$8,320
11/20 Sold
300 units
15 @
285 @
$24
$26
=
=
$ 360
$7,410
35 @
$26
=
-0-
$ 910
Ending Inventory: 35 units @ $26 = $910
b. A problem arises when LIFO is applied to intermittent sales and
purchase transactions. LIFO requires that the unit cost of the last
purchase (as of the date of the sale) be applied to the first units sold.
However, at the time of the first sale, that cost is not known. This
problem is often overcome by recording only quantities of units sold
on a perpetual basis. At the end of the accounting period, costs are
then assigned perpetually to the units that have been sold.
5-86
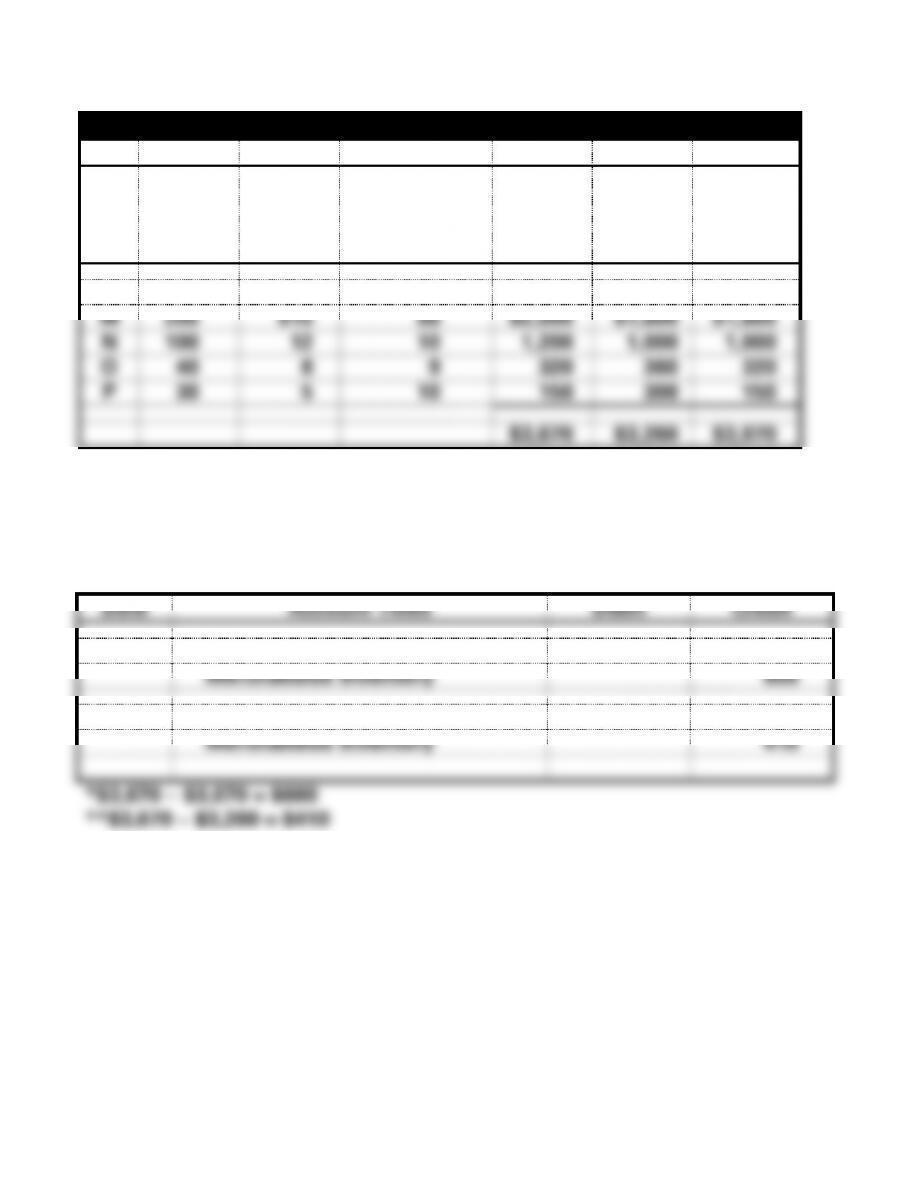
EXERCISE 5-10B
a.
James Hardware
a.
b.
c.
d.
e.
f.
g.
Item
Quantity
Cost Per
Unit
Mkt. Val.
per Unit
Total
Cost
Total
Market
Ind. Item
Lower
Cost/Mkt
.
(b x c)
(b x d)
(e or f)
M
200
$10
$8
$2,000
$1,600
$1,600
N
100
12
10
1,200
1,000
1,000
O
40
8
9
320
360
320
P
30
5
10
150
300
150
$3,670
$3,260
$3,070
(1) Ending inventory using the individual item method: $3,070
(2) Ending inventory using the aggregate method: $3,260
b.
Date
Account Titles
Debit
Credit
(1)
Cost of Goods Sold*
600
Merchandise Inventory
600
(2)
Cost of Goods Sold**
410
Merchandise Inventory
410