5-46
PROBLEM 5-18A (cont.)
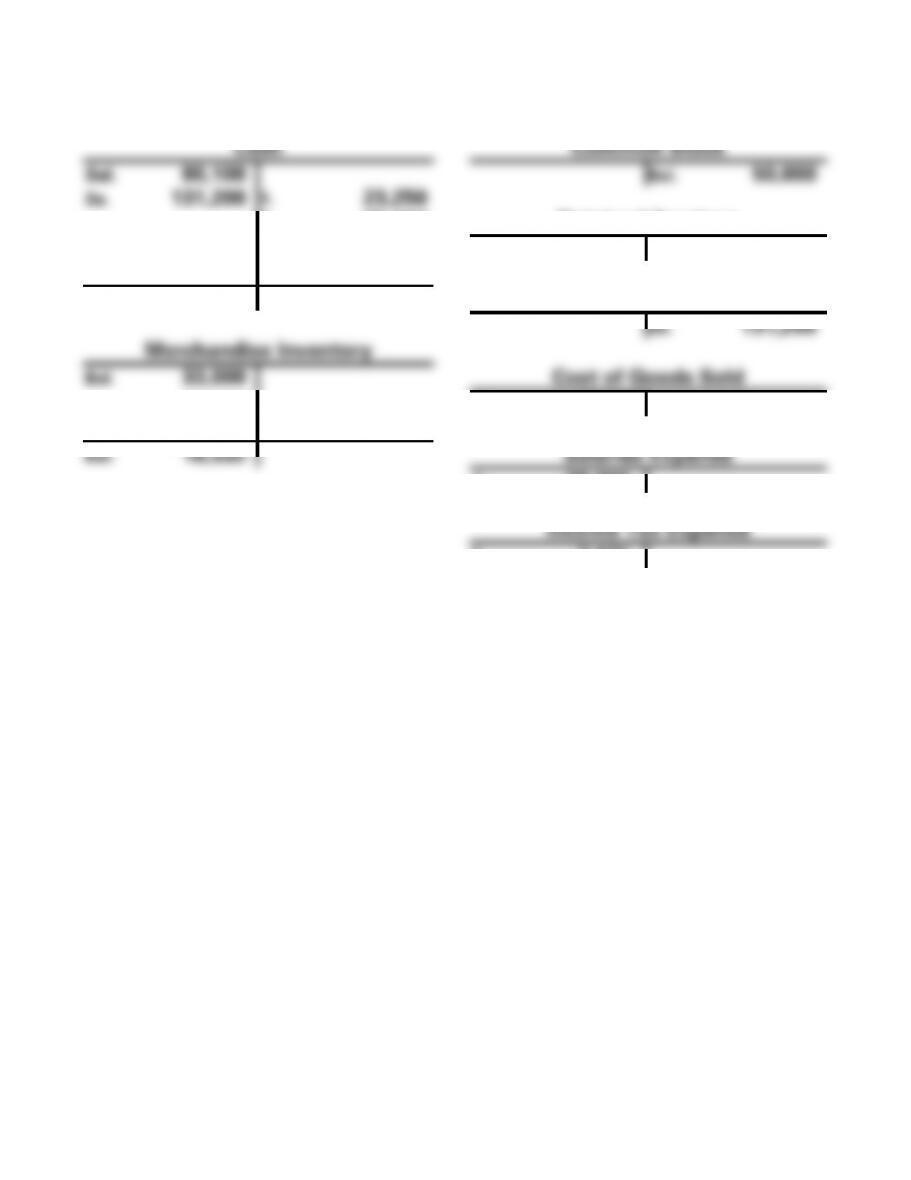
b. (3) Weighted Average
Cash
Common Stock
Bal. 80,100
Bal. 50,000
3a. 131,200
1. 23,250
2. 25,600
Retained Earnings
4. 38,000
Bal. 63,100
5. 7,471
Bal. 116,979
Sales Revenue
3a. 131,200
Merchandise Inventory
Bal. 33,000
Cost of Goods Sold
1. 23,250
3b. 63,318
2. 25,600
3b. 63,318
Bal. 18,532
Salaries Expense
4. 38,000
Income Tax Expense
5. 7,471
5-47
PROBLEM 5-18A (cont.)
c.
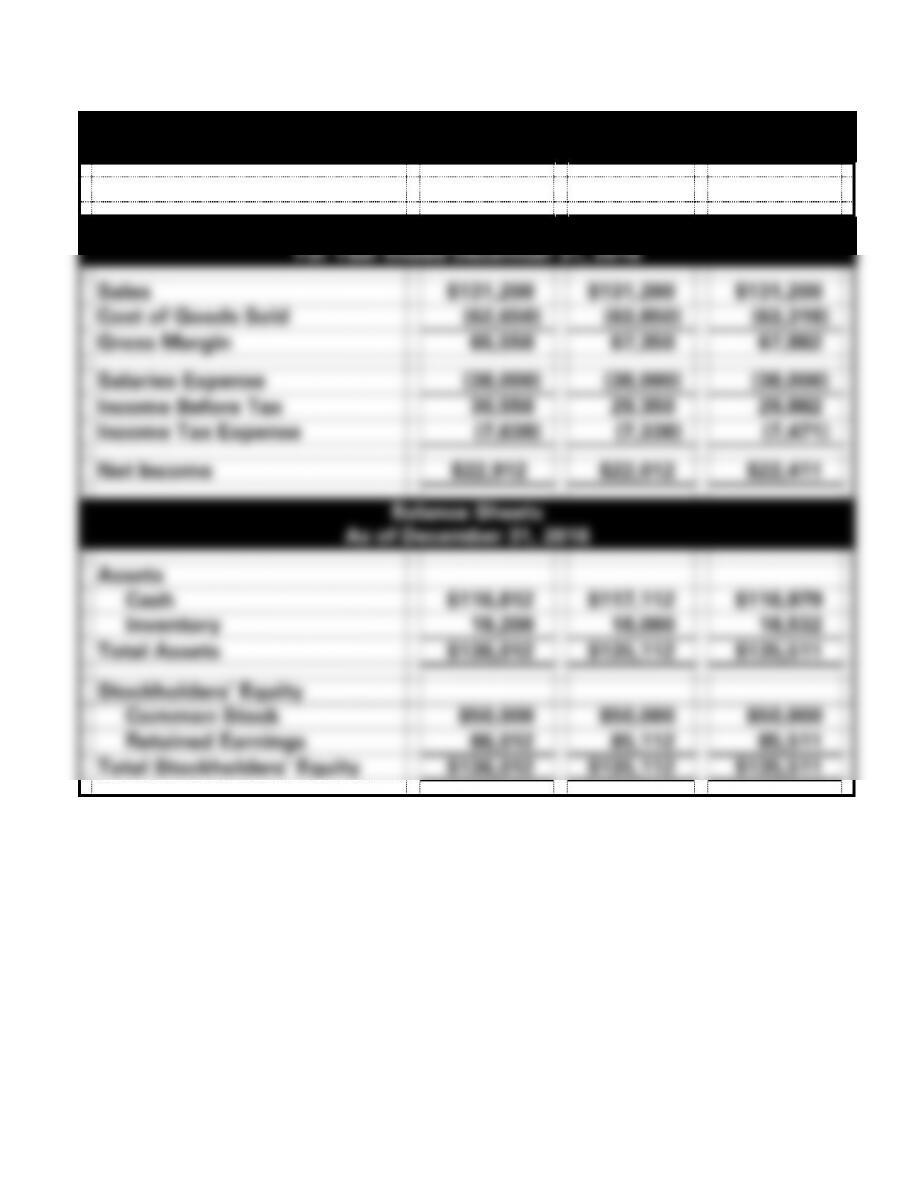
Wall’s China Shop
Financial Statements
FIFO
LIFO
Weight. Av.
Income Statements
For Year Ended December 31, 2016
Sales
$131,200
$131,200
$131,200
Cost of Goods Sold
(62,650)
(63,850)
(63,318)
Gross Margin
65,550
67,350
67,882
Salaries Expense
(38,000)
(38,000)
(38,000)
Income Before Tax
30,550
29,350
29,882
Income Tax Expense
(7,638)
(7,338)
(7,471)
Net Income
$22,912
$22,012
$22,411
Balance Sheets
As of December 31, 2016
Assets
Cash
$116,812
$117,112
$116,979
Inventory
19,200
18,000
18,532
Total Assets
$136,012
$135,112
$135,511
Stockholders’ Equity
Common Stock
$50,000
$50,000
$50,000
Retained Earnings
86,012
85,112
85,511
Total Stockholders’ Equity
$136,012
$135,112
$135,511
5-48
PROBLEM 5-18A c. (cont.)
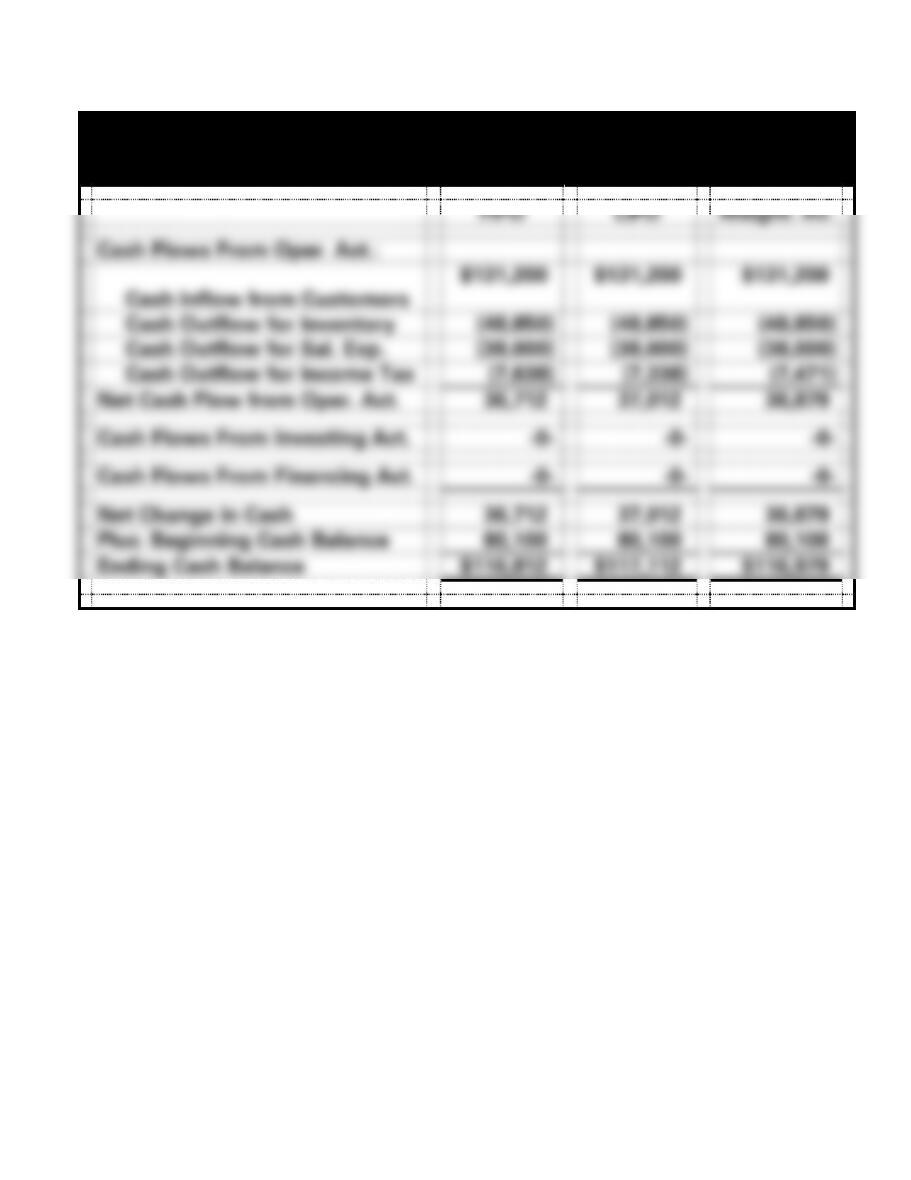
Wall’s China Shop
Statements of Cash Flows
For the Year Ended December 31, 2016
FIFO
LIFO
Weight. Av.
Cash Flows From Oper. Act.:
Cash Inflow from Customers
$131,200
$131,200
$131,200
Cash Outflow for Inventory
(48,850)
(48,850)
(48,850)
Cash Outflow for Sal. Exp.
(38,000)
(38,000)
(38,000)
Cash Outflow for Income Tax
(7,638)
(7,338)
(7,471)
Net Cash Flow from Oper. Act.
36,712
37,012
36,879
Cash Flows From Investing Act.
-0-
-0-
-0-
Cash Flows From Financing Act.
-0-
-0-
-0-
Net Change in Cash
36,712
37,012
36,879
Plus: Beginning Cash Balance
80,100
80,100
80,100
Ending Cash Balance
$116,812
$117,112
$116,979
5-49
PROBLEM 5-19A
Provided for the use of the instructor:
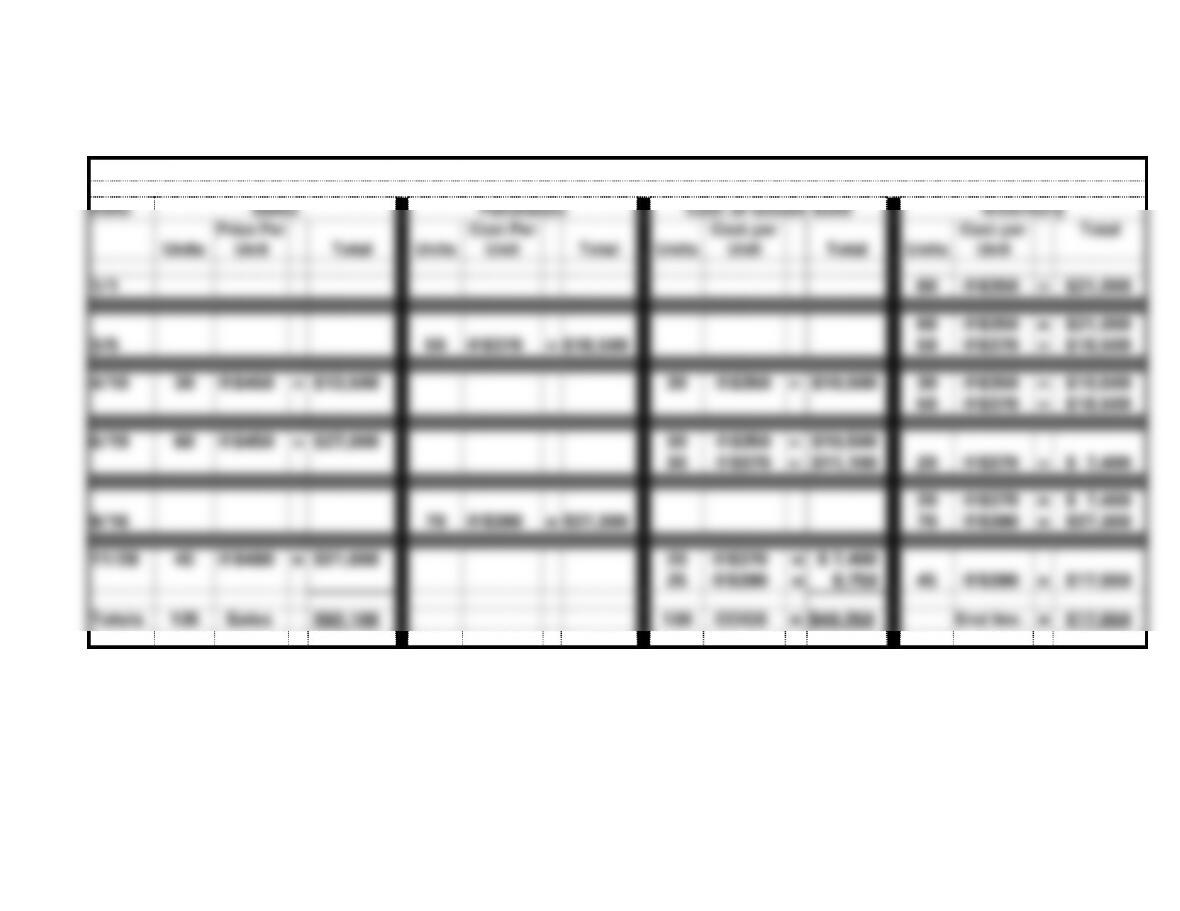
Pam’s Creations
Sales and Purchase Transactions for 2016
Date
Sales
Purchases
Cost of Goods Sold
Inventory
Units
Price Per
Unit
Total
Units
Cost Per
Unit
Total
Units
Cost per
Unit
Total
Units
Cost per
Unit
Total
1/1
60
@$350
=
$21,000
3/5
50
@$370
=
$18,500
60
50
@$350
@$370
=
=
$21,000
$18,500
4/10
30
@$450
=
$13,500
30
@$350
=
$10,500
30
50
@$350
@$370
=
=
$10,500
$18,500
6/19
60
@$450
=
$27,000
30
30
@$350
@$370
=
=
$10,500
$11,100
20
@$370
=
$ 7,400
9/16
70
@$390
=
$27,300
20
70
@$370
@$390
=
=
$ 7,400
$27,300
11/28
45
@$480
=
$21,600
20
25
@$370
@$390
=
=
$ 7,400
9,750
45
@$390
=
$17,550
Totals
135
Sales
$62,100
130
COGS
=
$49,250
End Inv.
=
$17,550
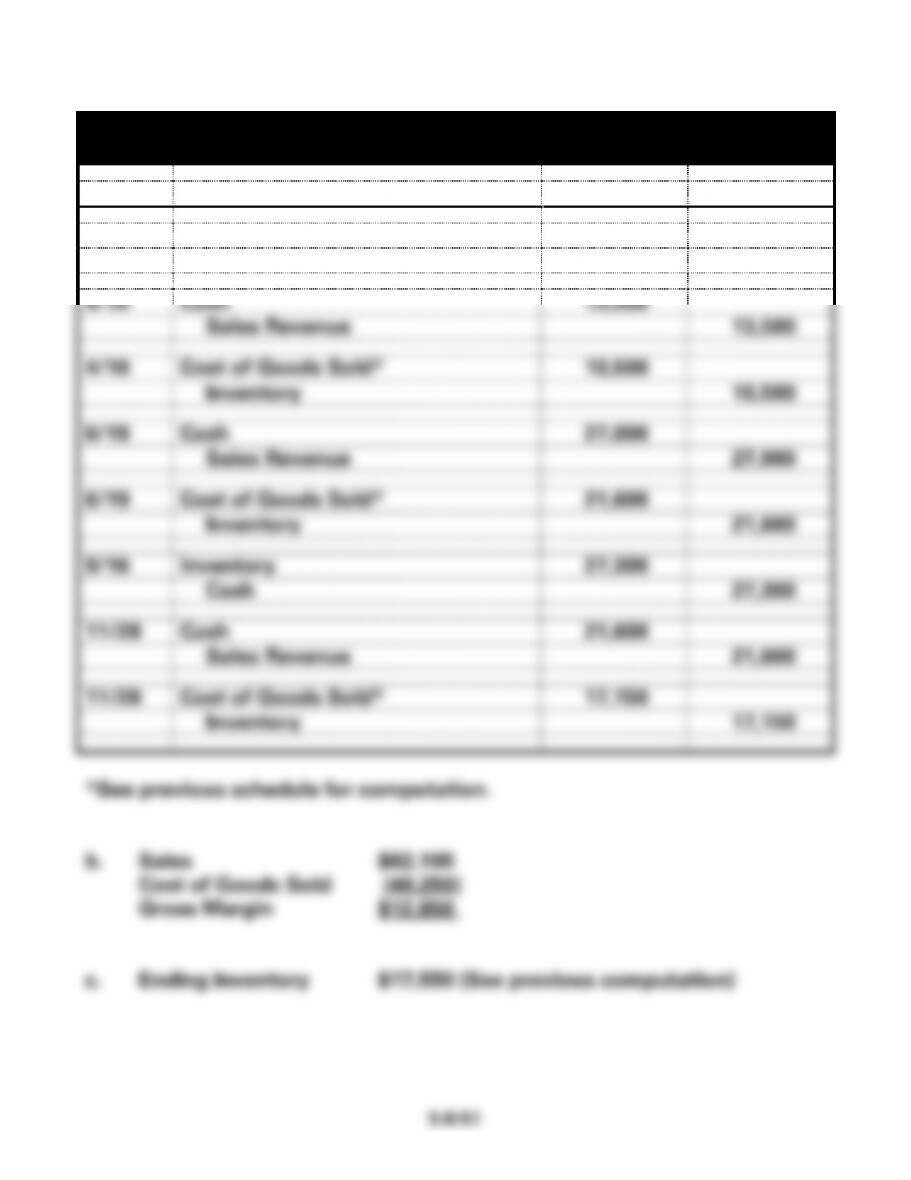
PROBLEM 5-19A (cont.)
a.
Pam’s Creations
General Journal, 2016
Date
Account Titles
Debit
Credit
3/5
Inventory
18,500
Cash
18,500
4/10
Cash
13,500
Sales Revenue
13,500
4/10
Cost of Goods Sold*
10,500
Inventory
10,500
6/19
Cash
27,000
Sales Revenue
27,000
6/19
Cost of Goods Sold*
21,600
Inventory
21,600
9/16
Inventory
27,300
Cash
27,300
11/28
Cash
21,600
Sales Revenue
21,600
11/28
Cost of Goods Sold*
17,150
Inventory
17,150
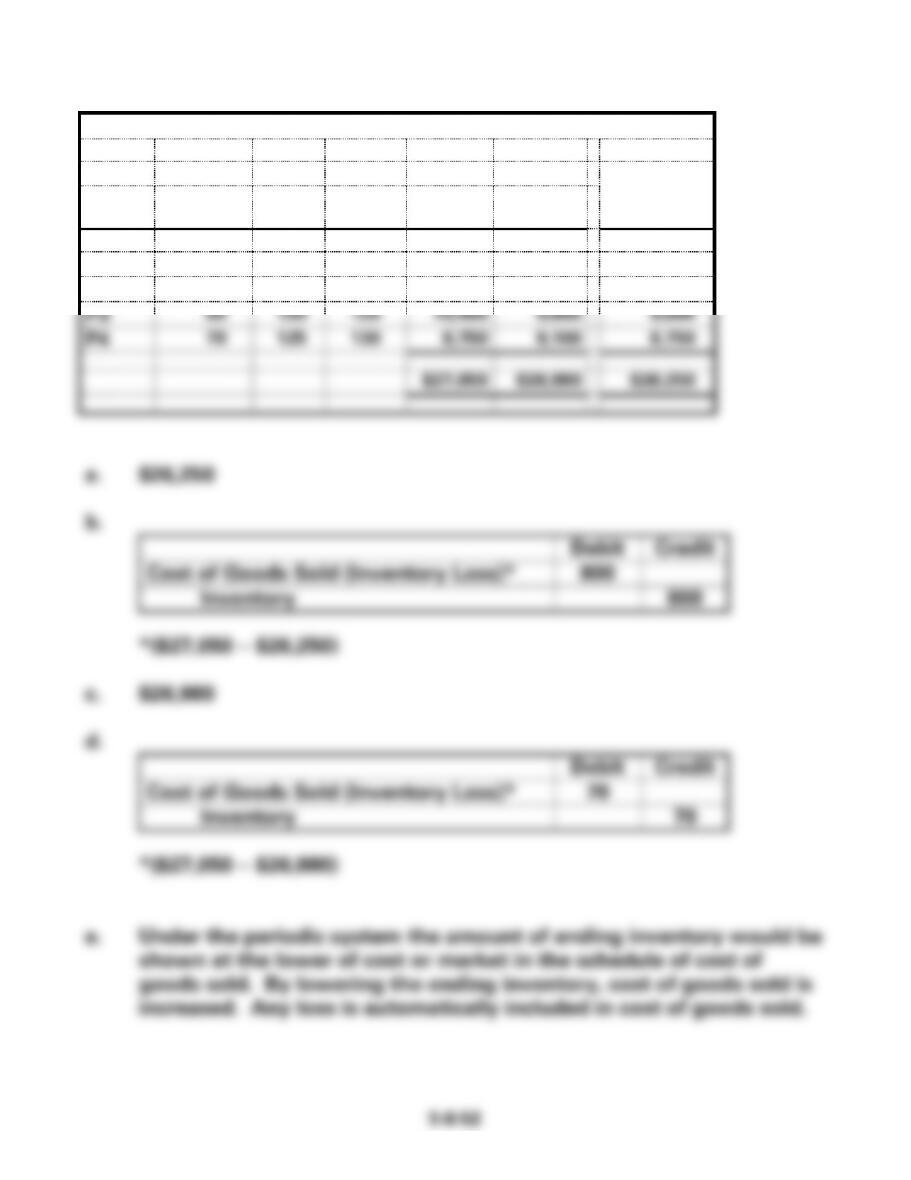
PROBLEM 5-20A
Randy’s Parts Co.
Ind. Item
Item
Quantity
Unit
Cost
Unit
Market
Total
Cost
Total
Market
Lower of
Cost/Mkt.
P1
60
$85
$90
$ 5,100
$ 5,400
$ 5,100
P2
40
70
72
2,800
2,880
2,800
P3
80
130
120
10,400
9,600
9,600
P4
70
125
130
8,750
9,100
8,750
$27,050
$26,980
$26,250
a. $26,250
b.
Debit
Credit
Cost of Goods Sold (Inventory Loss)*
800
Inventory
800
*($27,050 − $26,250)
c. $26,980
d.
Debit
Credit
Cost of Goods Sold (Inventory Loss)*
70
Inventory
70
*($27,050 − $26,980)
e. Under the periodic system the amount of ending inventory would be
shown at the lower of cost or market in the schedule of cost of
goods sold. By lowering the ending inventory, cost of goods sold is
increased. Any loss is automatically included in cost of goods sold.
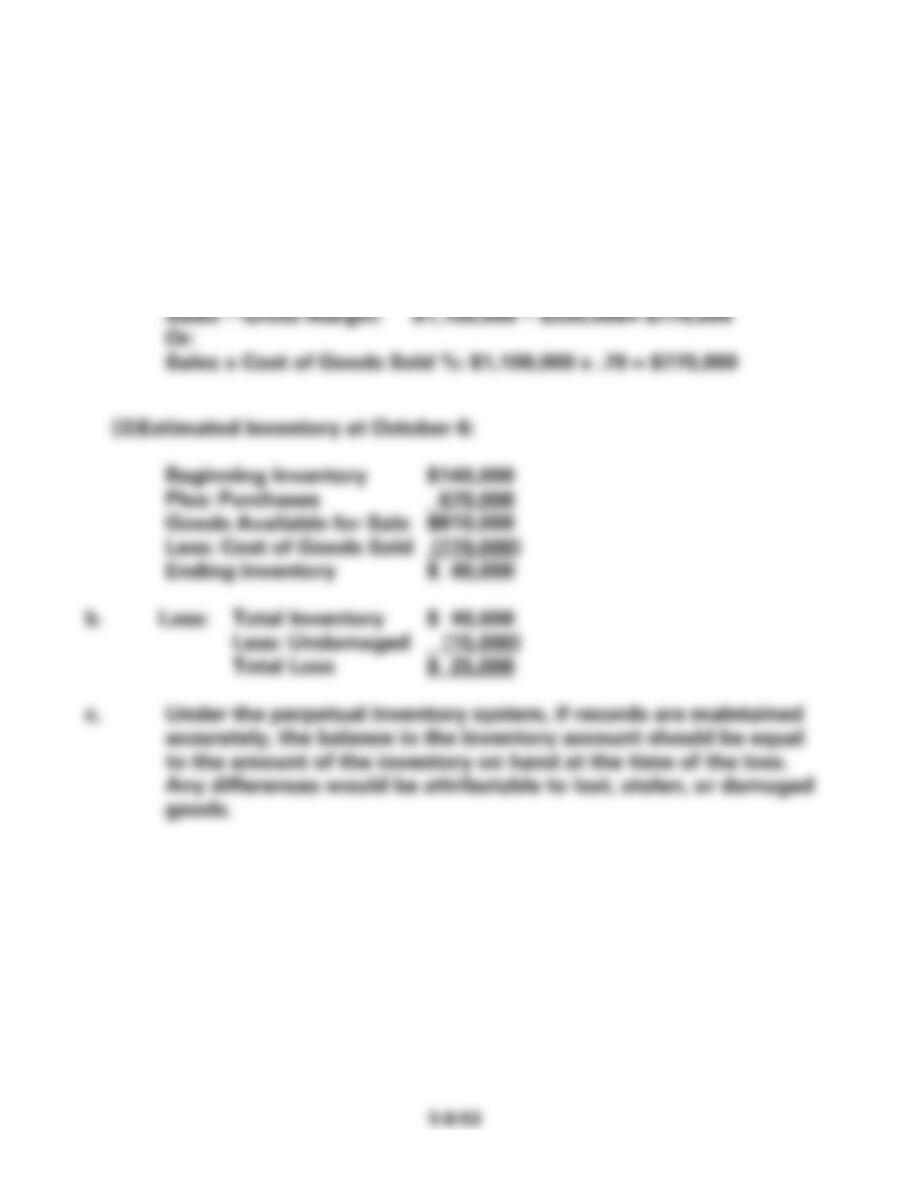
PROBLEM 5-21A
Don’s Grocery
a. (1) Estimated Gross Margin:
Sales x Gross Margin %: $1,100,000 x .30 = $330,000
(2) Estimated Cost of Goods Sold:
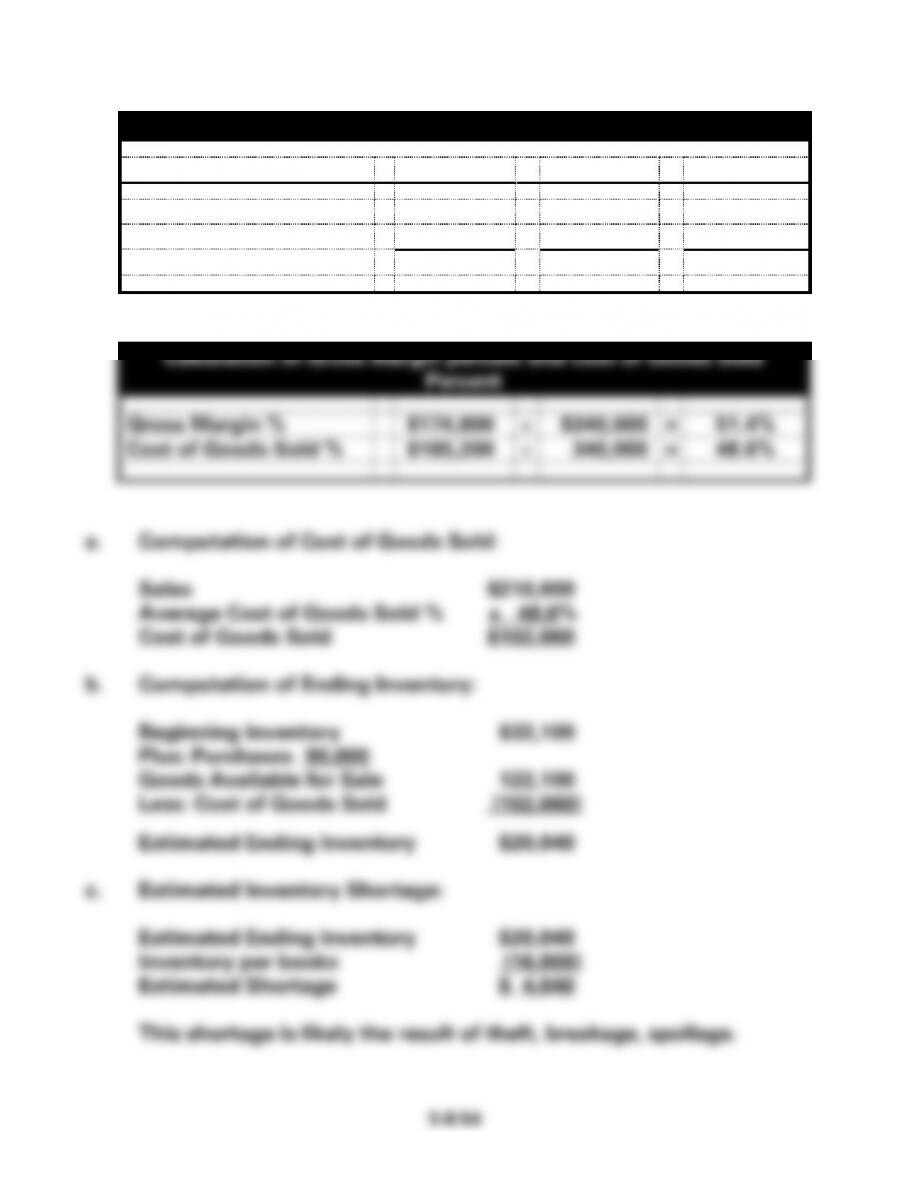
PROBLEM 5-22A
Toyland
2016
2017
Total
Net Sales
$150,000
$190,000
$340,000
Cost of Goods Sold
(76,000)
(89,200)
(165,200)
Gross Margin
$ 74,000
$100,800
$174,800
Calculation of Gross Margin percent and Cost of Goods Sold
Percent
Gross Margin %
$174,800
$340,000
=
51.4%
Cost of Goods Sold %
$165,200
340,000
=
48.6%
a. Computation of Cost of Goods Sold:
Sales $210,000
Average Cost of Goods Sold % x 48.6%
Cost of Goods Sold $102,060
b. Computation of Ending Inventory:
Beginning Inventory $32,100
Plus: Purchases 90,000
Goods Available for Sale 122,100
Less: Cost of Goods Sold (102,060)
Estimated Ending Inventory $20,040
c. Estimated Inventory Shortage:
Estimated Ending Inventory $20,040
Inventory per books (16,000)
Estimated Shortage $ 4,040
This shortage is likely the result of theft, breakage, spoilage.
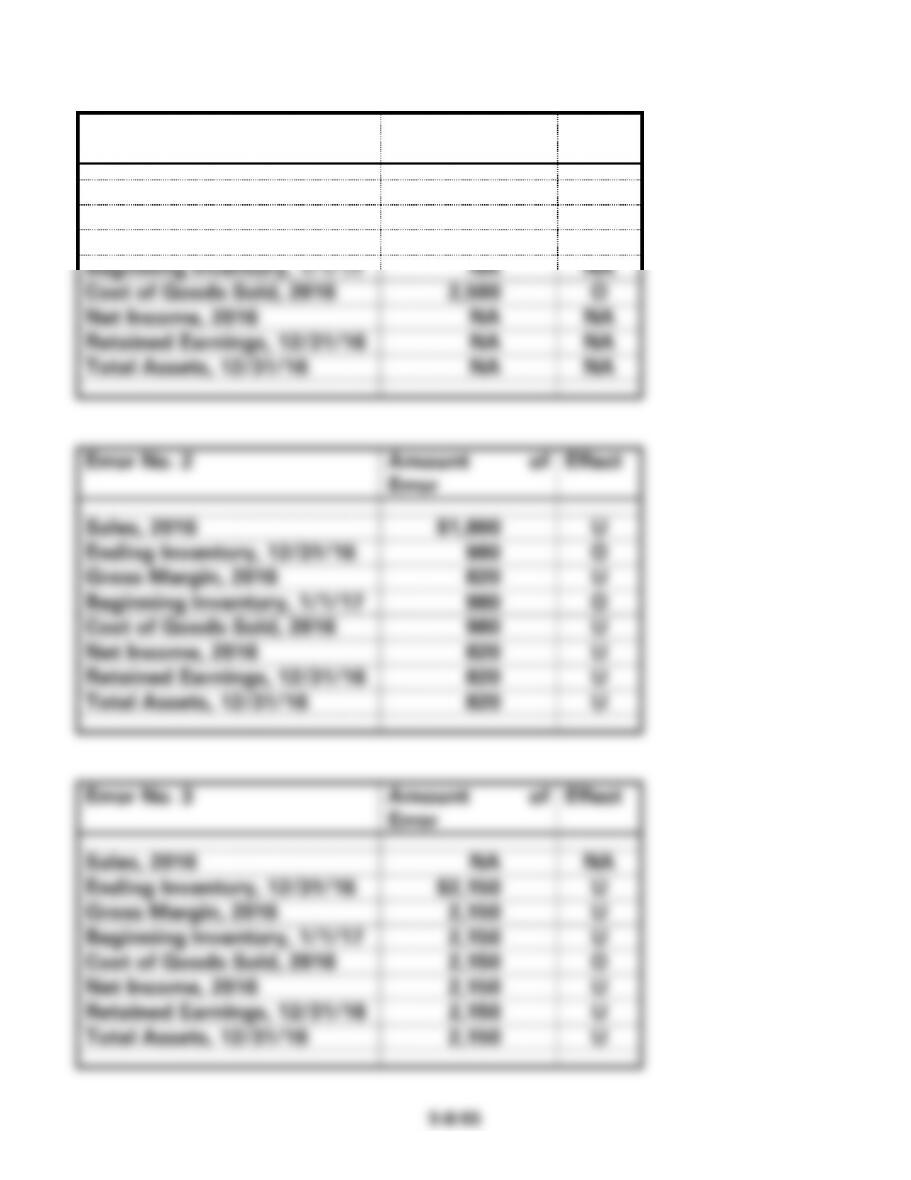
PROBLEM 5-23A
Error No.1
Amount of
Error
Effect
Sales, 2016
NA
NA
Ending Inventory, 12/31/16
NA
NA
Gross Margin, 2016
$2,500
U
Beginning Inventory, 1/1/17
NA
NA
Cost of Goods Sold, 2016
2,500
O
Net Income, 2016
NA
NA
Retained Earnings, 12/31/16
NA
NA
Total Assets, 12/31/16
NA
NA
Error No. 2
Amount of
Error
Effect
Sales, 2016
$1,800
U
Ending Inventory, 12/31/16
980
O
Gross Margin, 2016
820
U
Beginning Inventory, 1/1/17
980
O
Cost of Goods Sold, 2016
980
U
Net Income, 2016
820
U
Retained Earnings, 12/31/16
820
U
Total Assets, 12/31/16
820
U
Error No. 3
Amount of
Error
Effect
Sales, 2016
NA
NA
Ending Inventory, 12/31/16
$2,150
U
Gross Margin, 2016
2,150
U
Beginning Inventory, 1/1/17
2,150
U
Cost of Goods Sold, 2016
2,150
O
Net Income, 2016
2,150
U
Retained Earnings, 12/31/16
2,150
U
Total Assets, 12/31/16
2,150
U
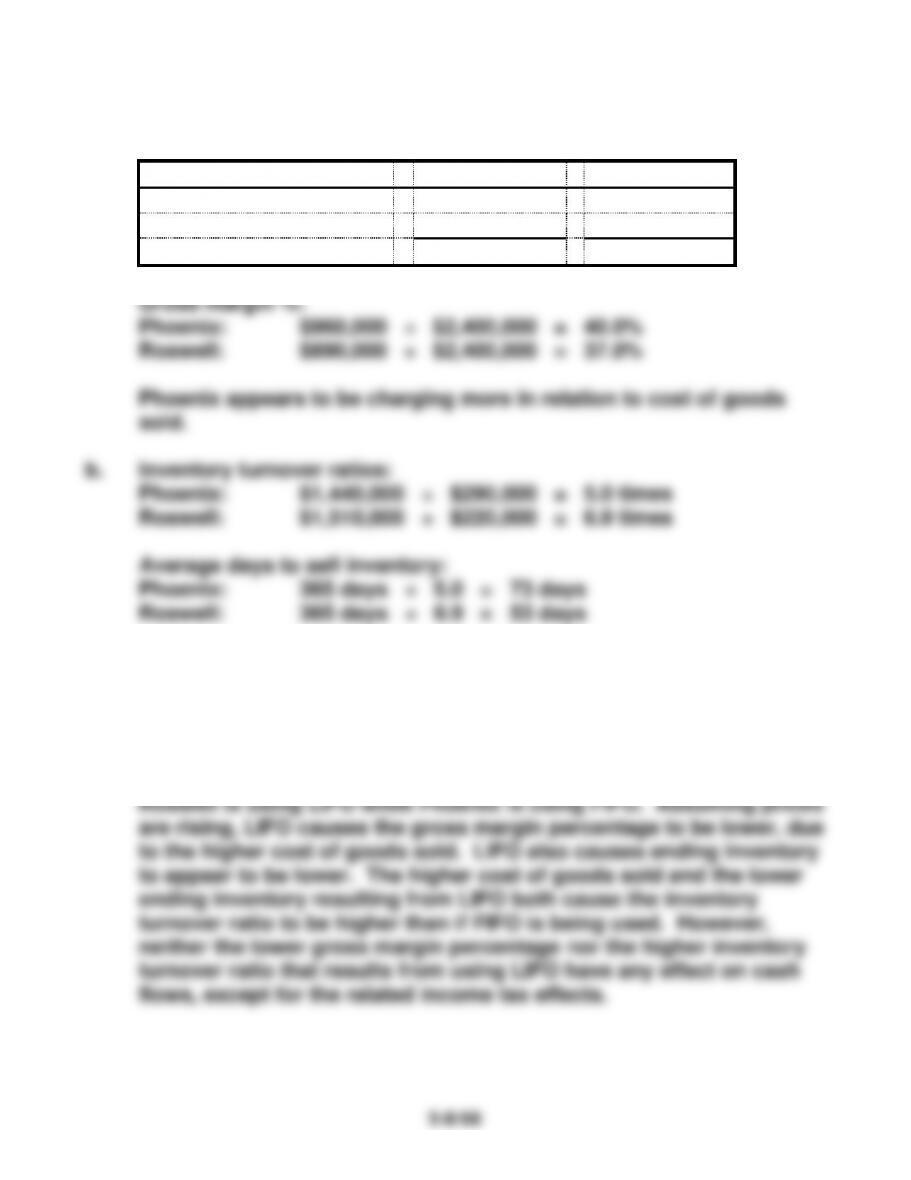
PROBLEM 5-24A
a. First the company’s gross margins must be calculated:
Phoenix
Roswell
Sales
$2,400,000
$2,400,000
Cost of Goods Sold
(1,440,000)
(1,510,000)
Gross Margin
$ 960,000
$ 890,000
Phoenix appears to incur the higher costs to finance inventory
because it takes a longer time to sell its inventory.
c. Other things being equal, this would indicate a company sells its
product at a lower price. The lower the price, the more quickly
goods should sell. “Other things” are not equal in this problem.
5-II–57
A. ATC 5-1 (All dollar amounts are in millions.)
a. Inventory turnover:
2013 $51,160 ÷ $8,766 = 5.8 times
2012 $50,568 ÷ $7,903 = 6.4 times
Average days to sell inventory:
2013 365 days ÷ 5.8 = 63 days
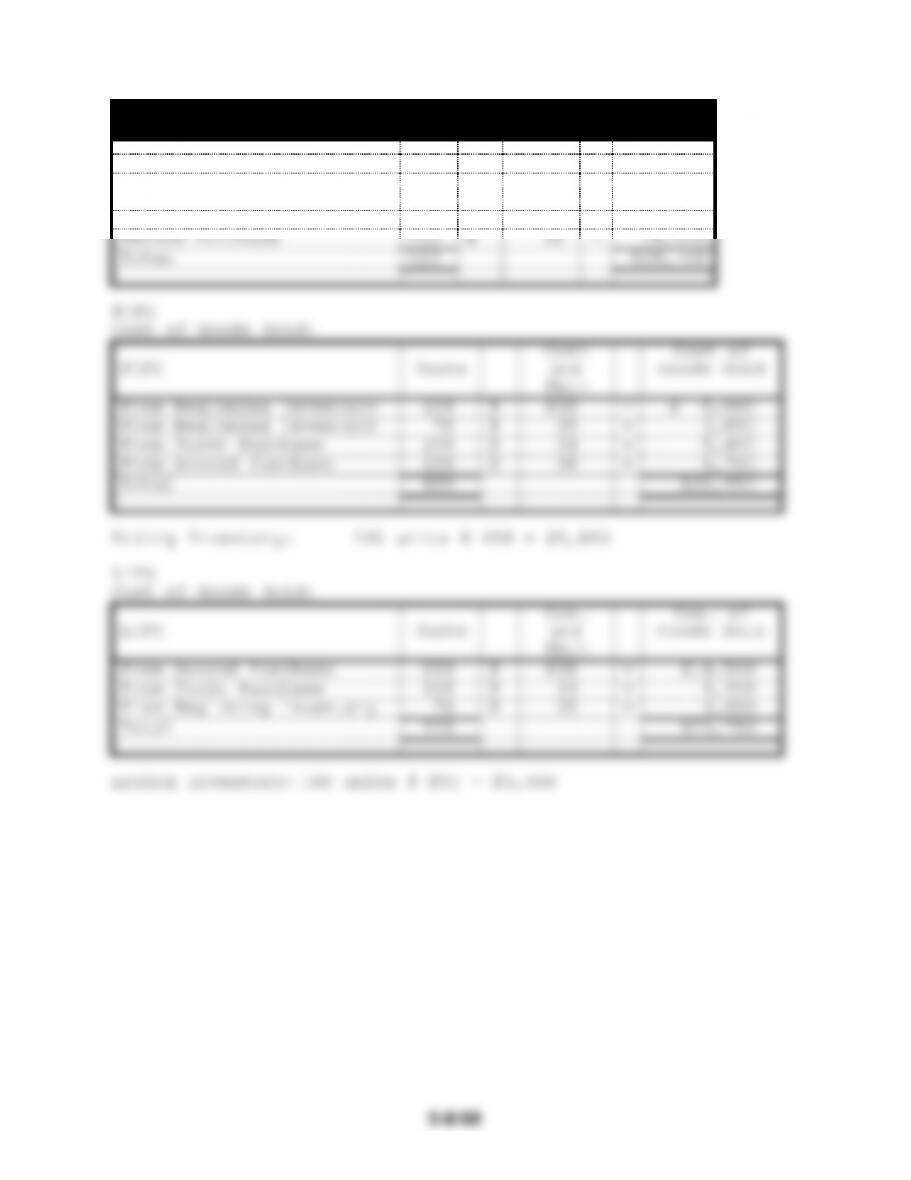
ATC 5-2
a.
Blue Bird Co.
Inventory Purchases
Beginning Inventory
100
@
$50
=
$ 5,000
70
@
55
=
3,850
First Purchase
100
@
54
=
5,400
Second Purchase
250
@
58
=
14,500
Total
520
$28,750
From Beginning Inventory
@
=
From Beginning Inventory
@
=
From First Purchase
@
=
From Second Purchase
@
=
Total
$22,950
From Second Purchase
@
=
$14,500
From First Purchase
@
=
@
=
Total
$23,750
ATC 5-2 a. (cont.)
Weighted Average
Total Cost
Total Units
=
Cost per Unit
$28,750
520
=
$55.288
Cost of Goods Sold
420 units
@
$55.288
=
$23,221
Ending Inventory
100 units
@
$55.288
=
$5,529
Blue Bird Company
Income Statements
FIFO
LIFO
Weighted
Average
Sales (220 @$80; 200 @ $90)
$35,600
$35,600
$35,600
Cost of Goods Sold
(22,950)
(23,750)
(23,221)
Gross Margin
12,650
11,850
12,379
Operating Expenses
(3,200)
(3,200)
(3,200)
Income Before Tax
9,450
8,650
9,179
Income Tax (30%)
(2,835)
(2,595)
(2,754)
Net Income
$ 6,615
$ 6,055
$ 6,425
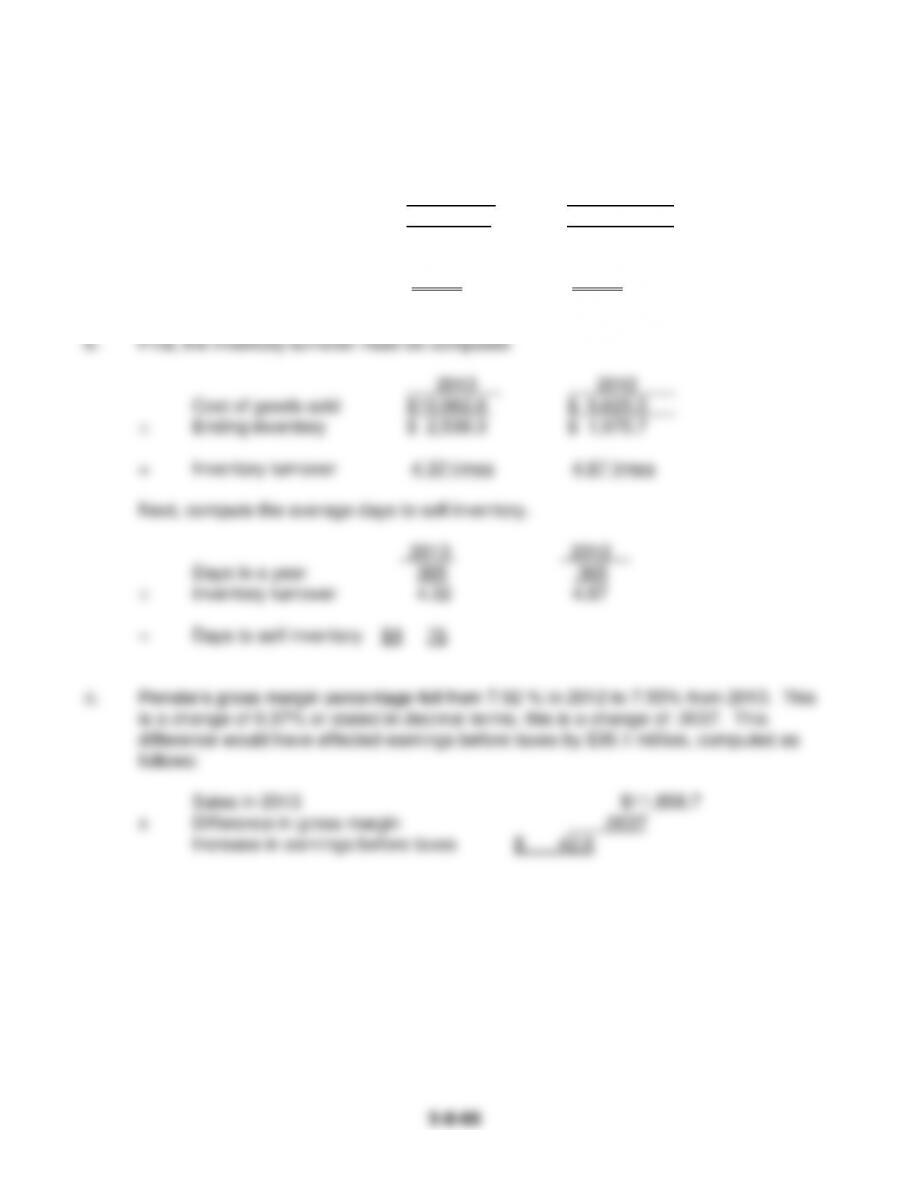
ATC 5-3
All dollar amounts are in millions.
a.
2013 2012
Gross margin $ 895.9 $ 828.3
÷ Sales $11,858.7 $ 10,453.8
= Gross margin percentage 7.55% 7.92%
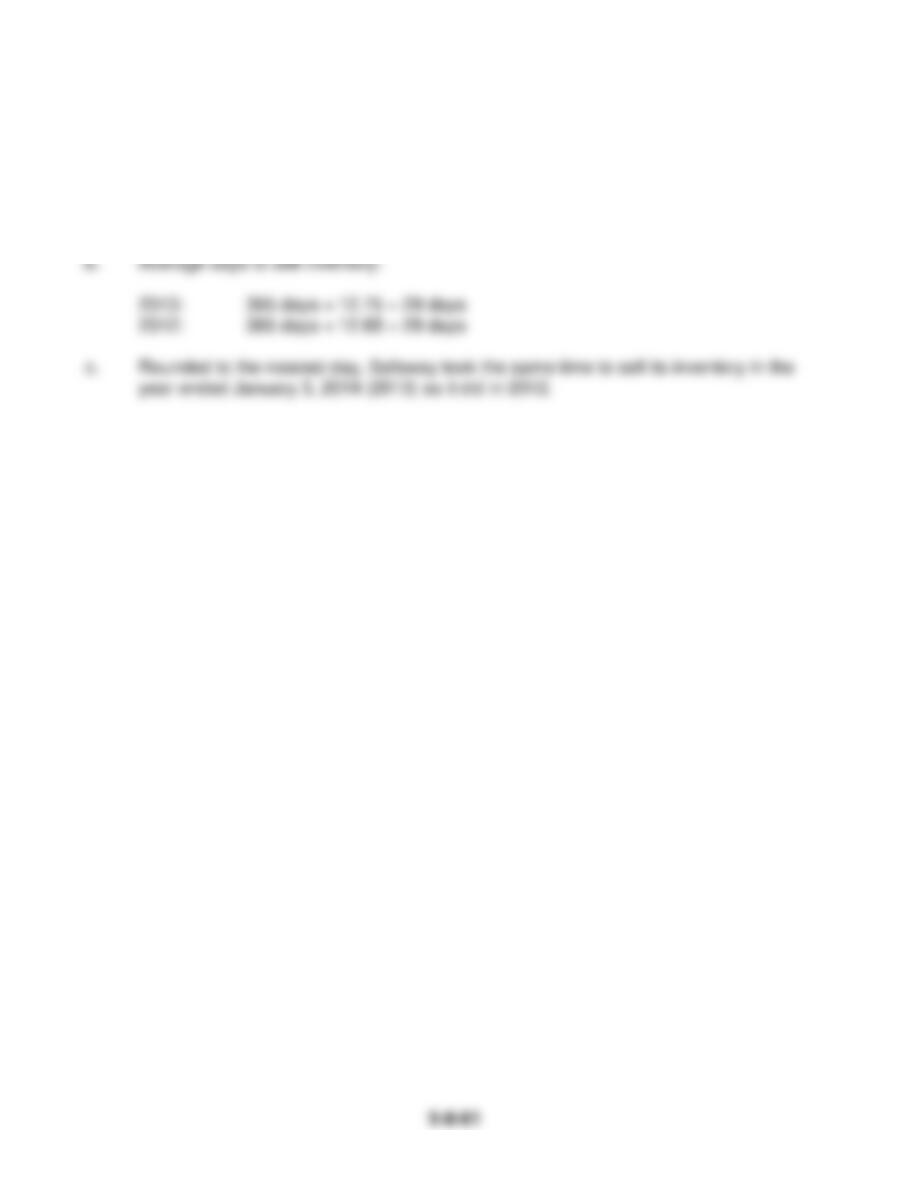
ATC 5-4
Dollars are in millions.
a. Inventory turnover:
2013: $26,645.1 ÷ $2,089.6 = 12.75 times
2012: $32,486.5 ÷ $2,562.0 = 12.68 times
5-II–62
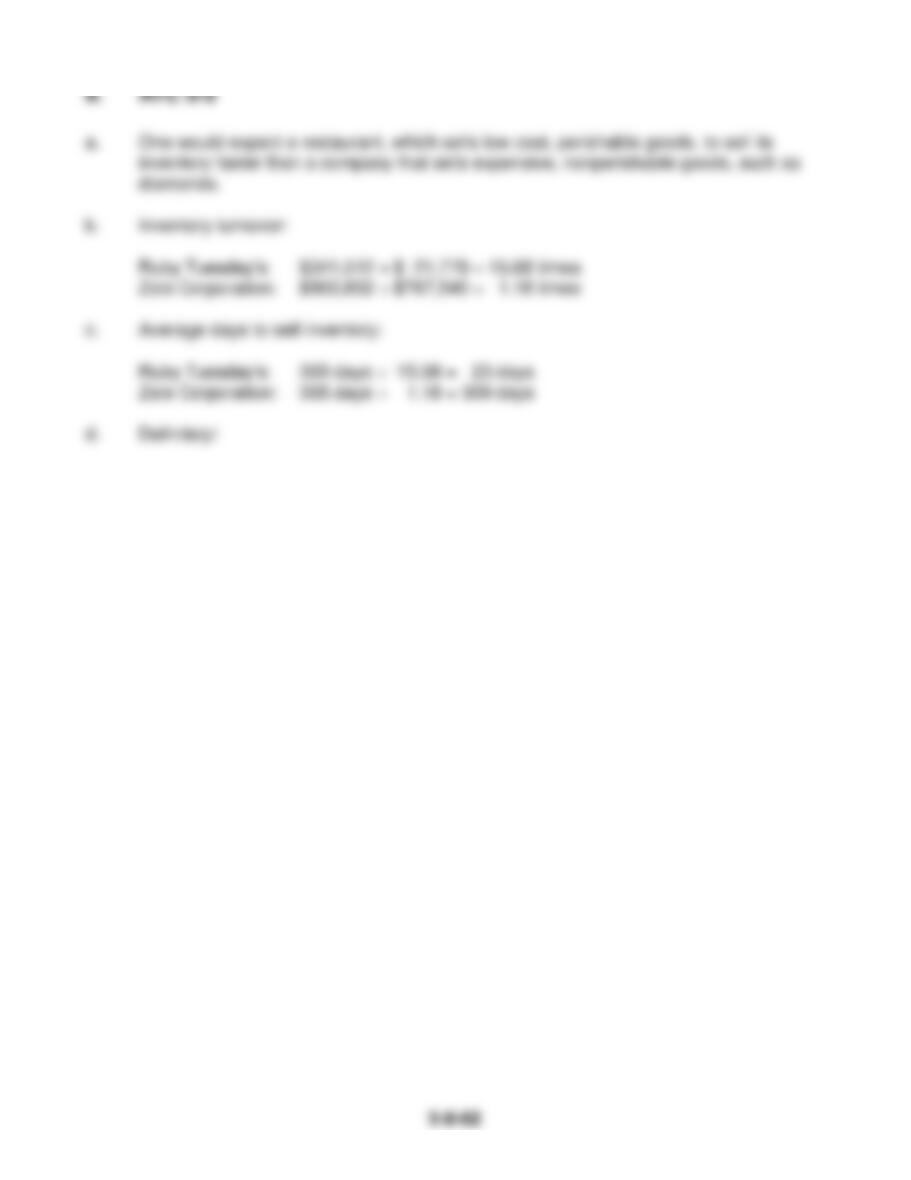
II. ATC 5-5
a. One would expect a restaurant, which sells low cost, perishable goods, to sell its
inventory faster than a company that sells expensive, nonperishable goods, such as
diamonds.
b. Inventory turnover:
Ruby Tuesday’s: $341,512 ÷ $ 21,779 = 15.68 times
Zale Corporation: $903,602 ÷ $767,540 = 1.18 times
c. Average days to sell inventory:
Ruby Tuesday’s: 365 days ÷ 15.68 = 23 days
Zale Corporation: 365 days ÷ 1.18 = 309 days
d. Definitely!
ATC 5-6
a. Using FIFO, the cost of goods sold for Leno Company would be
$289,000 ($535,000 − $246,000). If Leno Company switches to
LIFO, the cost of goods sold would increase to $360,000
5-II–64
ATC 5-7
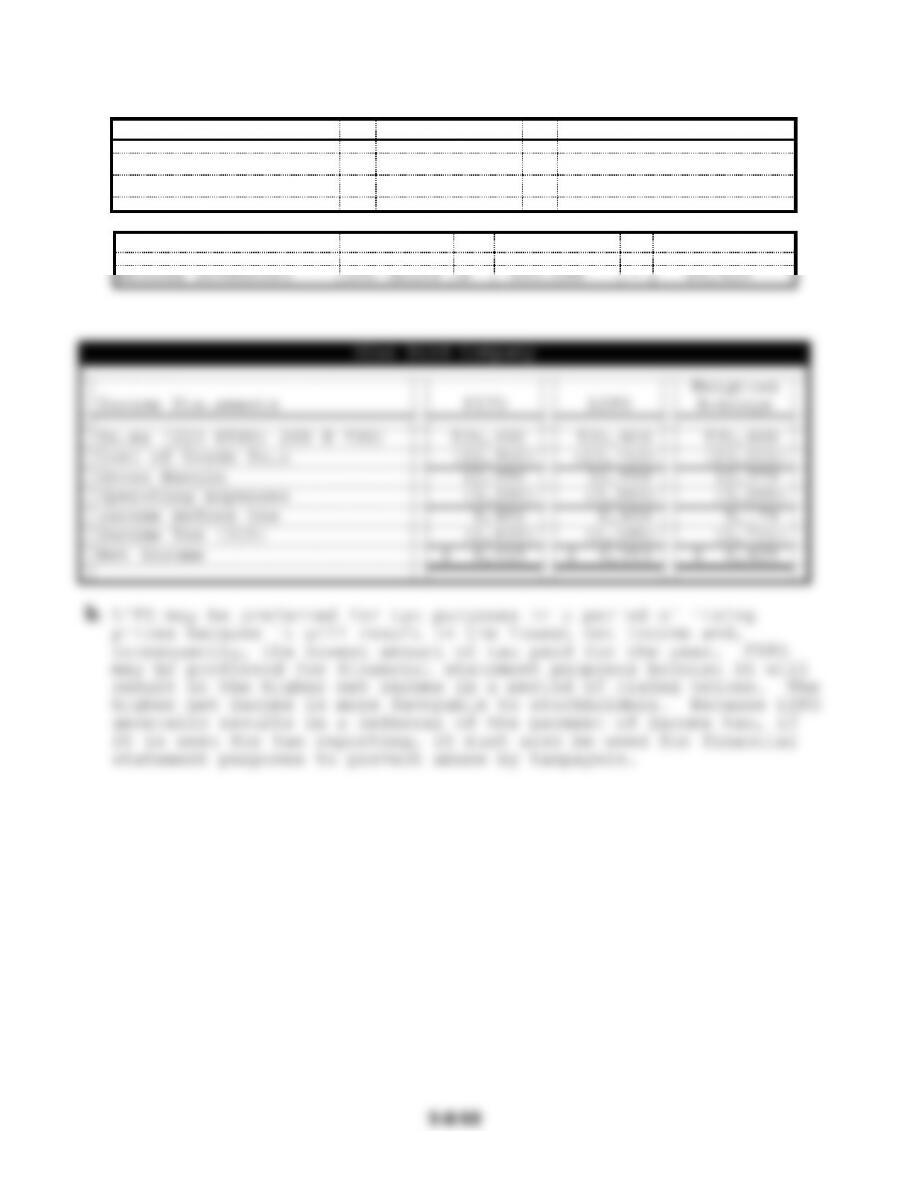
a. When the LIFO method is used for tax purposes, tax law requires
companies to use the same cost flow method for financial
reporting. Consequently, if the company uses LIFO for tax
purposes, then it is legally bound to use the same method in
its financial statements. Accordingly, it would be illegal for
inflationary economy, the first inventory purchased, which
would be the lower cost inventory, would be the first inventory
expensed when goods are sold under FIFO. This would leave the
higher cost inventory in ending inventory which is the cost
that would appear on the balance sheet.
financial statements. Additionally, the LIFO reserve amount
would be disclosed in the notes to the financial statements and
the stockholders could make their own judgments about how the
statements would appear if FIFO had been used.
III. ATC 5-8
SOLUTIONS TO EXERCISES – SERIES B – CHAPTER 5
EXERCISE 5-1B
a. FIFO
b. FIFO
c. FIFO