5-13
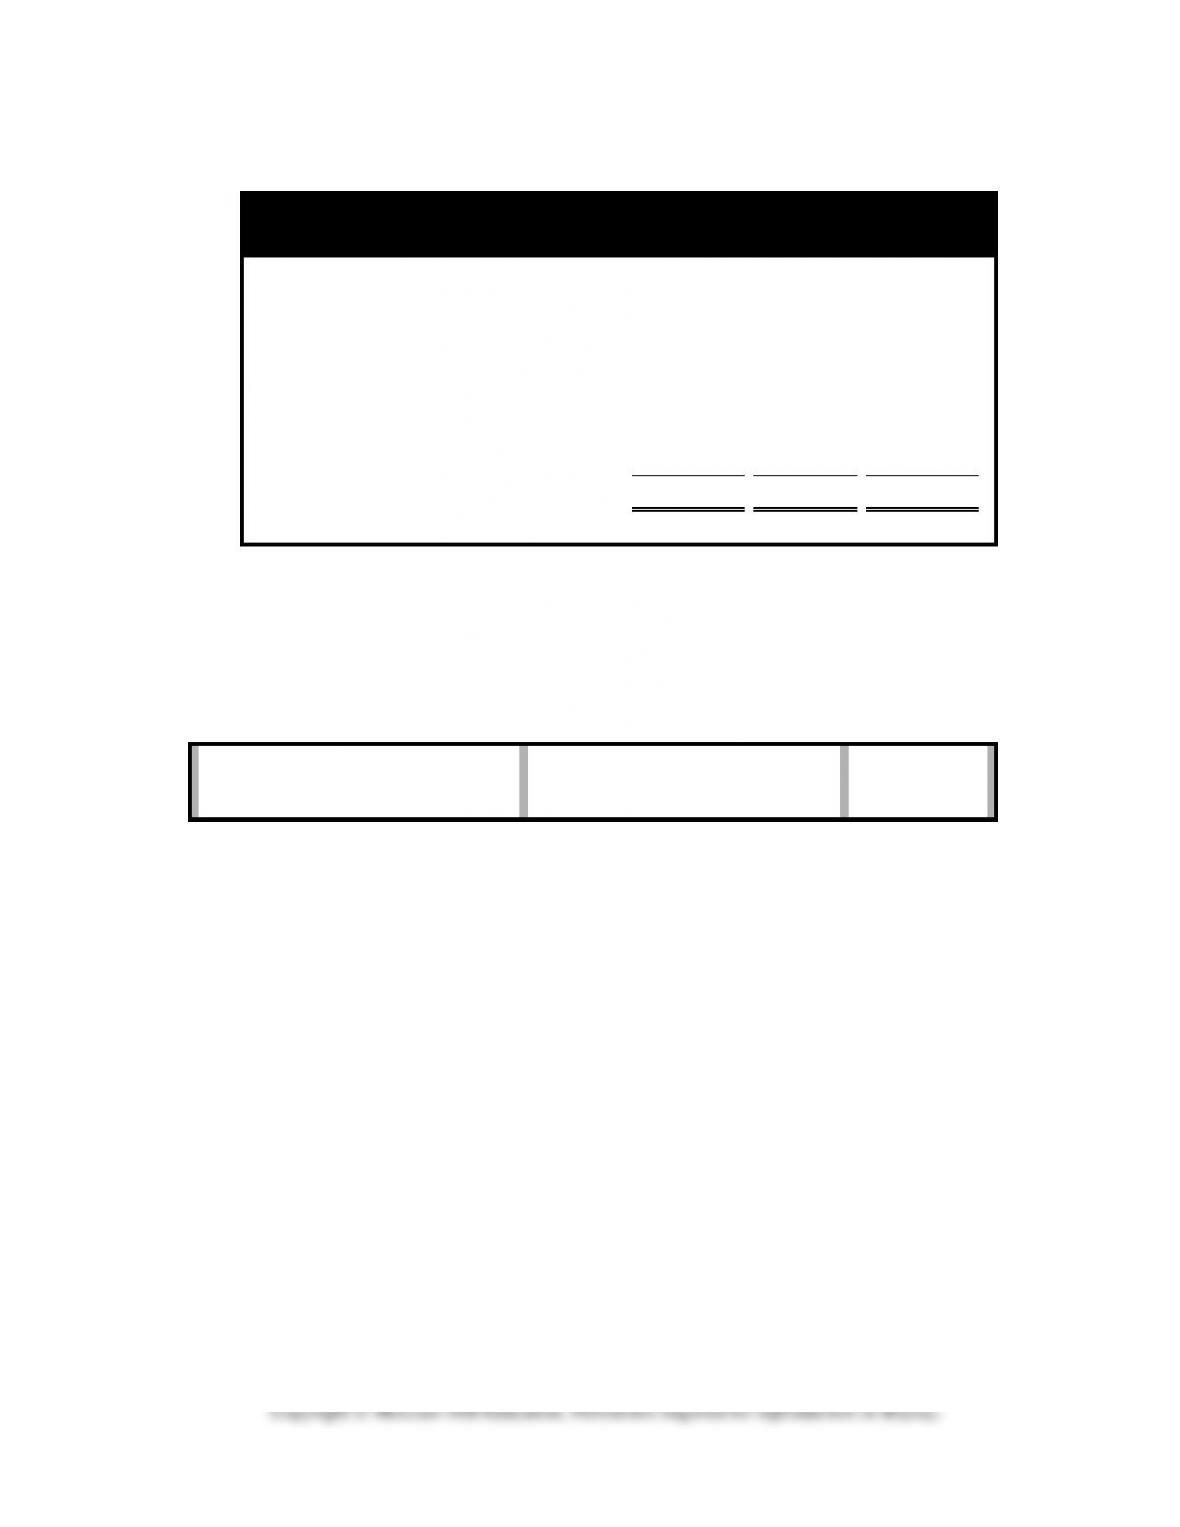
Demonstration Problem 5-3 Solution
Determination of Ending Inventory at Lower of Cost or Market
Type
Quantity
Unit
Cost
Unit
Market
Total
Cost
Total
Market
Lower of
C or M
A
100
$12.00
$15.00
$ 1,200
$ 1,500
$ 1,200
B
550
8.00
6.00
4,400
3,300
3,300
C
710
25.00
24.00
17,750
17,040
17,040
D
240
20.00
22.00
4,800
5,280
4,800
$28,150
$27,120
$26,340
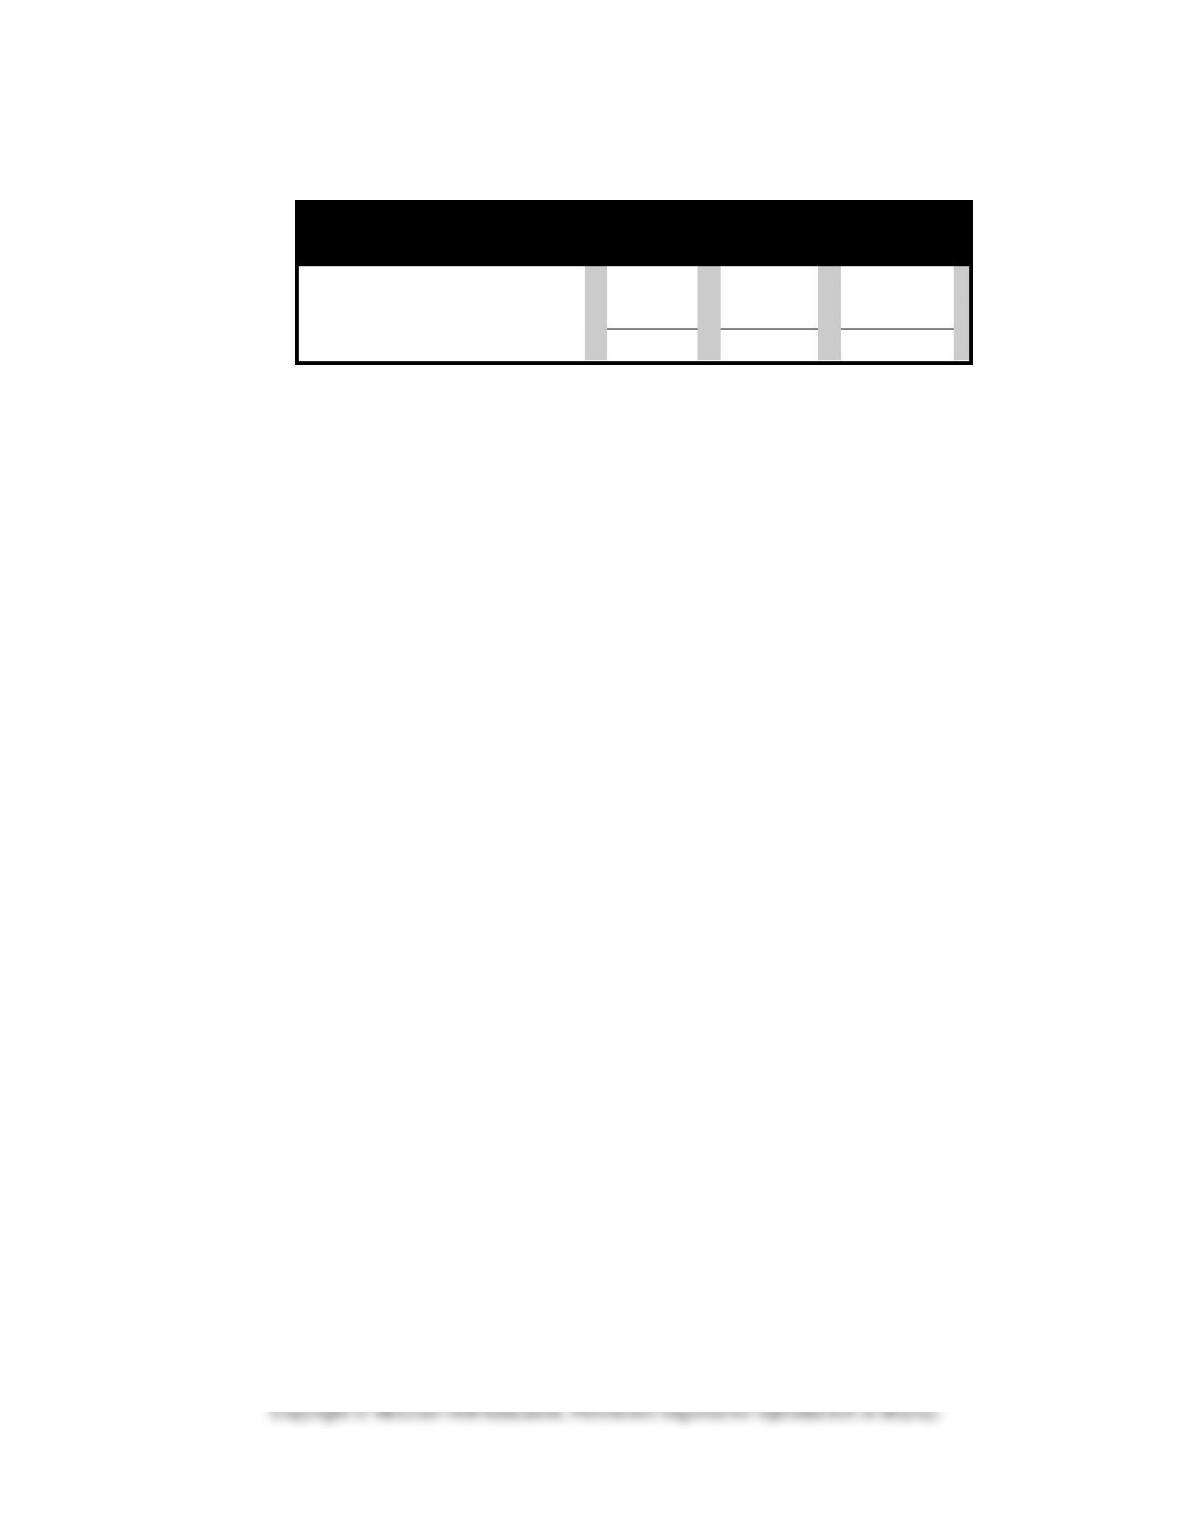
Applying the lower of cost or market rule on an individual basis requires a
$1,810 write-down ($28,150 – $26,340). Use the horizontal financial state-
ments model to show the effect of the write-down on the financial state-
ments:
Assets
=
Liab.
+
Equity
Rev.
–
Exp.
=
Net Inc.
Cash Flow
(1,810)
=
0
+
(1,810)
0
–
1,810
=
(1,810)
0
5-14
Demonstration Problem 5-1 Workpaper
FIFO
LIFO
Weighted
Average
Sales
Cost of goods sold
Gross margin
5-15
Demonstration Problem 5-2 Workpaper – Inventory Summary
Crystal Apple’s 2015 inventory contains the following layers.
Units
Cost per Unit
Total Cost
Beginning balance
200
x
$18
=
$ 3,600
First purchase
800
x
20
=
16,000
Second purchase
1,200
x
24
=
28,800
Total available
2,200
$48,400
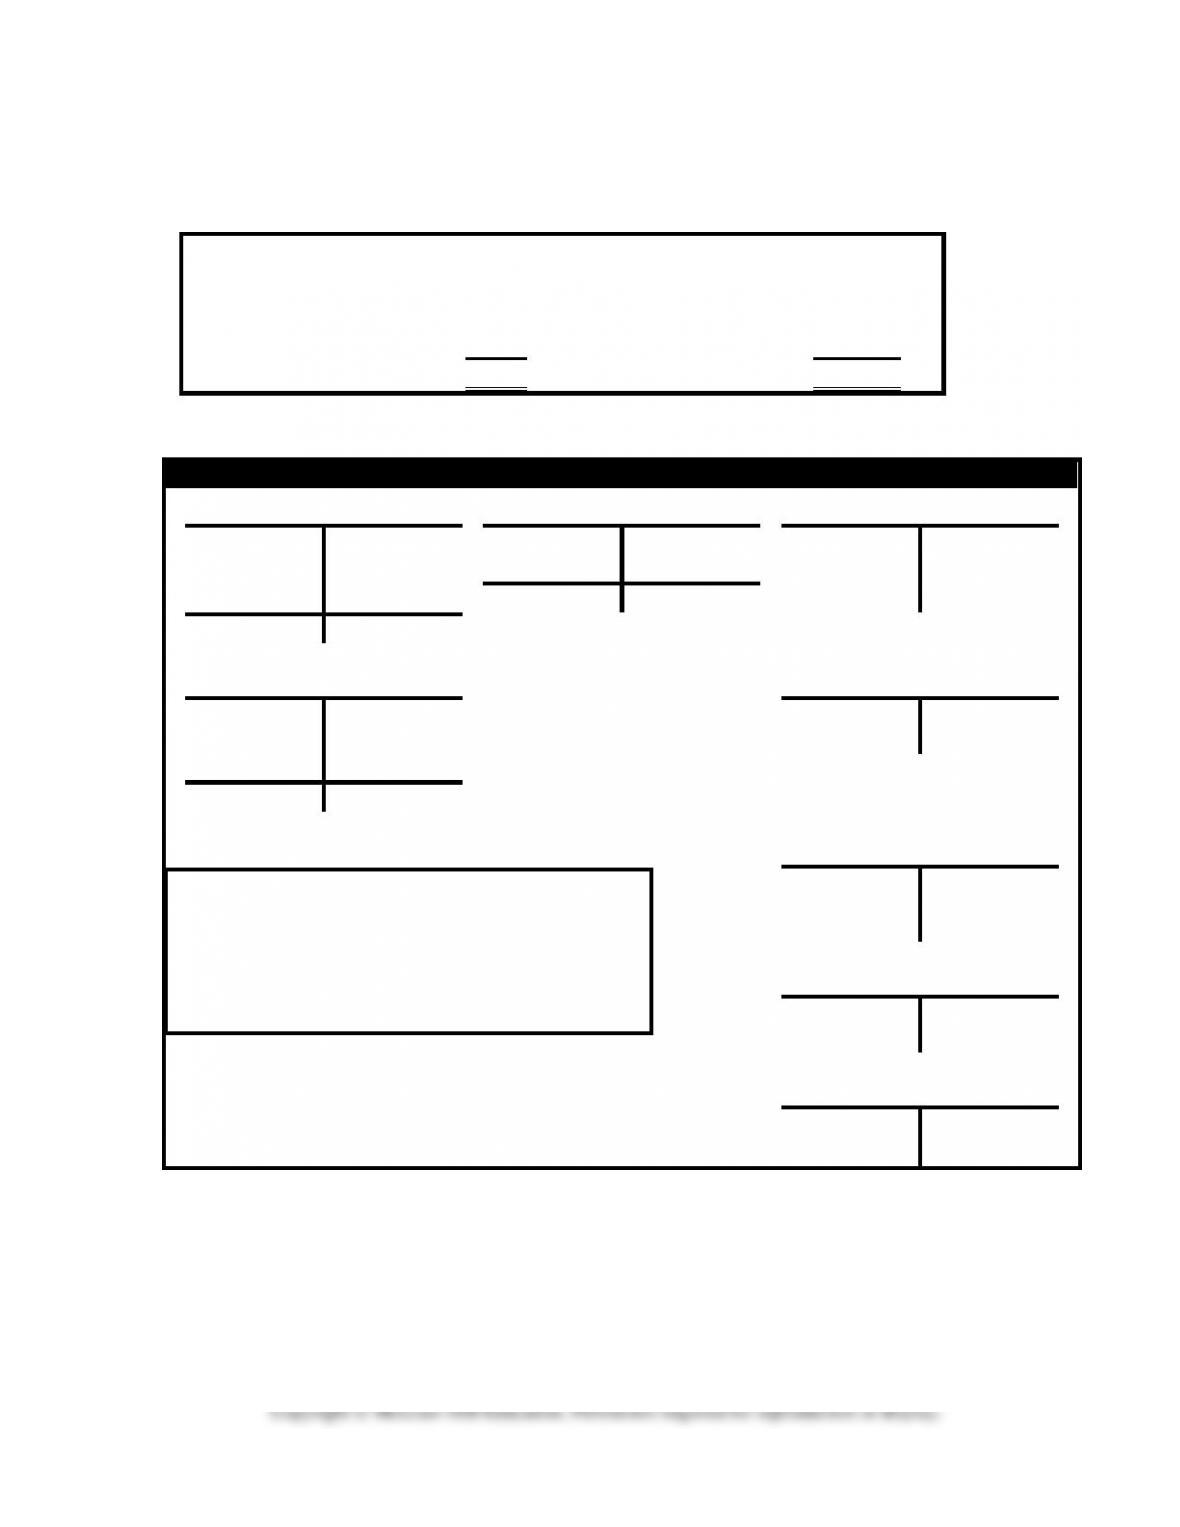
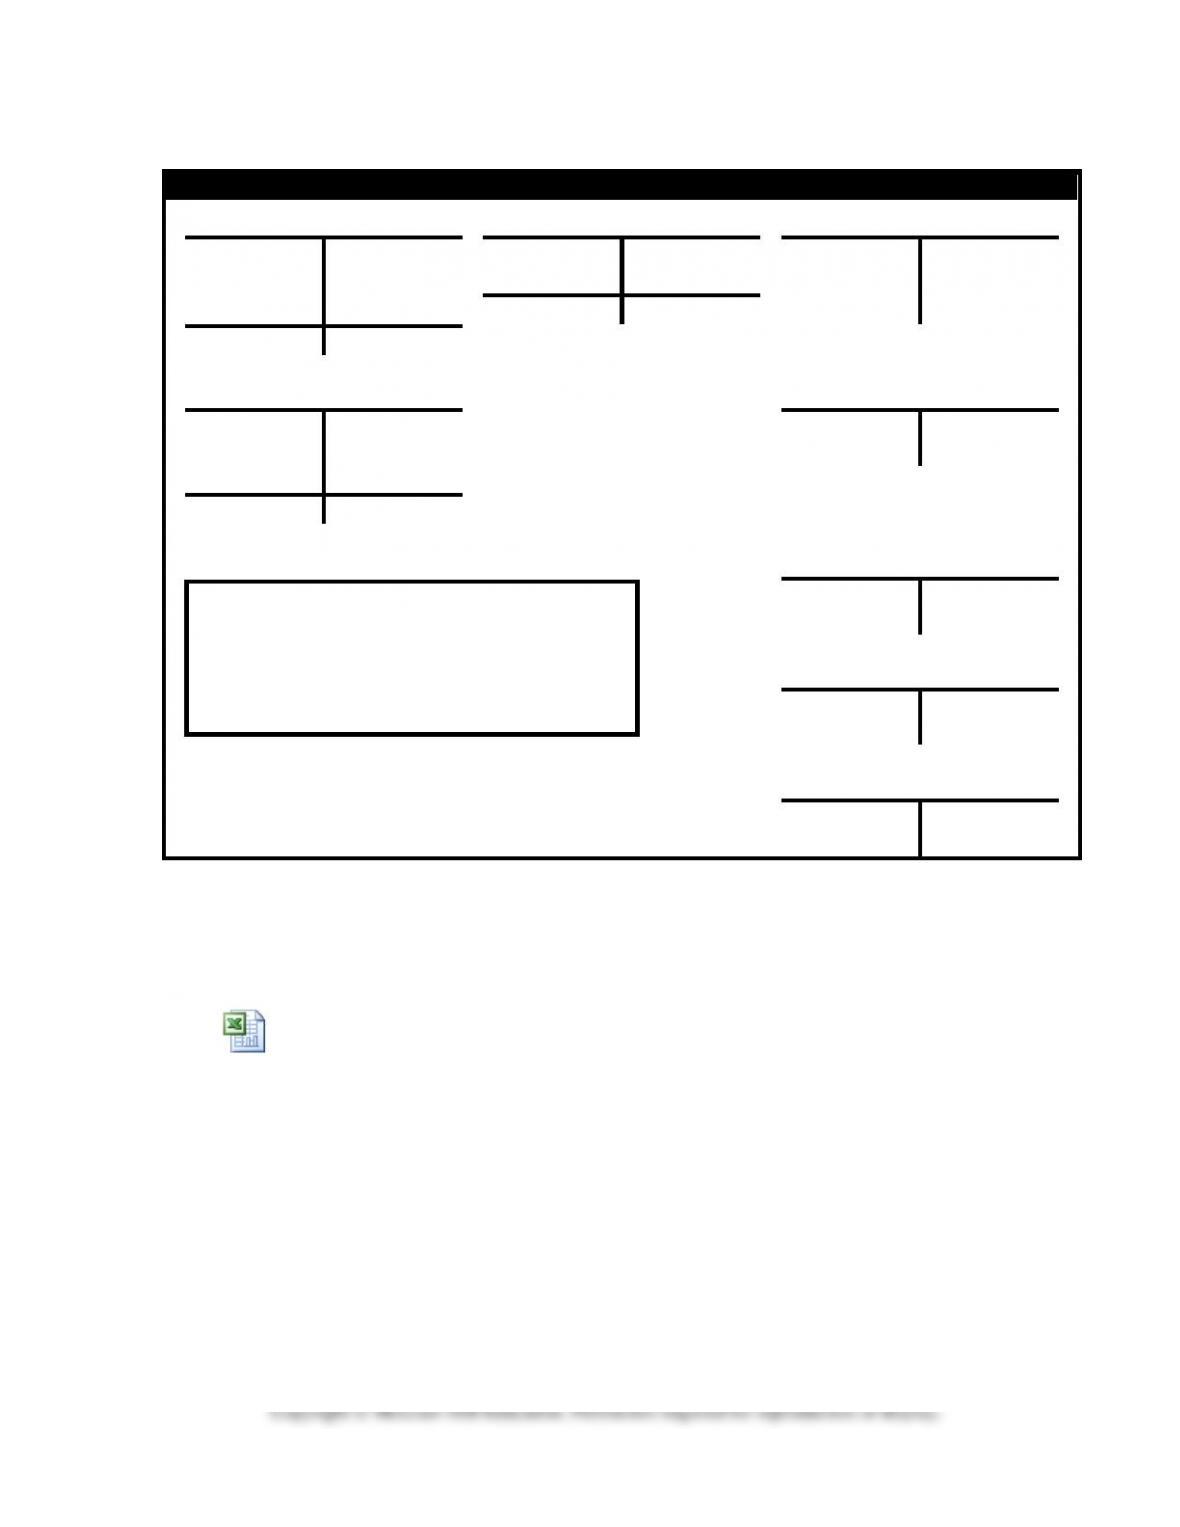
Demonstration Problem 5-2 Workpaper, part a. Ledger T-accounts
Ledger T-Accounts – FIFO Cost Flow
Cash
Accounts Payable
Common Stock
Bal. 2,000
2,500 Bal.
0 Bal.
Bal. 12,800
Inventory
Retained Earnings
Bal. 3,600
3,100 Bal.
Bal. 3,840
Sales Revenue
Cost of Goods Sold
Operating Expenses
Computation of Cost of Goods Sold using FIFO
Units
Cost per Unit
Total Cost
x
$
=
$
x
=
x
=
5-16
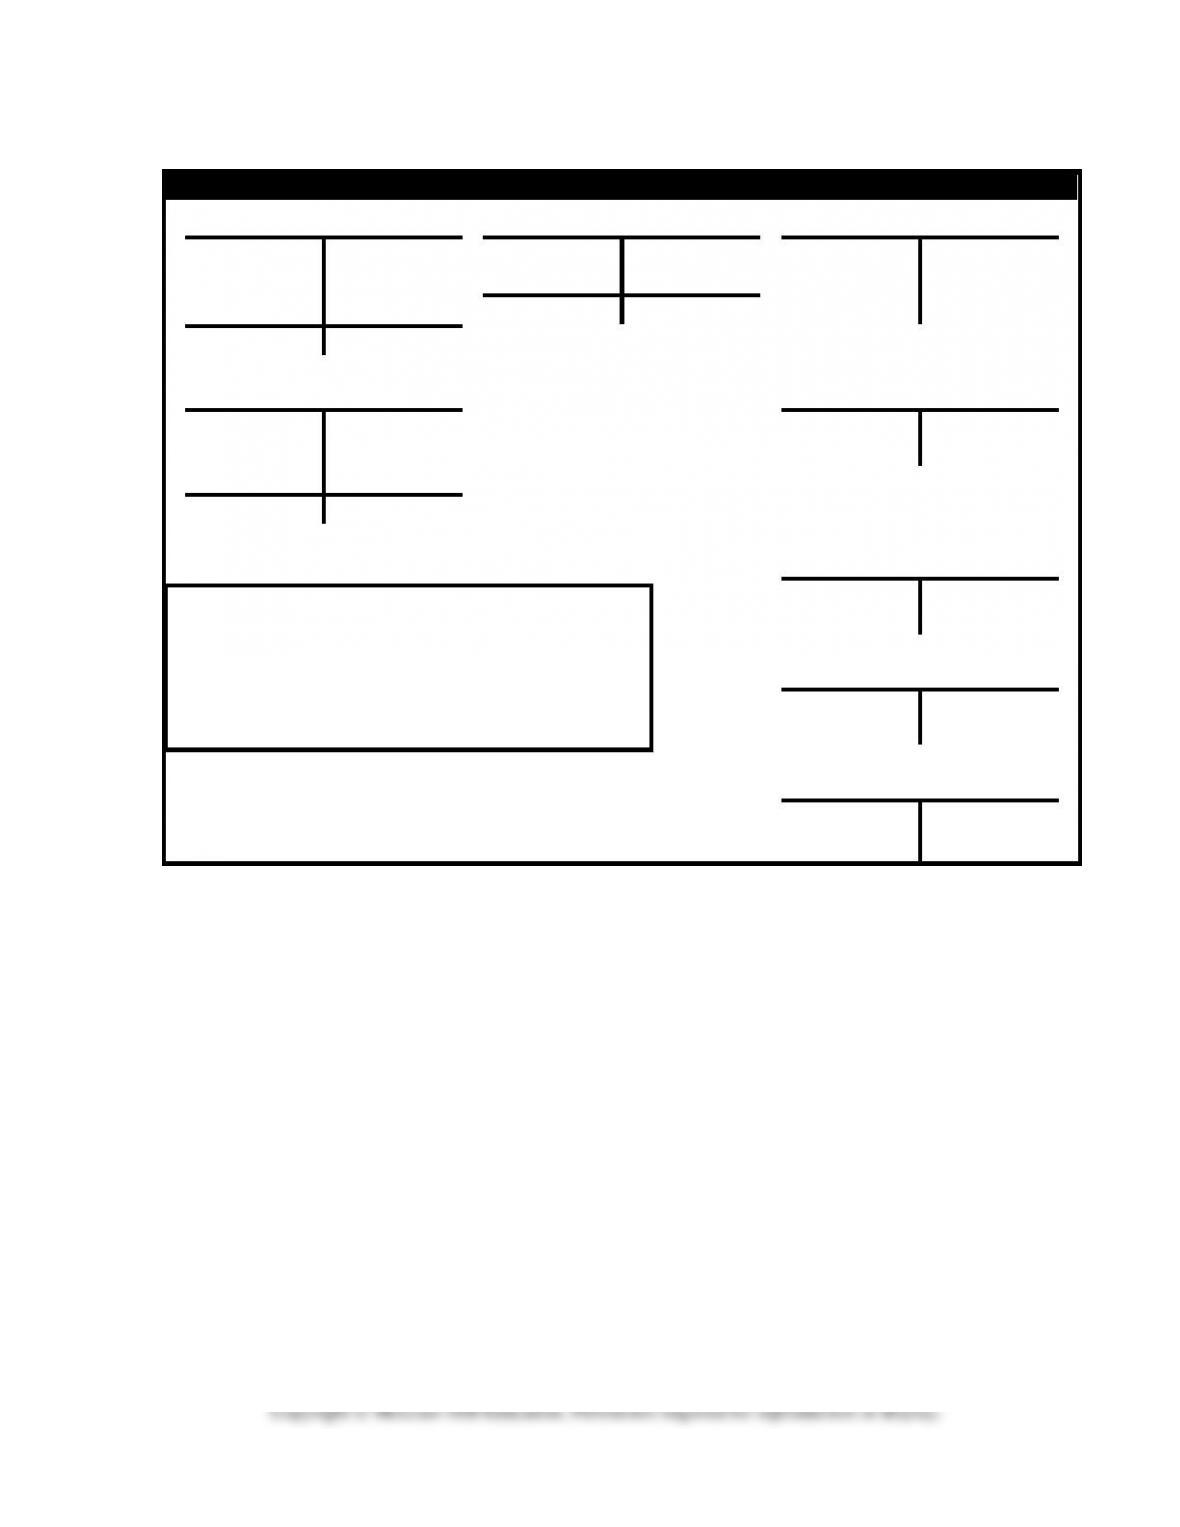
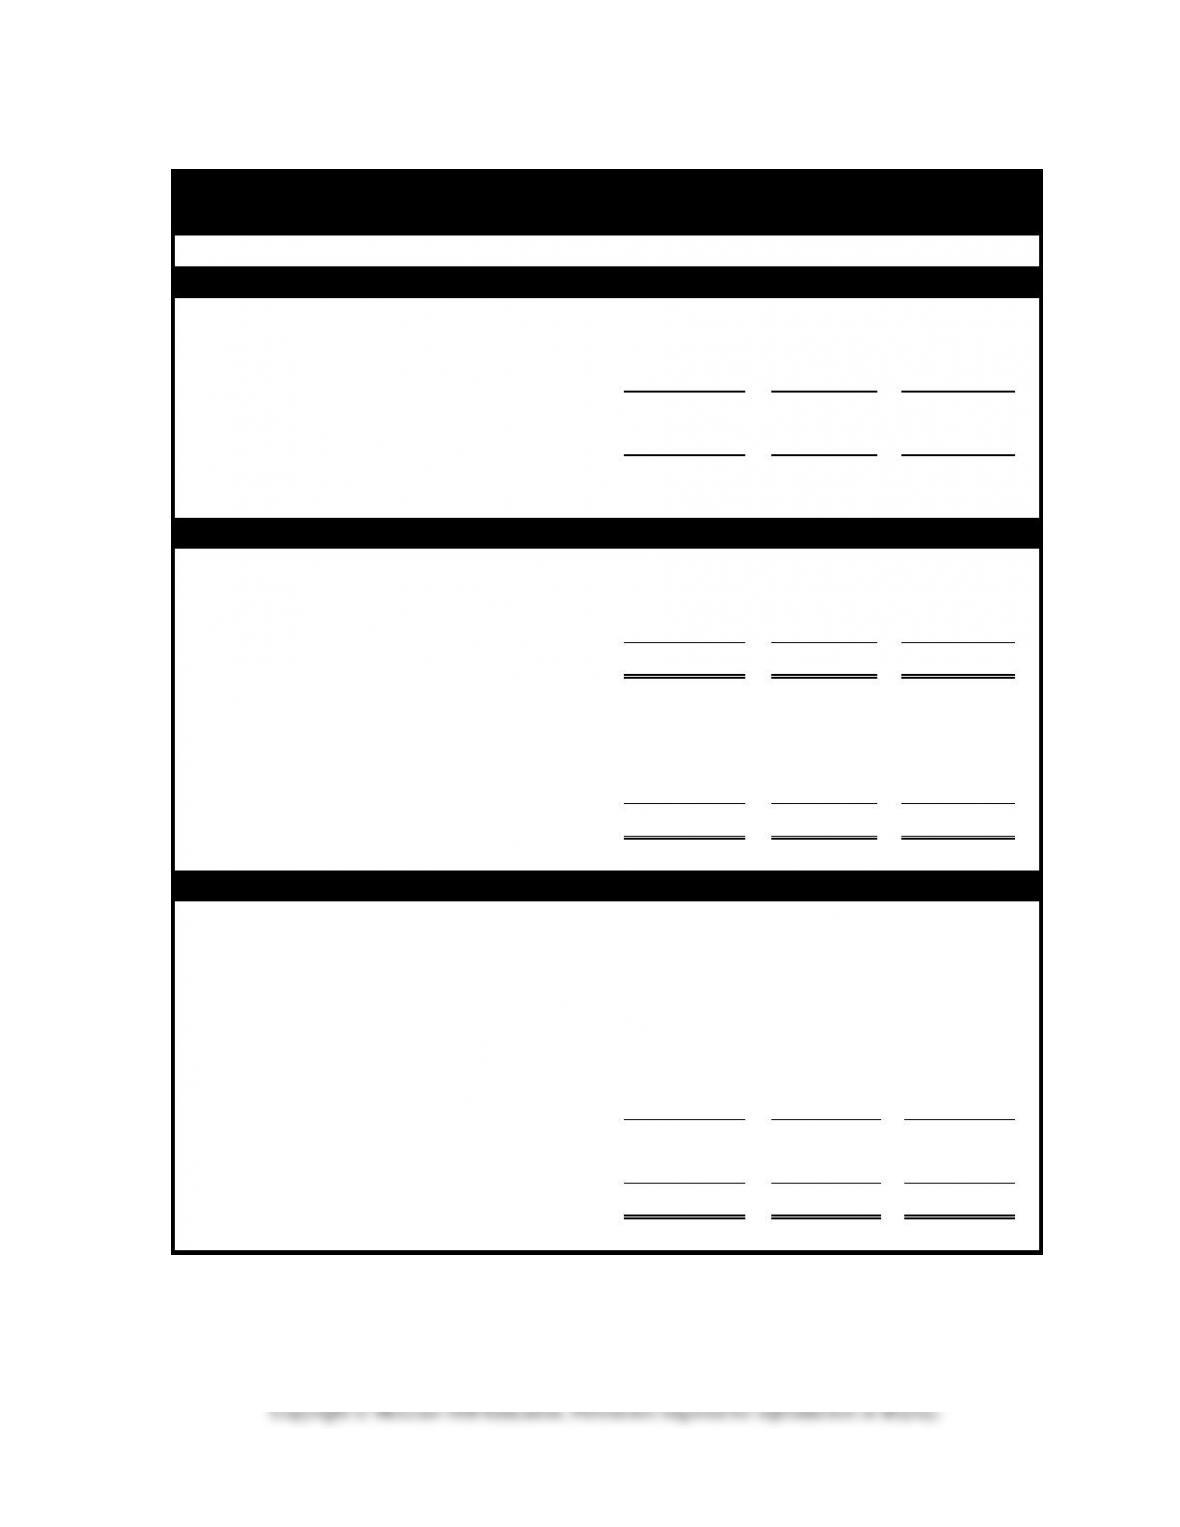
Demonstration Problem 5-2 Workpaper, part a. Ledger T-accounts
Ledger T-Accounts – LIFO Cost Flow
Cash
Accounts Payable
Common Stock
Bal. 2,000
2,500 Bal.
(2a) 81,600
26,000 (4)
0 Bal.
Bal. 12,800
Inventory
Retained Earnings
Bal. 3,600
3,100 Bal.
Bal. 2,880
Sales Revenue
81,600 (2a)
Cost of Goods Sold
Operating Expenses
(4) 26,000
Computation of Cost of Goods Sold using LIFO
Units
Cost per Unit
Total Cost
x
$
=
$
x
=
x
=
5-17
Demonstration Problem 5-2 Workpaper, part a. Ledger T-accounts
Ledger T-Accounts – Weighted Average Cost Flow
Cash
Accounts Payable
Common Stock
Bal. 2,000
2,500 Bal.
(2a) 81,600
26,000 (4)
0 Bal.
Bal. 12,800
Inventory
Retained Earnings
Bal. 3,600
3,100 Bal.
Bal. 3,520
Sales Revenue
81,600 (2a)
Cost of Goods Sold
Operating Expenses
(4) 26,000
Demonstration Problem 5-2 Workpaper, part a. Horizontal Financial
Statements Model
C:\ACCT 2100\
Edmonds 7e Instructor
Computation of Cost of Goods Sold using WA
Cost per Unit = $ ÷ units = $
Units
Cost per Unit
Total Cost
x
$
=
$
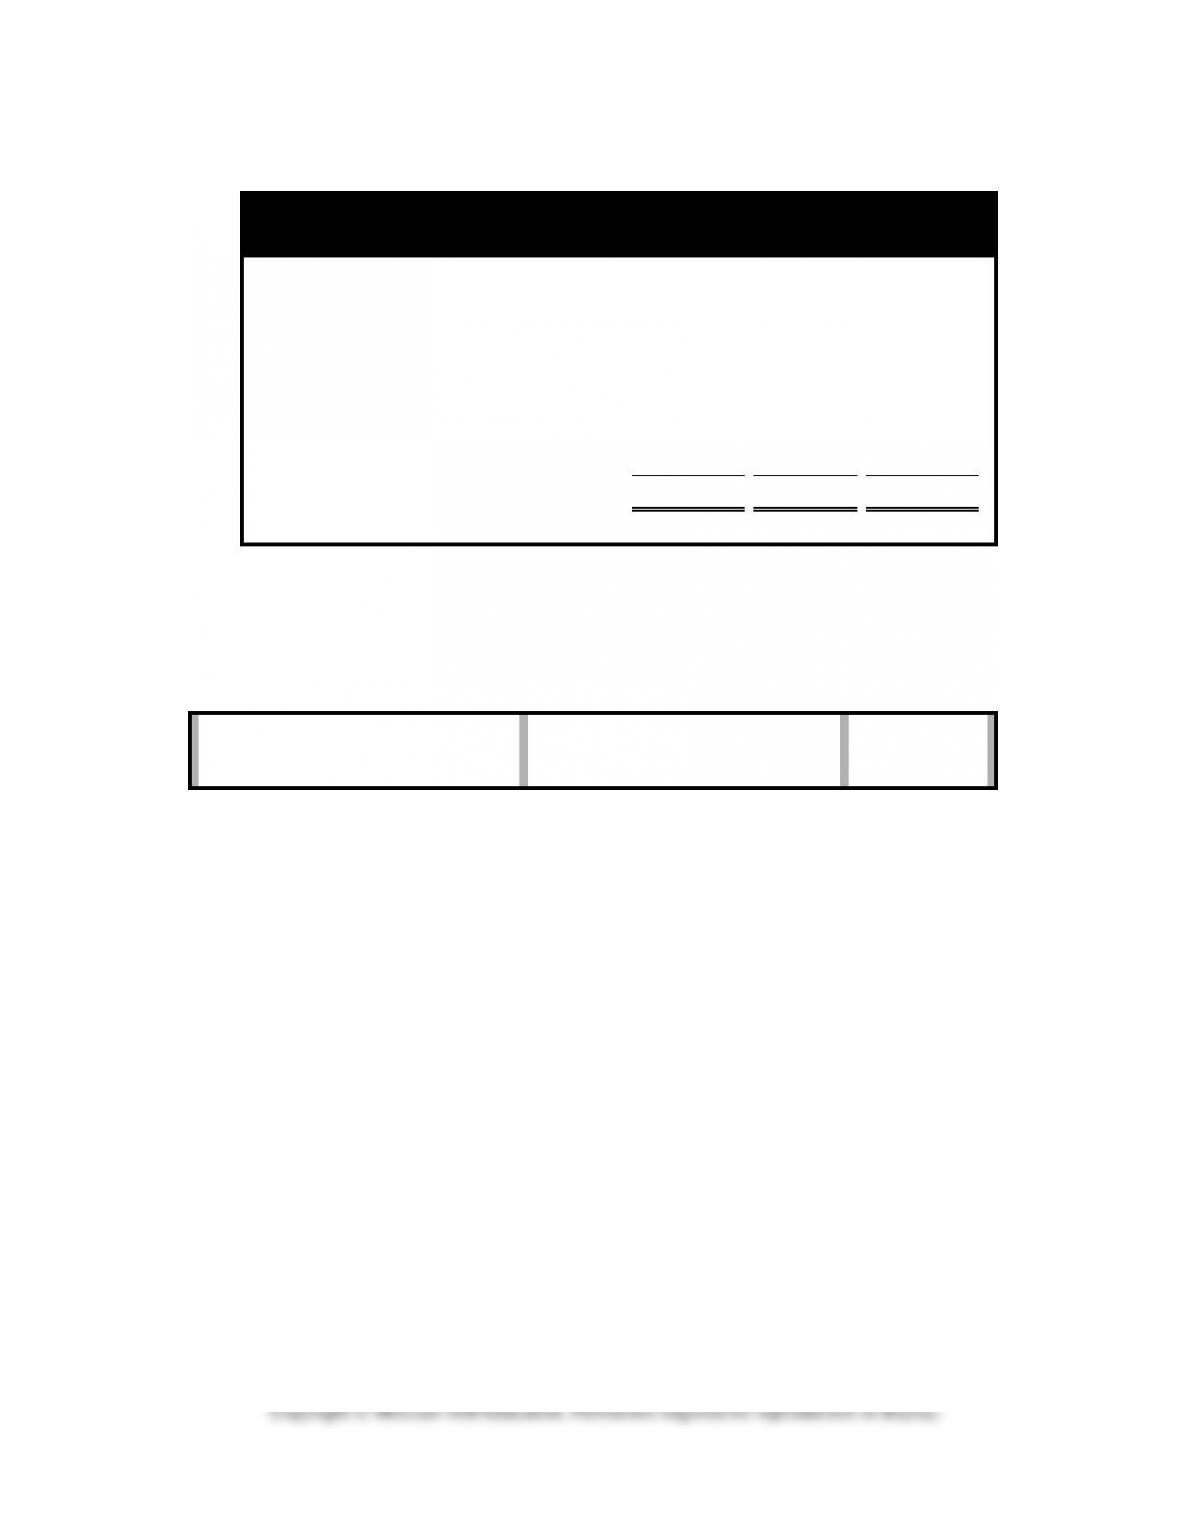
5-18
Demonstration Problem 5-2 Workpaper, part b. Financial Statements
Crystal Apple Sales Company
Comparative Financial Statements
Income Statements for the Year Ended December 31, 2015
FIFO
LIFO
Wt. Avg.
Sales
$81,600
$81,600
$81,600
Cost of goods sold
Gross margin
37,040
36,080
36,720
Operating expenses
Net Income
$11,040
$10,080
$10,720
Balance Sheets at December 31, 2015
Assets
FIFO
LIFO
Wt. Avg.
Cash
Inventory
Total assets
$16,640
$15,680
$16,320
Stockholders’ equity
Common stock
$ 2,500
$ 2,500
$ 2,500
Retained earnings
Total stockholders’ equity
Statements of Cash Flows for the Year Ended December 31, 2015
Cash flow from oper. activities
FIFO
LIFO
Wt. Avg.
Cash inflow from customers
$81,600
$81,600
$81,600
Cash outflow for inventory
Cash outflow for oper. exp.
Net cash inflow from oper. act.
10,800
10,800
10,800
Cash flow from investing act.
0
0
0
Cash flow from financing act.
0
0
0
Net increase in cash
10,800
10,800
10,800
Beginning cash balance
2,000
2,000
2,000
Ending cash balance
$12,800
$12,800
$12,800
5-19
Demonstration Problem 5-3 Workpaper
Determination of Ending Inventory at Lower of Cost or Market
Type
Quantity
Unit
Cost
Unit
Market
Total
Cost
Total
Market
Lower of
C or M
A
100
$12.00
$15.00
$
$
$
B
550
8.00
6.00
C
710
25.00
24.00
D
240
20.00
22.00
$28,150
$27,120
$26,340
Applying the lower of cost or market rule on an individual basis requires a
$1,810 write-down ($28,150 – $26,340). Use the statements model to show
the effect of the write-down on the financial statements:
Assets
=
Liab.
+
Equity
Rev.
–
Exp.
=
Net Inc.
Cash Flow
=
+
–
=

5-20
Quiz Questions for Chapter 5
The following data apply to the next three questions.
Units
Price
Beginning inventory
200
$1.20
First purchase
400
$1.30
Second purchase
250
$1.40
Sales
550
$2.00
1. Assuming a FIFO cost flow, the amount of gross margin reported on the income statement would be
a. $415.
b. $695.
c. $405.
d. None of the above.
2. Assuming a LIFO cost flow, the amount of ending inventory reported on the balance sheet would be
a. $240.
b. $370.
c. $130.
d. $415.
3. Assuming a weighted average cost flow, the amount of ending inventory reported on the balance sheet
would be closest to:
a. $392.
b. $415.
c. $370.
d. $417.
4. In a period of rising prices, which inventory cost flow method results in the lowest balance sheet figure for
inventory?
a. Weighted average.
b. FIFO.
c. LIFO.
d. Cannot tell without more information.
5. In a period of rising prices, which inventory cost flow method results in the lowest income tax liability, all
other things being equal?
a. Weighted average.
b. FIFO.
c. LIFO.
d. Both a and b.
6. Which of the following statements is true regarding how cost of goods sold is determined under the perpet-
ual inventory system using LIFO?
a. The units sold are multiplied by the first costs in inventory.
b. The units sold are multiplied by the last costs in inventory.
c. Multiply the units in ending inventory by the last costs in inventory. This amount is subtracted from
cost of goods available for sale.
d. The cost of goods available for sale is divided by total units to get an average cost which is multiplied
by units sold.

5-21
7. The following information was taken from the records of Trudy’s Trinkets:
Cost
Market Value
Item
Quantity
per Unit
per Unit
A
50
$24
$18
B
20
40
42
C
10
20
10
Trudy’s reports inventory at the lower of cost or market (applied individually). The necessary adjusting
entry would
a. reduce assets and equity by $400.
b. increase assets and equity by $2,200.
c. reduce assets and equity by $360.
d. reduce assets and increase liabilities by $400.
8. Tucker Company uses the periodic inventory method and wants to estimate the amount of ending inventory
in order to prepare quarterly financial statements. Sales for the quarter were $13,000. Based on historical
records, the company earns an average gross margin of 25 percent on sales. Beginning inventory for the
quarter was $3,500 and purchases were $7,100. The amount of ending inventory was
a. $3,250.
b. $850.
c. $10,600.
d. $9,750.
Use the following information to answer the next two questions. ABC Company reports the following in-
formation about inventory activity for 2015:
Quantity
Per Unit
Cost/Sales
Price
Beginning inventory
200
$2.00
1st purchase
150
$2.10
2nd purchase
110
$2.15
Sales
220
$3.20
9. Assuming the company uses the periodic inventory method and LIFO cost flow, cost of goods sold reported
on the 2015 income statement would be
a. $473.00.
b. $704.00.
c. $455.00.
d. $467.50.
10. Using the moving weighted average inventory cost flow method, the average unit cost after the first pur-
chase would be (rounded to the nearest penny),
a. $2.15.
b. $2.12.
c. $2.04.
d. $2.09.
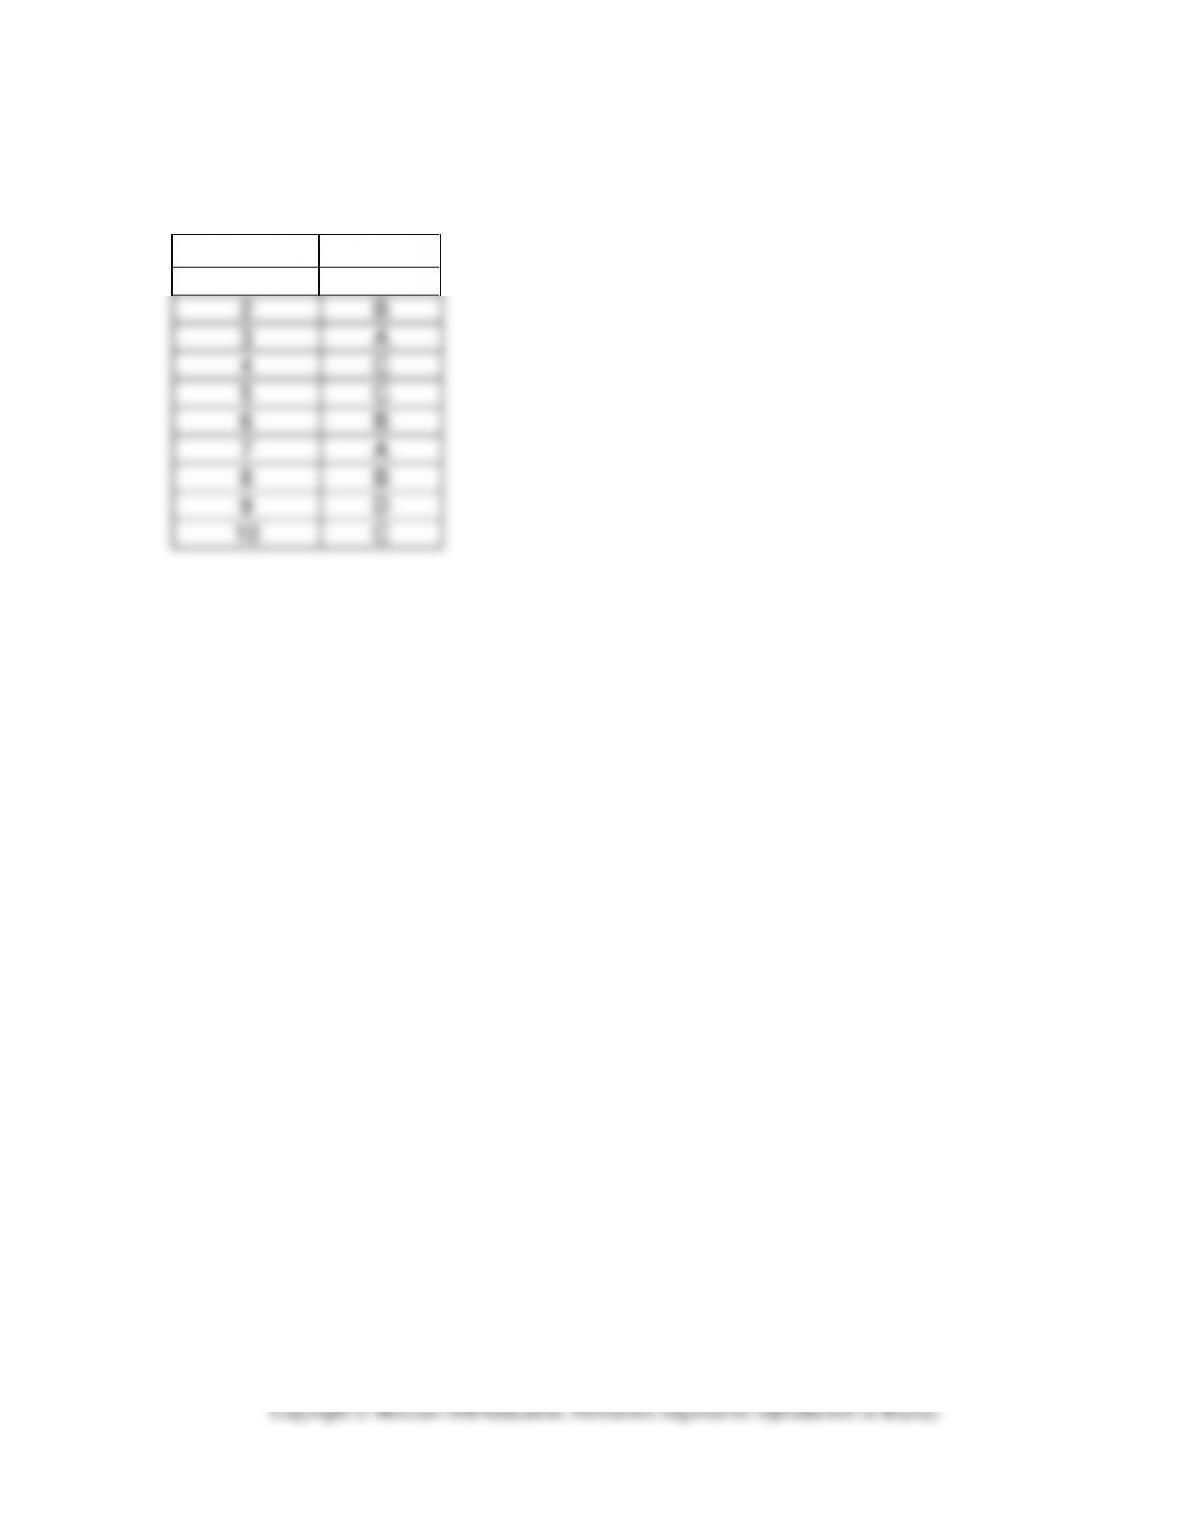
5-22
Quiz Answers
Question
Answer
1
C
2
B
3
A
4
C
5
C
6
B
7
A
8
B
9
D
10
C
Copyright © McGraw-Hill Education. Permission required for reproduction or display.
5-23
Summary Outline of a Lesson Plan for Chapter 5
I. Use Demonstration Problem 5-1, a two-layer, single-product model to introduce
the cost flow methods. Make up a similar problem for students to work in class.
II. Demonstration Problem 5-2 introduces accounting for inventories with multiple
layers and prices. Have students use a vertical format to prepare income statements,
balance sheets, and statements of cash flows. Once they have prepared the state-
ments, have them make the following observations.
A. The cost flow method does not affect revenue.
B. The amount of cost of goods sold plus ending inventory is equal to the amount of
cost of goods available for sale. The total product cost is the same for all cost
flow methods. The difference lies in how the cost is allocated between cost of
goods sold and ending inventory.
C. With the exception of tax consequences, cash flow is not affected by the cost flow
method.
III. The text covers accounting for inventories when purchases and sales occur in-
termittently. To cover this subject, use Exercise 5-8 A or B as a demonstration prob-
lem and Exercise 5-9 A or B as a follow-up problem.
IV. Use Demonstration Problem 5-3 to show students how to write down inventory
to lower of cost or market. Use the horizontal financial statements model to illus-
trate the effect of the write-down on the financial statements.
V. The text covers the gross margin method of estimating the ending inventory bal-
ance. Use Exercise 5-12 A or B to illustrate this approach to inventory estimation.
VI. Use Exercise 5-14 A or B to illustrate the effects of inventory misstatements on
the elements of financial statements.
VII. Time considerations and homework assignments. Allow at least one hour to cover
the inventory topics in this chapter. Select homework assignments from the follow-
ing problems: Problems 5-19 A or B (cost flow methods); 5-20 A or B (lower of cost
or market); and 5-21 A or B (inventory estimation).