4-41
EXERCISE 4-12A b. (cont.)
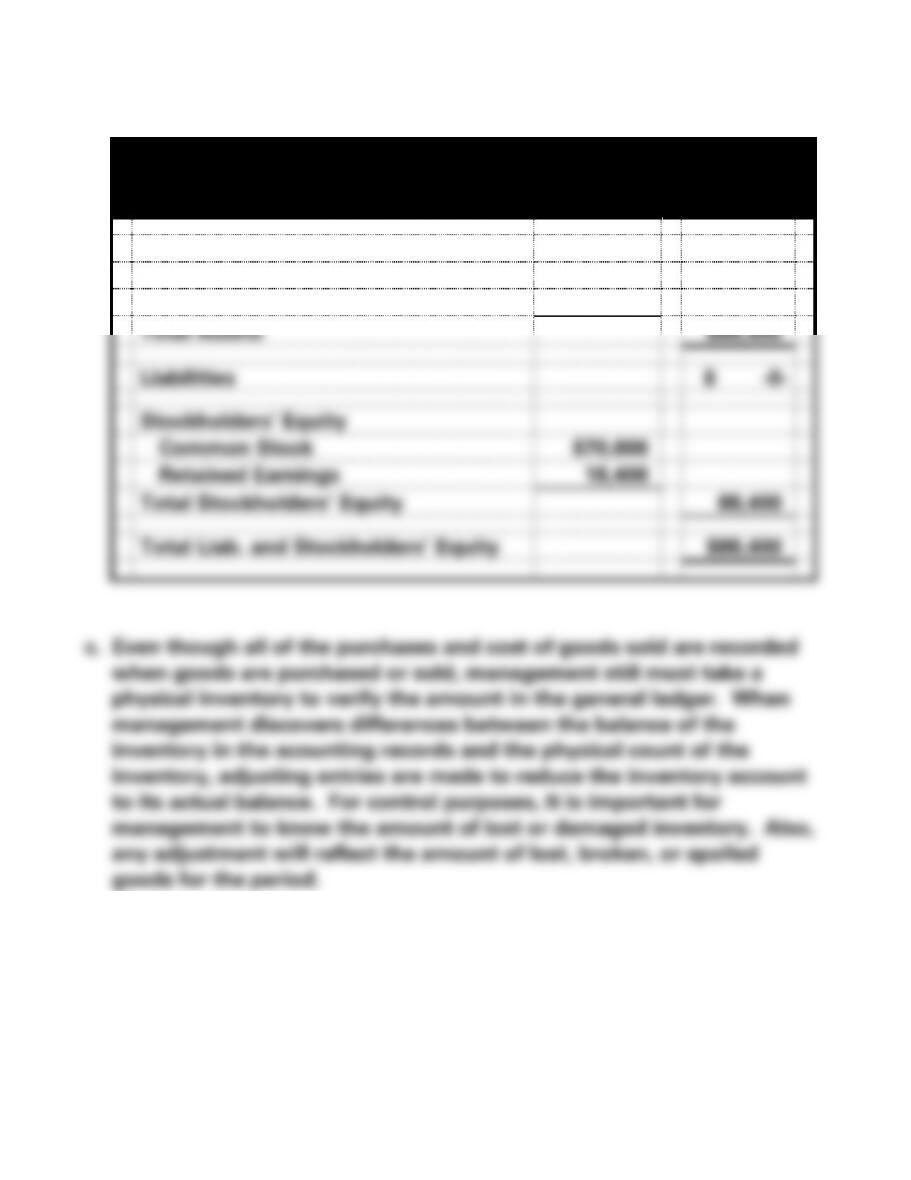
Ho Designs
Balance Sheet
As of December 31, 2016
Assets
Cash
$85,200
Merchandise Inventory
3,200
Total Assets
$88,400
Liabilities
$ -0-
Stockholders’ Equity
Common Stock
$70,000
Retained Earnings
18,400
Total Stockholders’ Equity
88,400
Total Liab. and Stockholders’ Equity
$88,400
4-42
EXERCISE 4-13A
a.
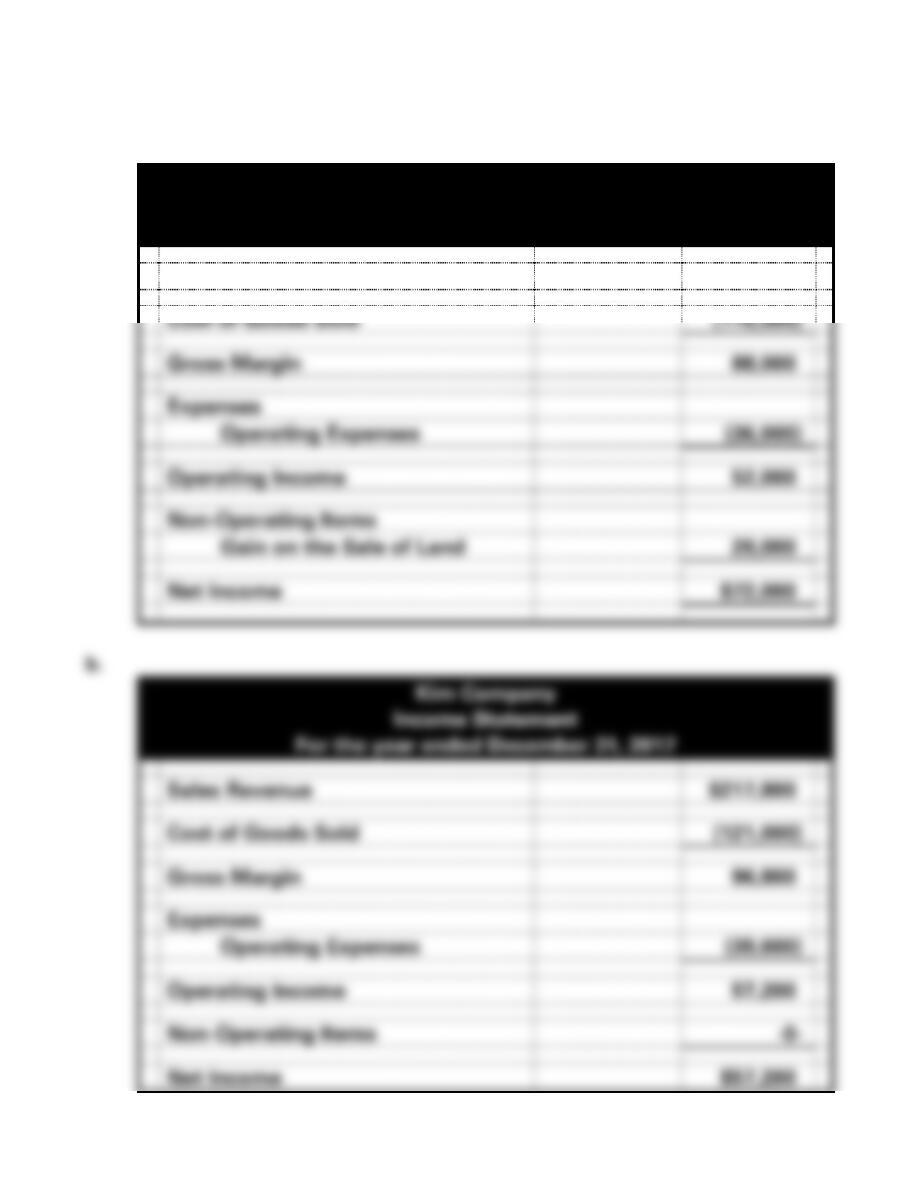
Kim Company
Income Statement
For the year ended December 31, 2016
Sales Revenue
$198,000
Cost of Goods Sold
(110,000)
Gross Margin
88,000
Expenses
Operating Expenses
(36,000)
Operating Income
52,000
Non-Operating Items
Gain on the Sale of Land
20,000
Net Income
$72,000
Kim Company
Income Statement
For the year ended December 31, 2017
Sales Revenue
$217,800
Cost of Goods Sold
(121,000)
Gross Margin
96,800
Expenses
Operating Expenses
(39,600)
Operating Income
57,200
Non-Operating Items
-0-
Net Income
$57,200

4-43
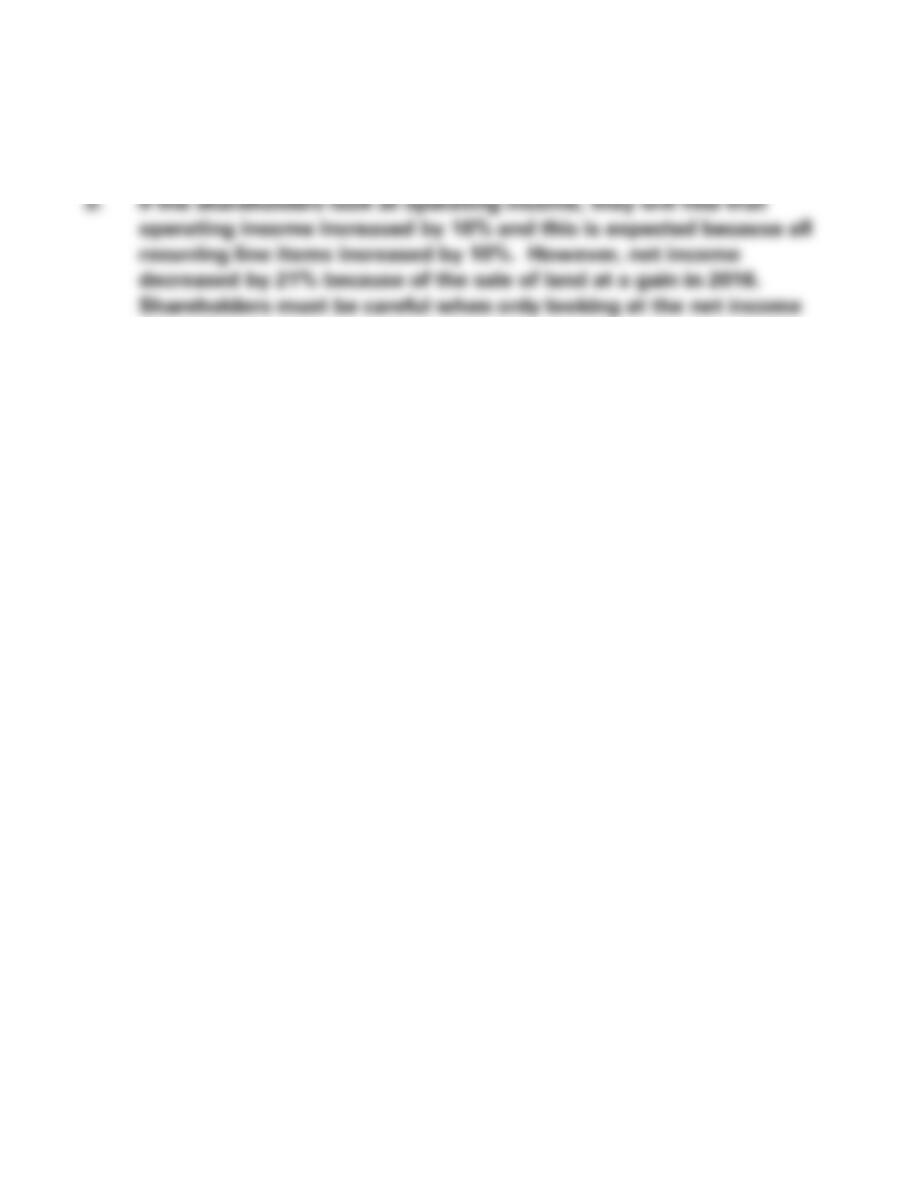
4-44
EXERCISE 4-13A (cont.)
d. Net income decreased by 21%.
amount.
4-45
EXERCISE 4-14A
a.
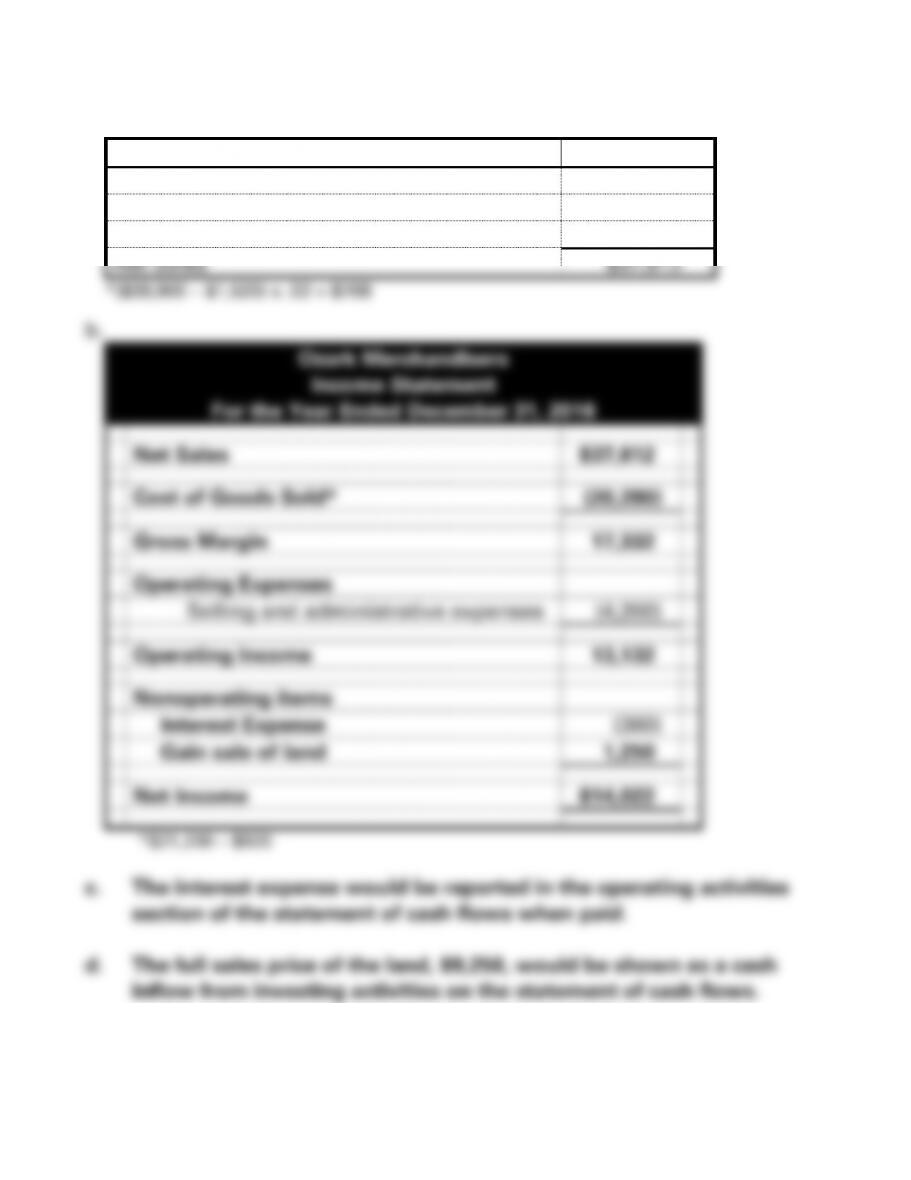
Ozark Merchandisers
Gross Sales
$39,900
Less: Sales Returns
(1,520)
Less: Sales discounts
(768)*
Net Sales
$37,612
4-46
e. A gain occurs from activities that are not part of the normal
4-47
EXERCISE 4-15A
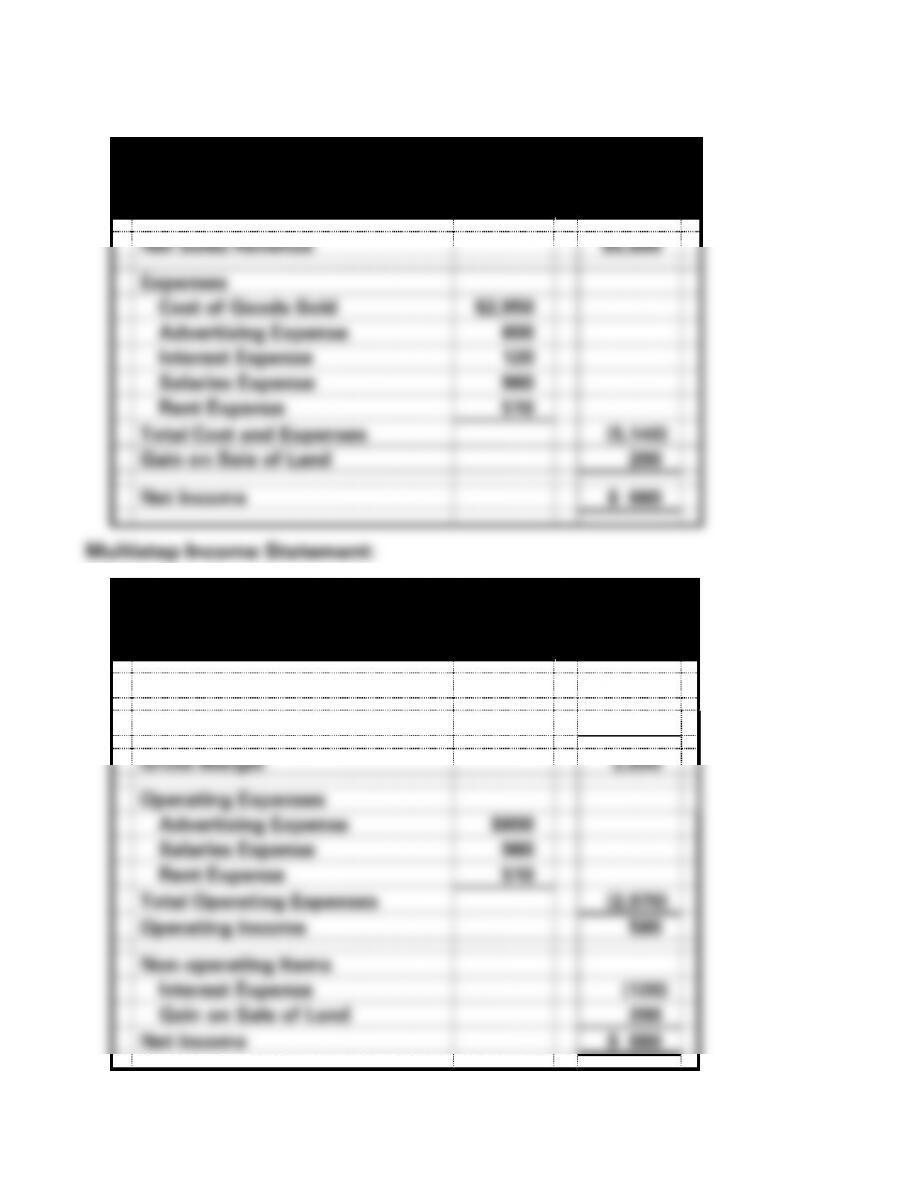
Single-Step Income Statement:
Green Market
Income Statement
For the Year Ended December 31, 2016
Net Sales Revenue
$5,600
Expenses
Cost of Goods Sold
$2,950
Advertising Expense
600
Interest Expense
120
Salaries Expense
960
Rent Expense
510
Total Cost and Expenses
(5,140)
Gain on Sale of Land
200
Net Income
$ 660
Green Market
Income Statement
For the Year Ended December 31, 2016
Net Sales
$5,600
Cost of Goods Sold
(2,950)
Gross Margin
2,650
Operating Expenses
Advertising Expense
$600
Salaries Expense
960
Rent Expense
510
Total Operating Expenses
(2,070)
Operating Income
580
Non-operating Items
Interest Expense
(120)
Gain on Sale of Land
200
Net Income
$ 660
4-48
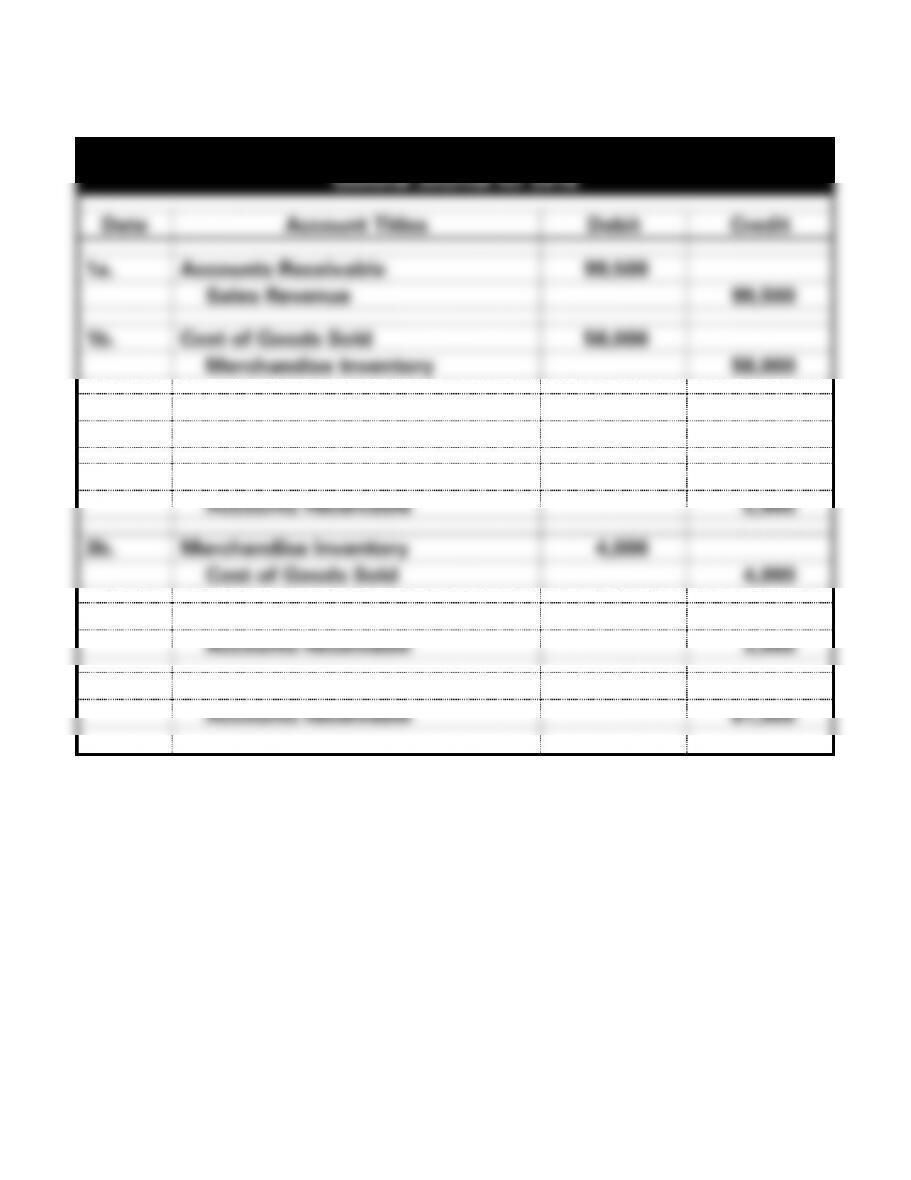
EXERCISE 4-16A
a.
Powell Company
General Journal for 2016
Date
Account Titles
Debit
Credit
1a.
Accounts Receivable
99,500
Sales Revenue
99,500
1b.
Cost of Goods Sold
58,000
Merchandise Inventory
58,000
2.
Transportation-out
900
Cash
900
3a.
Sales Revenue
5,900
Accounts Receivable
5,900
3b.
Merchandise Inventory
4,000
Cost of Goods Sold
4,000
4.
Sales Revenue
3,000
Accounts Receivable
3,000
5.
Cash
81,000
Accounts Receivable
81,000
4-49
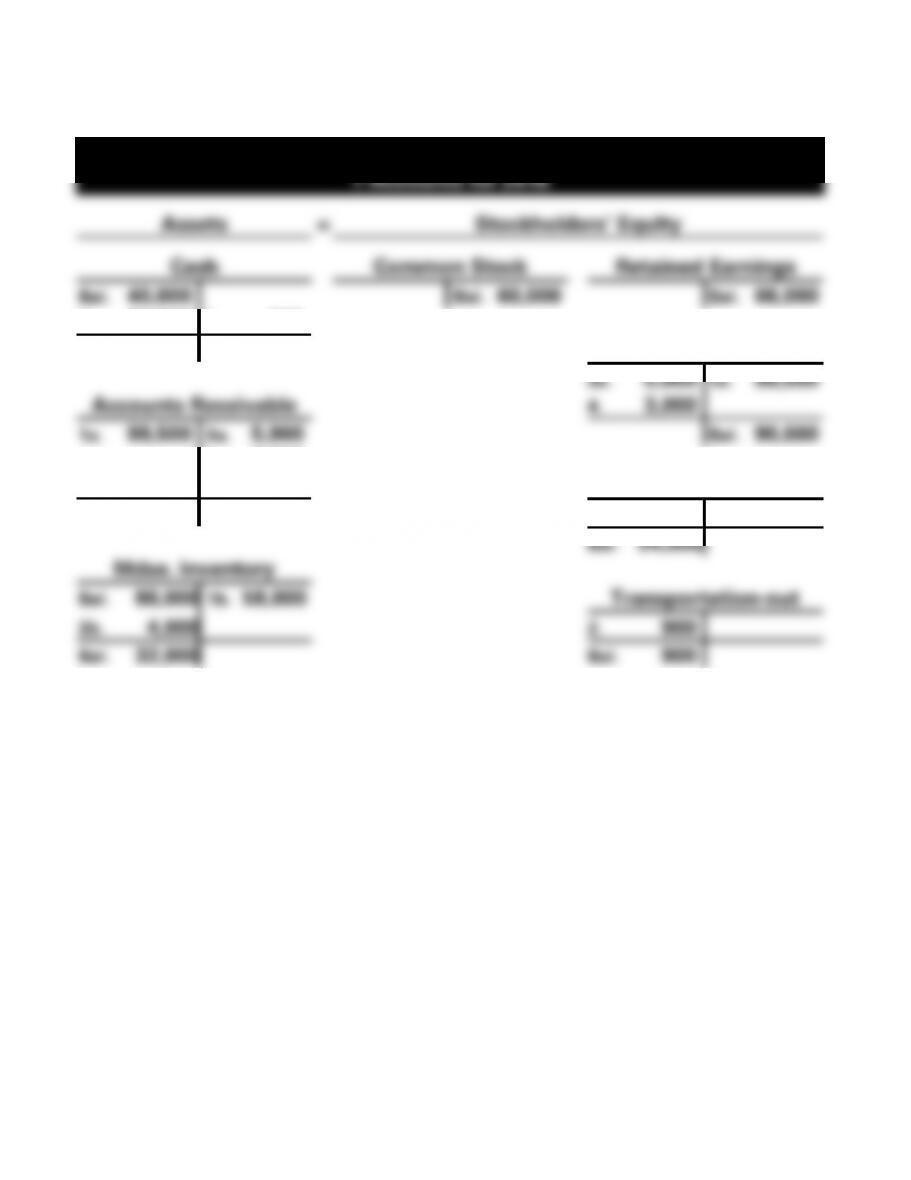
EXERCISE 4-16A (cont.)
b.
Powell Company
T-Accounts for 2016
Assets
=
Stockholders’ Equity
Cash
Common Stock
Retained Earnings
Bal. 40,000
Bal. 60,000
Bal. 66,000
5. 81,000
2. 900
Bal. 120,100
Sales Revenue
3a. 5,900
1a. 99,500
Accounts Receivable
4. 3,000
1a. 99,500
3a. 5,900
Bal. 90,600
4. 3,000
5. 81,000
Cost of Goods Sold
Bal. 9,600
1b. 58,000
3b. 4,000
Bal. 54,000
Mdse. Inventory
Bal. 86,000
1b. 58,000
Transportation-out
3b. 4,000
2. 900
Bal. 32,000
Bal. 900
4-50
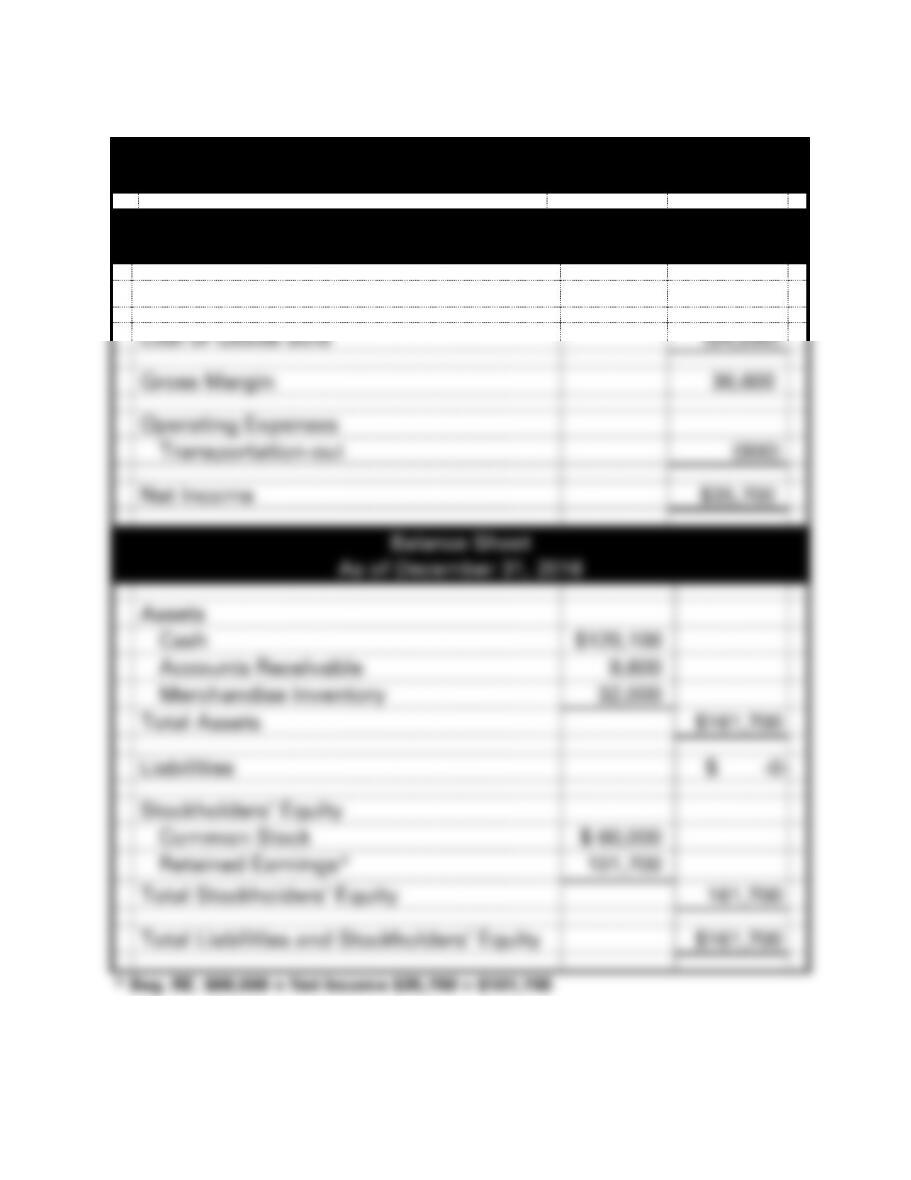
EXERCISE 4-16A (cont.)
c.
Powell Company
Financial Statements
Income Statement
For the Year Ended December 31, 2016
Net Sales
$90,600
Cost of Goods Sold
(54,000)
Gross Margin
36,600
Operating Expenses
Transportation-out
(900)
Net Income
$35,700
Balance Sheet
As of December 31, 2016
Assets
Cash
$120,100
Accounts Receivable
9,600
Merchandise Inventory
32,000
Total Assets
$161,700
Liabilities
$ -0-
Stockholders’ Equity
Common Stock
$ 60,000
Retained Earnings*
101,700
Total Stockholders’ Equity
161,700
Total Liabilities and Stockholders’ Equity
$161,700
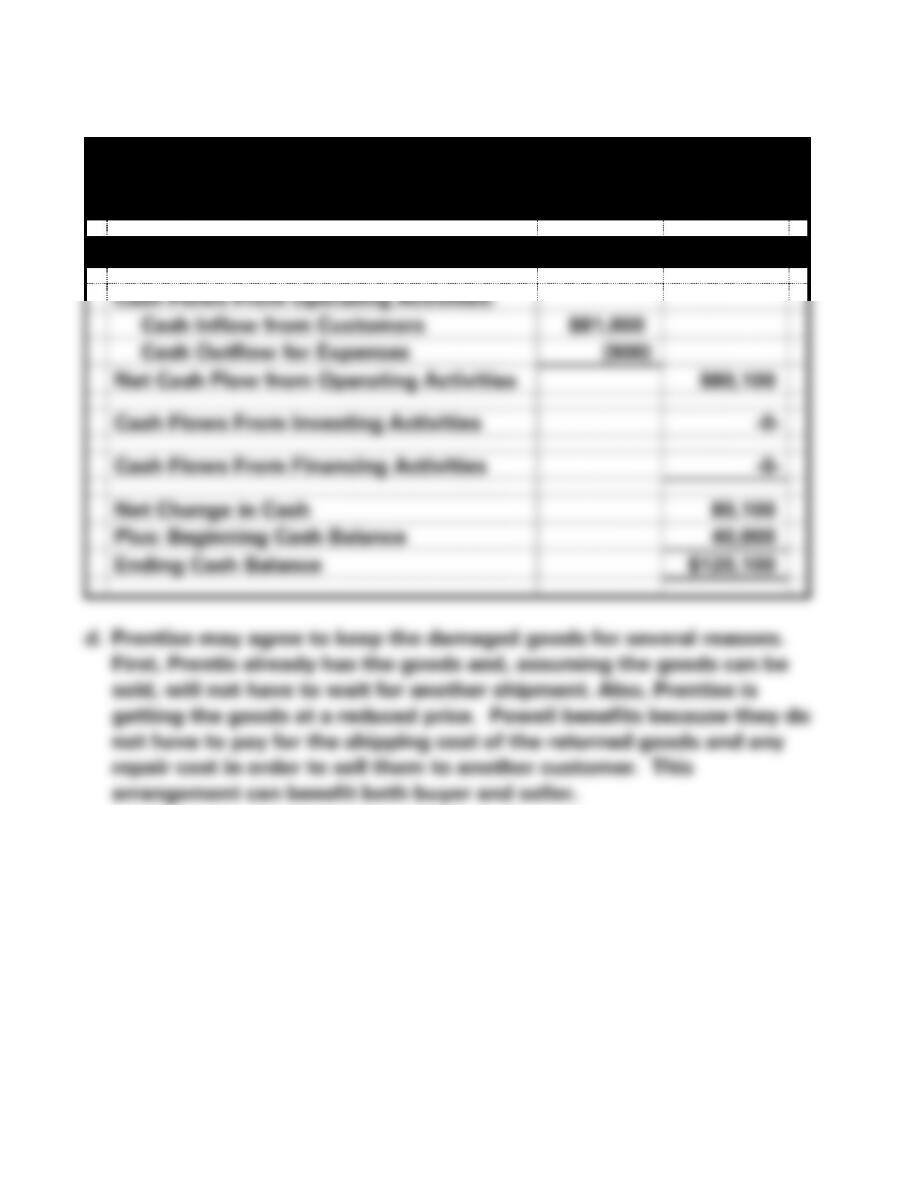
4-51
EXERCISE 4-16A c. (cont.)
Powell Company
Financial Statements
For the Year Ended December 31, 2016
Statement of Cash Flows
Cash Flows From Operating Activities:
Cash Inflow from Customers
$81,000
Cash Outflow for Expenses
(900)
Net Cash Flow from Operating Activities
$80,100
Cash Flows From Investing Activities
-0-
Cash Flows From Financing Activities
-0-
Net Change in Cash
80,100
Plus: Beginning Cash Balance
40,000
Ending Cash Balance
$120,100
4-52
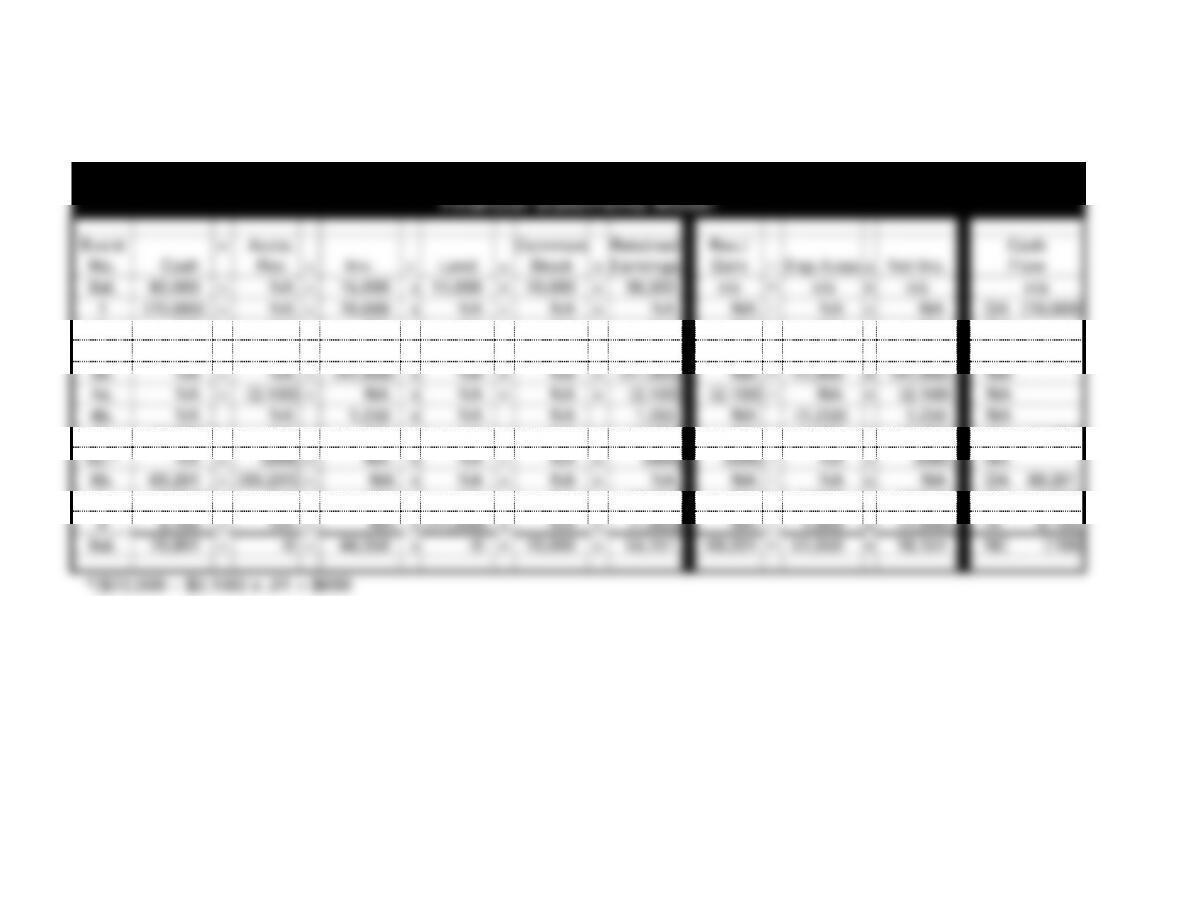
EXERCISE 4-17A
a.
Junker’s Stash
Financial Statements Model
Event
No.
Cash
+
Accts.
Rec
+
Inv.
+
Land
=
Common
Stock
+
Retained
Earnings
Rev./
Gain
─
Exp./Loss
=
Net Inc.
Cash
Flow
Bal.
80,000
+
NA
+
15,000
+
11,000
=
70,000
+
36,000
n/a
─
n/a
=
n/a
n/a
1
(70,000)
+
NA
+
70,000
+
NA
=
NA
+
NA
NA
─
NA
=
NA
OA (70,000)
2.
NA
+
NA
+
NA
+
NA
=
NA
+
NA
NA
─
NA
=
NA
NA
3a.
NA
+
72,000
+
NA
+
NA
=
NA
+
72,000
72,000
─
NA
=
72,000
NA
3b.
NA
+
NA
+
(41,900)
+
NA
=
NA
+
(41,900)
NA
─
41,900
=
(41,900)
NA
4a.
NA
+
(2,100)
+
NA
+
NA
=
NA
+
(2,100)
(2,100)
─
NA
=
(2,100)
NA
4b.
NA
NA
1,250
+
NA
NA
1,250
NA
(1,250)
1,250
NA
5.
(1,650)
+
NA
+
NA
+
NA
=
NA
+
(1,650)
NA
─
1,650
=
(1,650)
OA (1,650)
6a.*
NA
+
(699)
+
NA
+
NA
=
NA
+
(699)
(699)
─
NA
=
(699)
NA
6b.
69,201
+
(69,201)
+
NA
+
NA
=
NA
+
NA
NA
─
NA
=
NA
OA 69,201
7.
(6,850)
+
NA
+
NA
+
NA
=
NA
+
(6,850)
NA
─
6,850
=
(6,850)
OA (6,850)
8
9,100
+
NA
+
NA
+
(11,000)
=
NA
+
(1,900)
NA
─
1,900
=
(1,900)
IA 9,100
Bal.
79,801
+
-0-
+
44,350
+
-0-
=
70,000
+
54,151
69,201
─
51,050
=
18,151
NC (199)
*($72,000 − $2,100) x .01 = $699
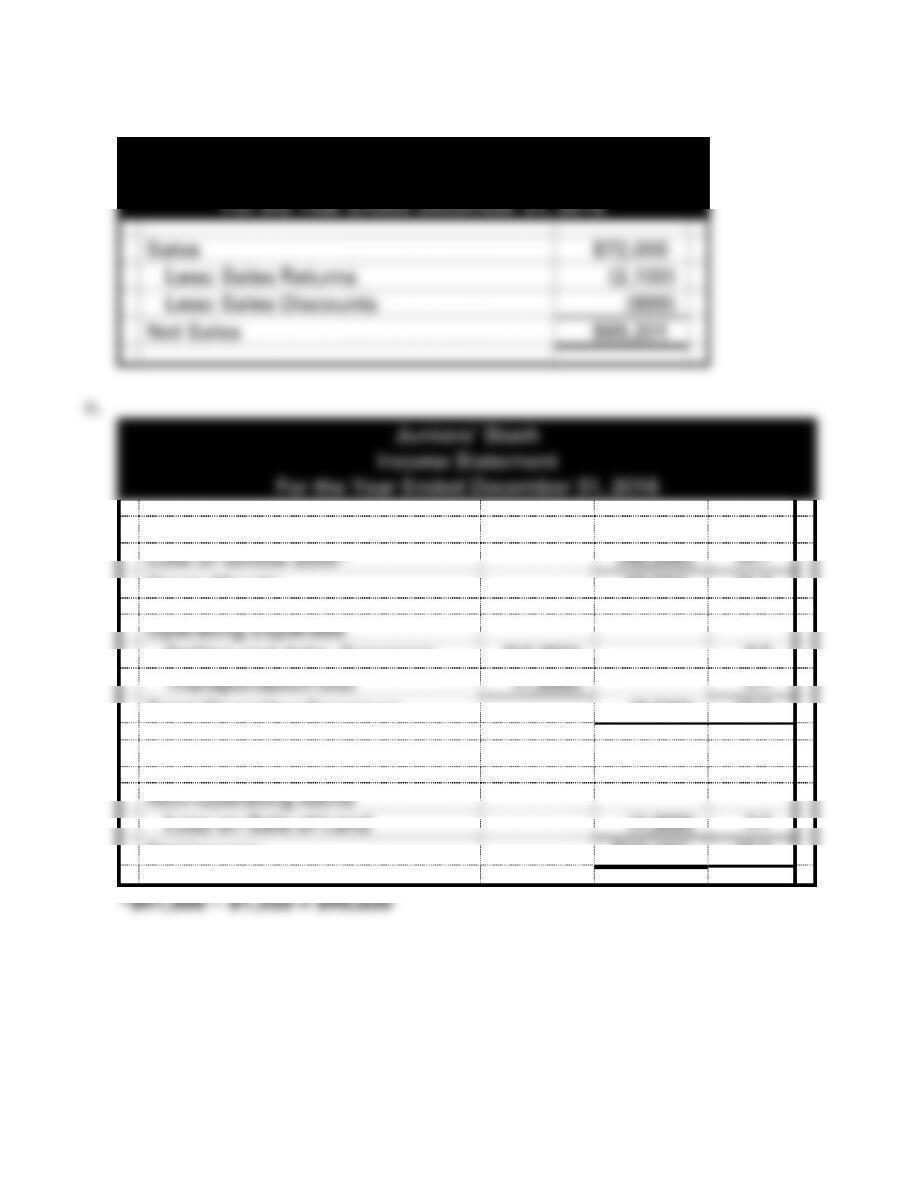
EXERCISE 4-17A (cont.)
b.
Junker’s Stash
Calculation of Net Sales
For the Year Ended December 31, 2016
Sales
$72,000
Less: Sales Returns
(2,100)
Less: Sales Discounts
(699)
Net Sales
$69,201
Net Sales
Cost of Goods Sold*
Gross Margin
Operating Expenses
Selling and Adm. Expenses
Transportation-Out
Total Operating Expenses
Operating Income
Non-Operating Items
Loss on Sale of Land
4-54
EXERCISE 4-17A (cont.)
d. All other things being equal, the lower the return on sales ratio, the
(29.0%), and given that sales were approximately the same in both
years, then it is apparent that the increase in the operating income
4-55
EXERCISE 4-18A
a. Gross Margin Percentages:
Denver: 40% ($76,000 ÷ $190,000)
Reno: 30% ($54,000 ÷ $180,000)
4-56
EXERCISE 4-19A
a.
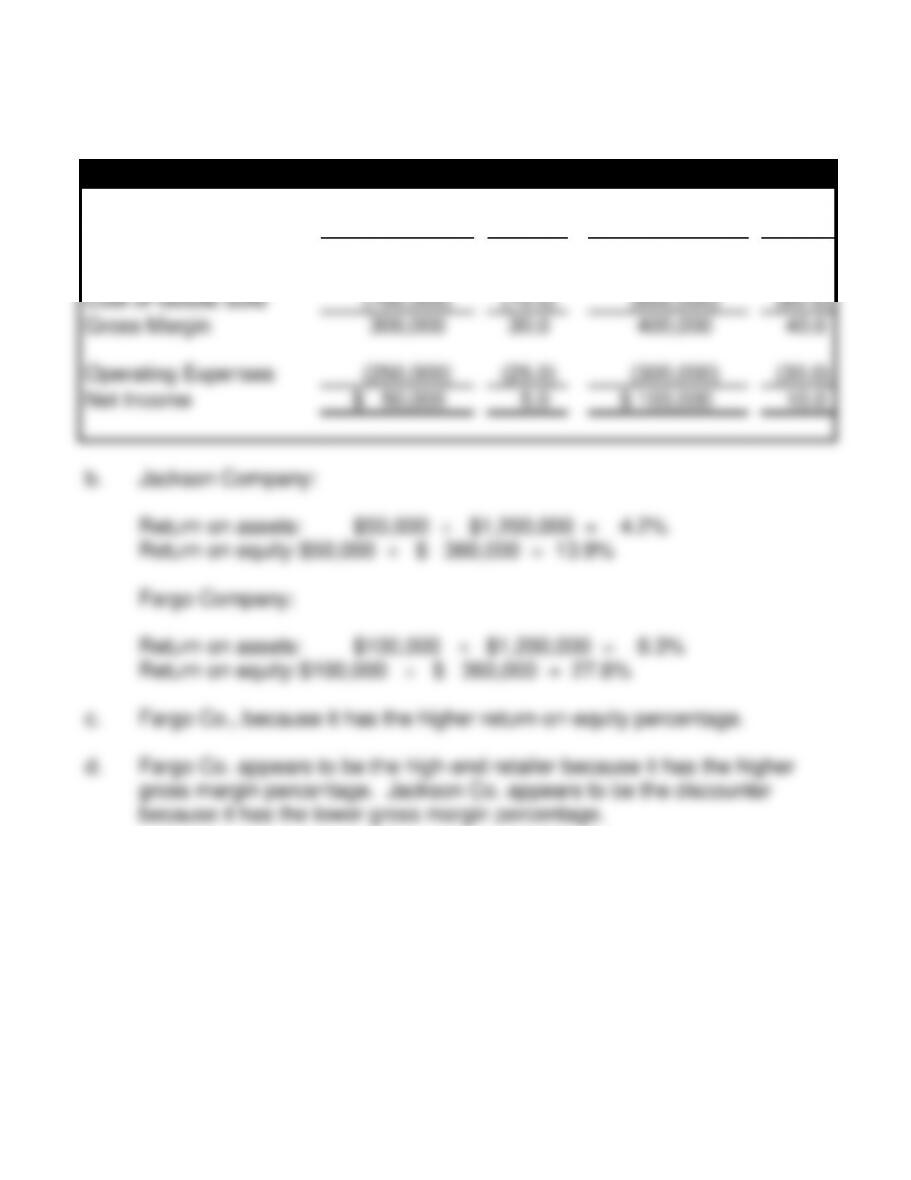
Common Size Income Statements
Jackson
%
Fargo
%
Sales
$1,000,000
100.0
$1,000,000
100.0
Cost of Goods Sold
(700,000)
(70.0)
(600,000)
(60.0)
Gross Margin
300,000
30.0
400,000
40.0
Operating Expenses
(250,000)
(25.0)
(300,000)
(30.0)
Net Income
$ 50,000
5.0
$ 100,000
10.0
b. Jackson Company:
Return on assets: $50,000 ÷ $1,200,000 = 4.2%
Return on equity: $50,000 ÷ $ 360,000 = 13.9%
Fargo Company:
Return on assets: $100,000 ÷ $1,200,000 = 8.3%
Return on equity: $100,000 ÷ $ 360,000 = 27.8%
c. Fargo Co., because it has the higher return-on-equity percentage.
d. Fargo Co. appears to be the high-end retailer because it has the higher
gross margin percentage. Jackson Co. appears to be the discounter
because it has the lower gross margin percentage.
4-57
EXERCISE 4-20A (Appendix)
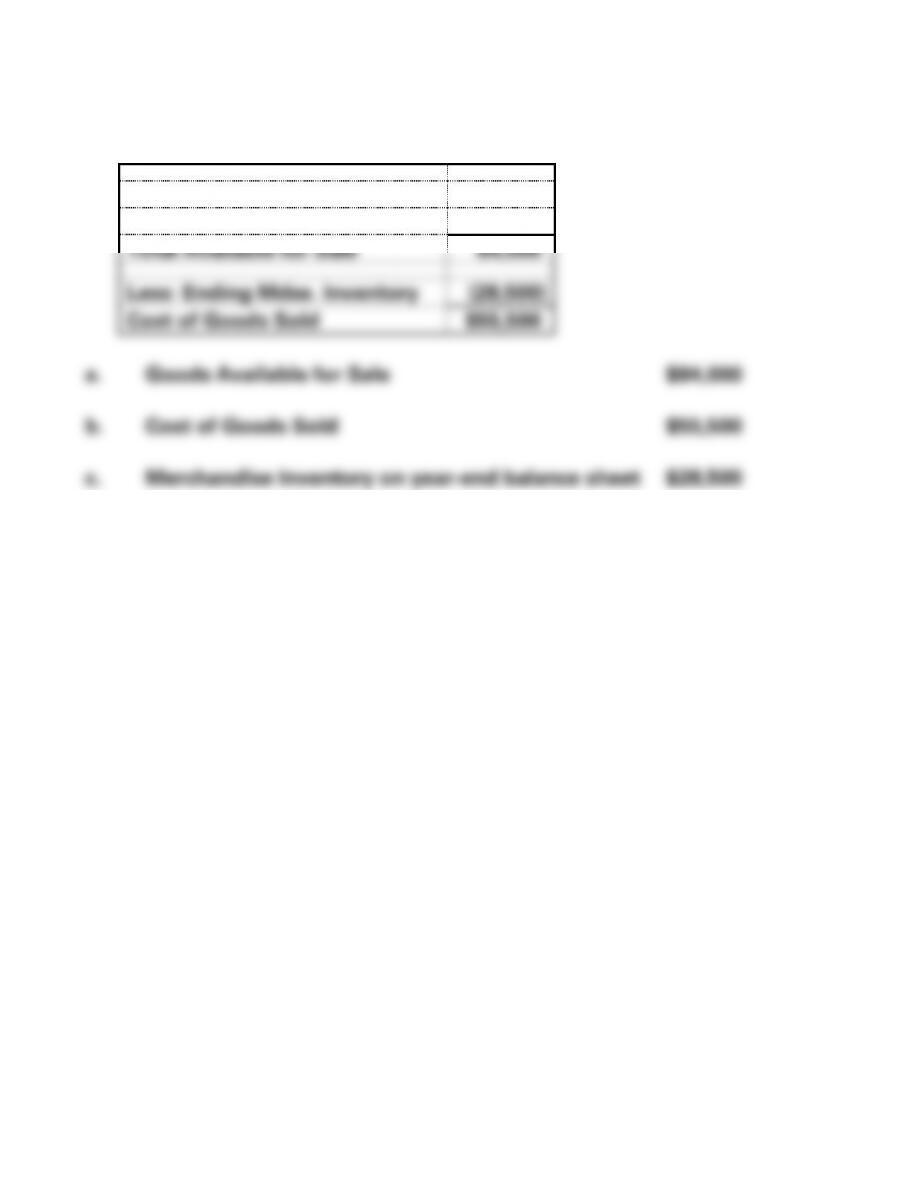
Beginning Mdse. Inventory
$18,000
Plus: Merchandise Purchased
66,000
Total Available for Sale
84,000
Less: Ending Mdse. Inventory
(28,500)
Cost of Goods Sold
$55,500
4-58
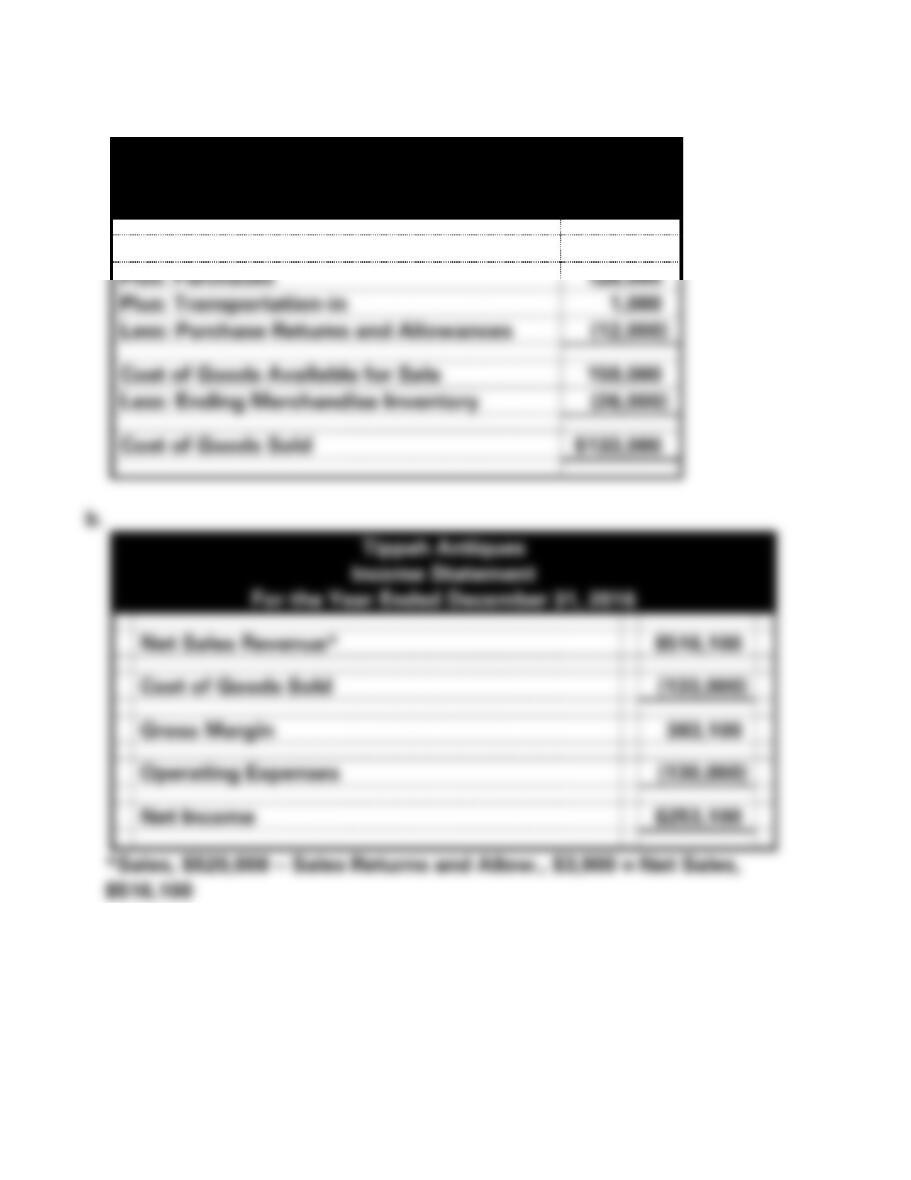
EXERCISE 4-21A (Appendix)
a.
Tippah Antiques
Schedule of Cost of Goods Sold
For the Year Ended December 31, 2016
Beginning Merchandise Inventory
$ 42,000
Plus: Purchases
128,000
Plus: Transportation-in
1,000
Less: Purchase Returns and Allowances
(12,000)
Cost of Goods Available for Sale
159,000
Less: Ending Merchandise Inventory
(26,000)
Cost of Goods Sold
$133,000
b.
Tippah Antiques
Income Statement
For the Year Ended December 31, 2016
Net Sales Revenue*
$516,100
Cost of Goods Sold
(133,000)
Gross Margin
383,100
Operating Expenses
(130,000)
Net Income
$253,100
*Sales, $520,000 − Sales Returns and Allow., $3,900 = Net Sales,
$516,100
4-59
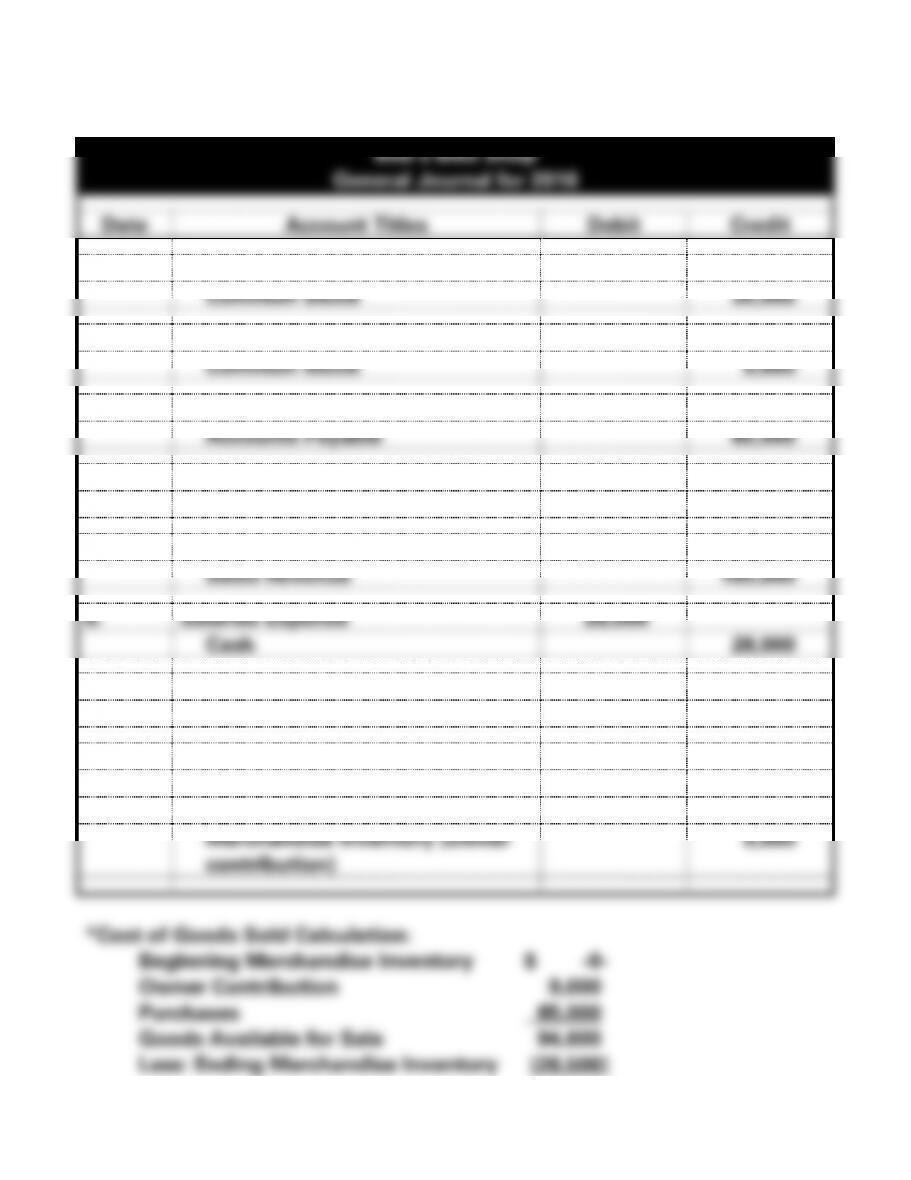
EXERCISE 4-22A (Appendix)
a.
Bob’s Bike Shop
General Journal for 2016
Date
Account Titles
Debit
Credit
1.
Cash
35,000
Common Stock
35,000
2.
Merchandise Inventory
9,600
Common Stock
9,600
3.
Purchases
85,000
Accounts Payable
85,000
4.
Advertising Expense
2,800
Cash
2,800
5.
Cash
165,000
Sales Revenue
165,000
6.
Salaries Expense
28,000
Cash
28,000
7.
Accounts Payable
65,000
Cash
65,000
8. (adj.)
Cost of Goods Sold*
66,100
Merchandise Inventory (Ending)
28,500
Purchases
85,000
Merchandise Inventory (owner
contribution)
9,600

4-60