4-115
EXERCISE 4-13B (cont.)
c. Net income decreased by 34%.
4-116
EXERCISE 4-14B
a.
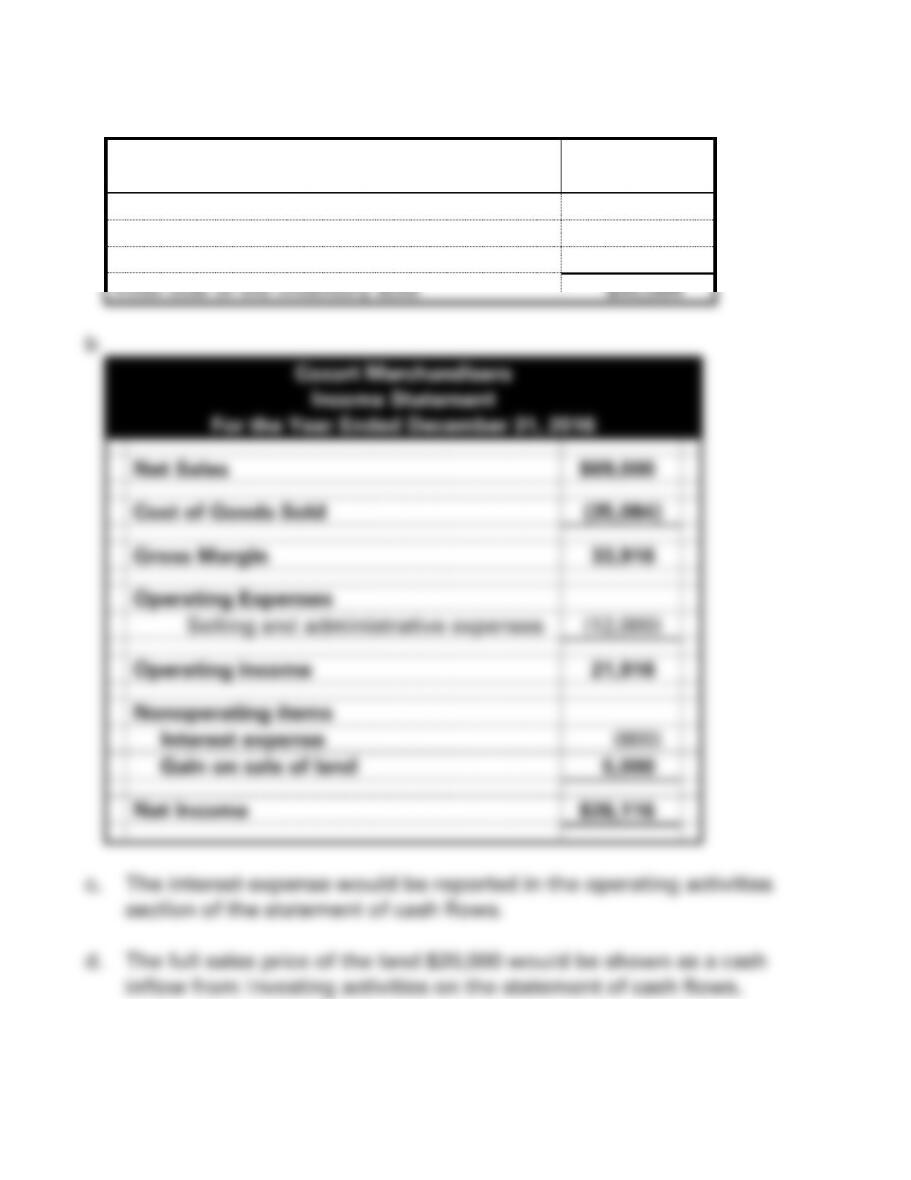
Cozart Merchandisers
Cost of inventory purchase
$40,000
Minus Purchase returns
(4,200)
Minus Purchase discounts ($35,800 x .02)
(716)
Total cost of the inventory sold
$35,084
4-117
e. A loss occurs from activities that are not part of the normal recurring
4-118
EXERCISE 4-15B
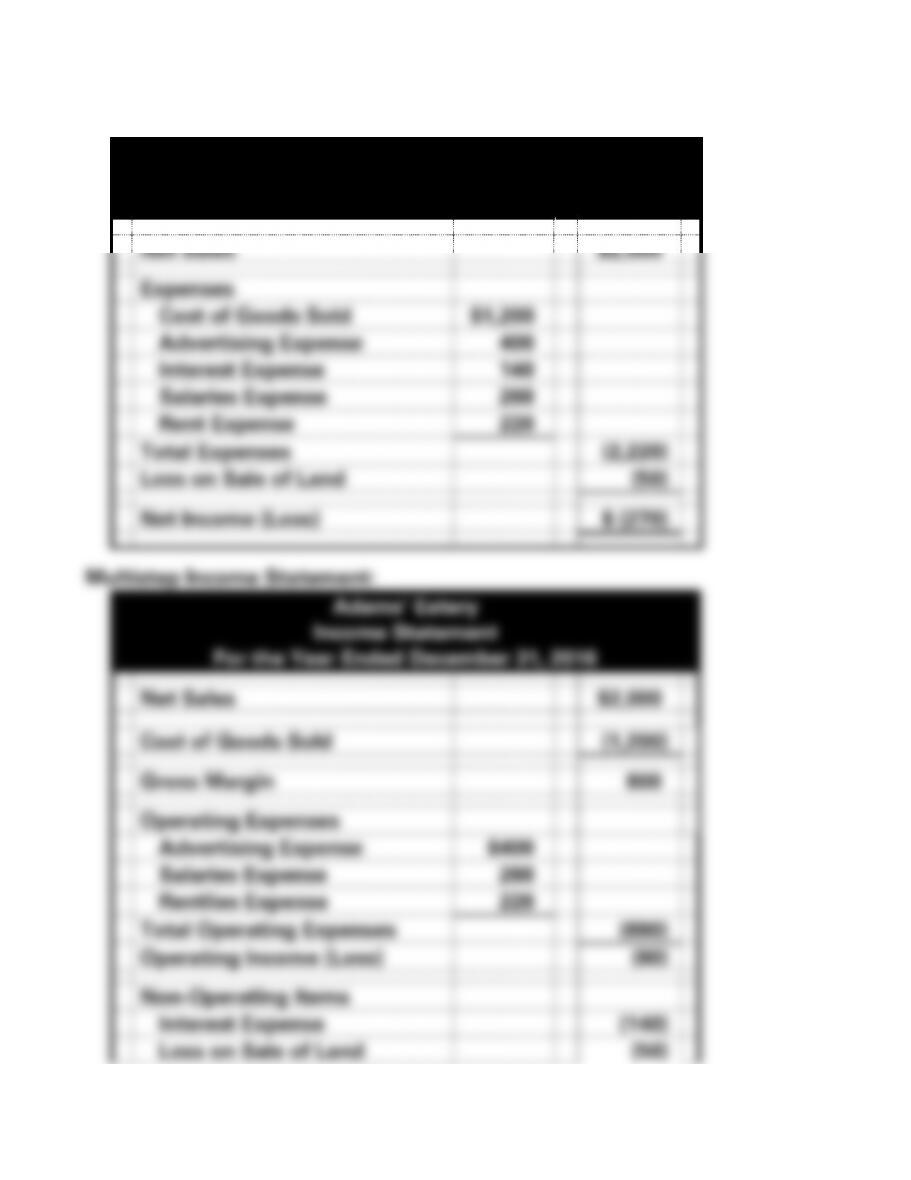
Single-Step Income Statement:
Adams’ Eatery
Income Statement
For the Year Ended December 31, 2016
Net Sales
$2,000
Expenses
Cost of Goods Sold
$1,200
Advertising Expense
400
Interest Expense
140
Salaries Expense
260
Rent Expense
220
Total Expenses
(2,220)
Loss on Sale of Land
(50)
Net Income (Loss)
$ (270)
Multistep Income Statement:
Adams’ Eatery
Income Statement
For the Year Ended December 31, 2016
Net Sales
$2,000
Cost of Goods Sold
(1,200)
Gross Margin
800
Operating Expenses
Advertising Expense
$400
Salaries Expense
260
Rentlies Expense
220
Total Operating Expenses
(880)
Operating Income (Loss)
(80)
Non-Operating Items
Interest Expense
(140)
Loss on Sale of Land
(50)
4-119
Net Income (Loss)
$ (270)
EXERCISE 4-16B
a.
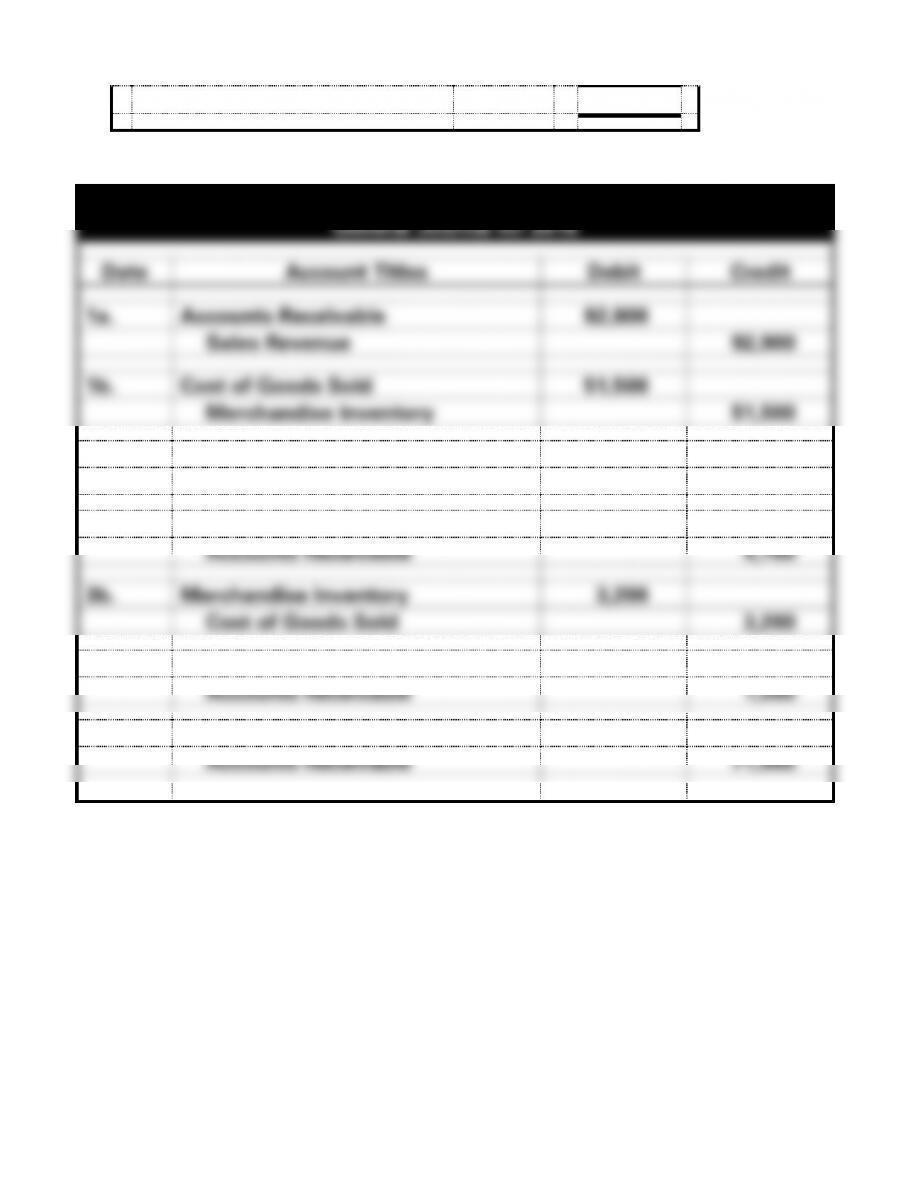
Hollis Company
General Journal for 2016
Date
Account Titles
Debit
Credit
1a.
Accounts Receivable
92,900
Sales Revenue
92,900
1b.
Cost of Goods Sold
51,500
Merchandise Inventory
51,500
2.
Transportation-out
500
Cash
500
3a.
Sales Revenue
4,700
Accounts Receivable
4,700
3b.
Merchandise Inventory
3,200
Cost of Goods Sold
3,200
4.
Sales Revenue
1,500
Accounts Receivable
1,500
5.
Cash
71,000
Accounts Receivable
71,000
4-120
EXERCISE 4-16B (cont.)
b.
Hollis Company
T-Accounts for 2016
Assets
=
Stockholders’ Equity
Cash
Common Stock
Retained Earnings
Bal. 36,000
Bal. 70,000
Bal. 46,000
5. 71,000
2. 500
Bal. 106,500
Sales Revenue
3a. 4,700
1a. 92,900
Accounts Receivable
4. 1,500
1a. 92,900
3a. 4,700
Bal. 86,700
4. 1,500
5. 71,000
Cost of Goods Sold
Bal. 15,700
1b. 51,500
3b. 3,200
Bal. 48,300
Mdse. Inventory
Bal. 80,000
Transportation-out
3b. 3,200
1b. 51,500
2. 500
Bal. 31,700
Bal. 500
4-121
EXERCISE 4-16B (cont.)
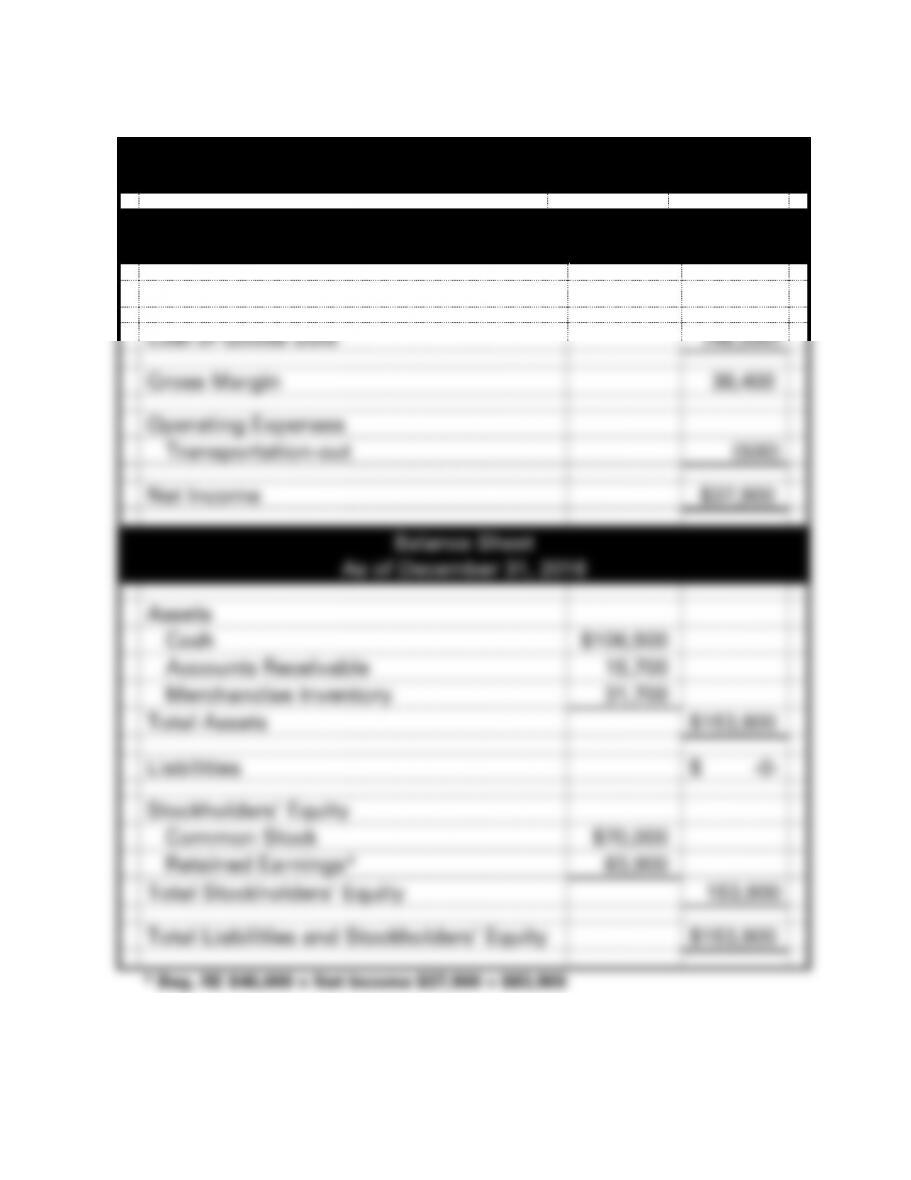
c.
Hollis Company
Financial Statements
Income Statement
For the Year Ended December 31, 2016
Net Sales
$86,700
Cost of Goods Sold
(48,300)
Gross Margin
38,400
Operating Expenses
Transportation-out
(500)
Net Income
$37,900
Balance Sheet
As of December 31, 2016
Assets
Cash
$106,500
Accounts Receivable
15,700
Merchandise Inventory
31,700
Total Assets
$153,900
Liabilities
$ -0-
Stockholders’ Equity
Common Stock
$70,000
Retained Earnings*
83,900
Total Stockholders’ Equity
153,900
Total Liabilities and Stockholders’ Equity
$153,900
4-122
EXERCISE 4-16B c. (cont.)
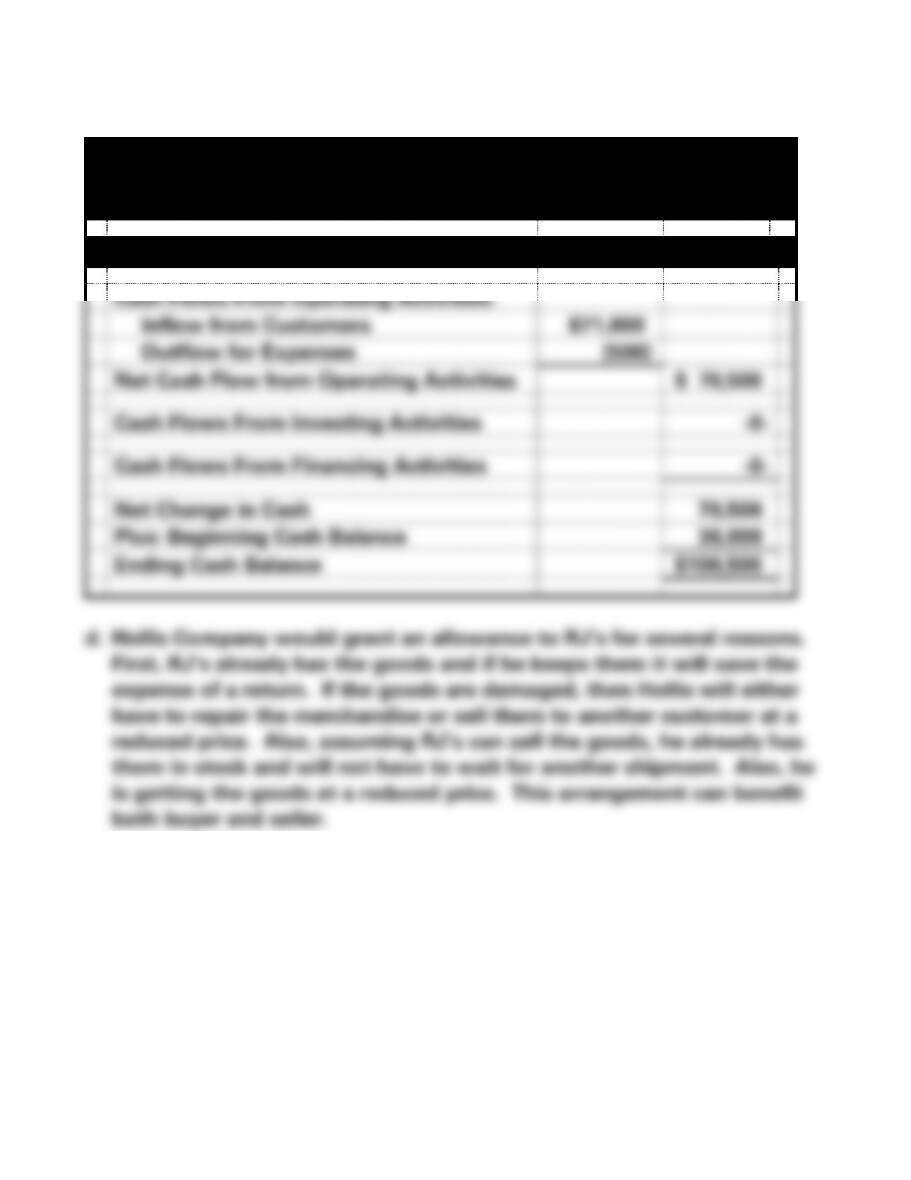
Hollis Company
Financial Statements
For the Year Ended December 31, 2016
Statement of Cash Flows
Cash Flows From Operating Activities:
Inflow from Customers
$71,000
Outflow for Expenses
(500)
Net Cash Flow from Operating Activities
$ 70,500
Cash Flows From Investing Activities
-0-
Cash Flows From Financing Activities
-0-
Net Change in Cash
70,500
Plus: Beginning Cash Balance
36,000
Ending Cash Balance
$106,500
4-123
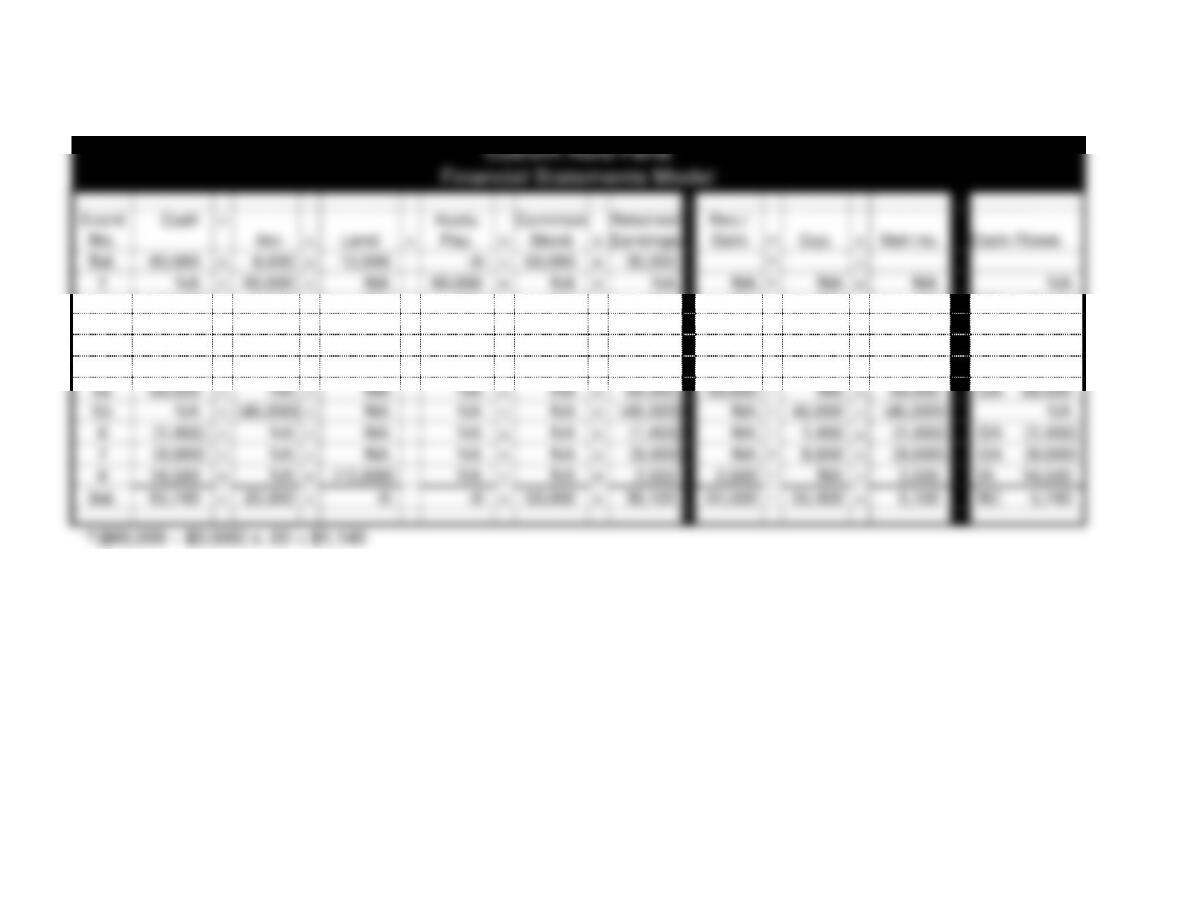
EXERCISE 4-17B
a. NC = Net Change in Cash
Custom Auto Parts
Financial Statements Model
Event
No.
Cash
+
Inv.
+
Land
+
Accts.
Pay.
=
Common
Stock
+
Retained
Earnings
Rev./
Gain
─
Exp.
=
Net Inc.
Cash Flows
Bal.
60,000
+
8,000
+
12,000
-0-
=
50,000
+
30,000
─
=
1
NA
+
60,000
+
NA
60,000
=
NA
+
NA
NA
─
NA
=
NA
NA
2.
(1,500)
+
1,500
+
NA
NA
=
NA
+
NA
NA
─
NA
=
NA
OA (1,500)
3.
NA
+
(3,000)
+
NA
(3,000)
=
NA
+
NA
NA
─
NA
=
NA
NA
4a*
NA
+
(1,140)
+
NA
(1,140)
=
NA
+
NA
NA
─
NA
=
NA
NA
4b
(55,860)
+
NA
+
NA
(55,860)
=
NA
+
NA
NA
─
NA
=
NA
OA (55,860)
5a
59,000
+
NA
+
NA
NA
=
NA
+
59,000
59,000
─
NA
=
59,000
OA 59,000
5b
NA
+
(45,000)
+
NA
NA
=
NA
+
(45,000)
NA
─
45,000
=
(45,000)
NA
6
(1,400)
+
NA
+
NA
NA
=
NA
+
(1,400)
NA
─
1,400
=
(1,400)
OA (1,400)
7
(9,000)
+
NA
+
NA
NA
=
NA
+
(9,000)
NA
─
9,000
=
(9,000)
OA (9,000)
8
14,500
+
NA
+
(12,000)
NA
=
NA
+
2,500
2,500
─
NA
=
2,500
IA 14,500
Bal.
65,740
+
20,360
+
-0-
-0-
=
50,000
+
36,100
61,500
─
55,400
=
6,100
NC 5,740
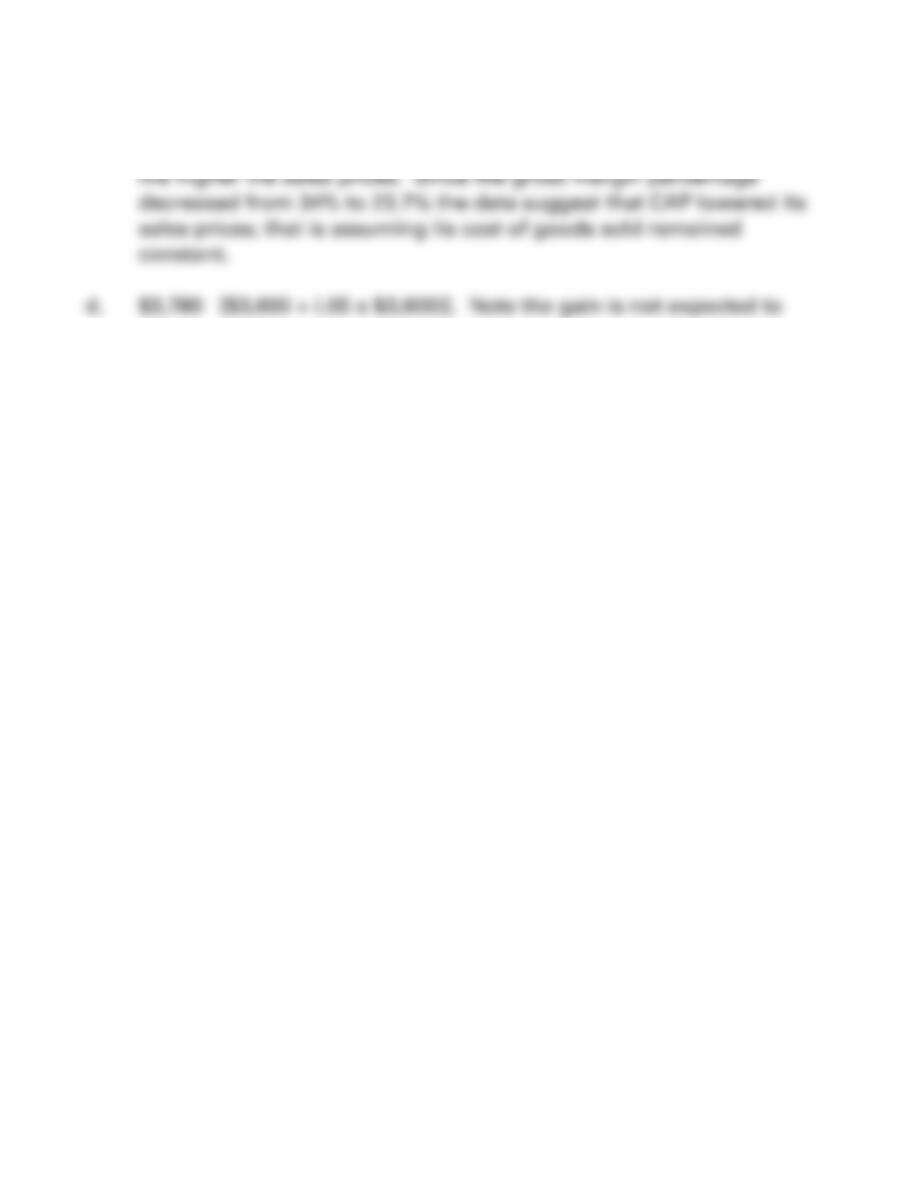
*($60,000 − $3,000) x .02 = $1,140
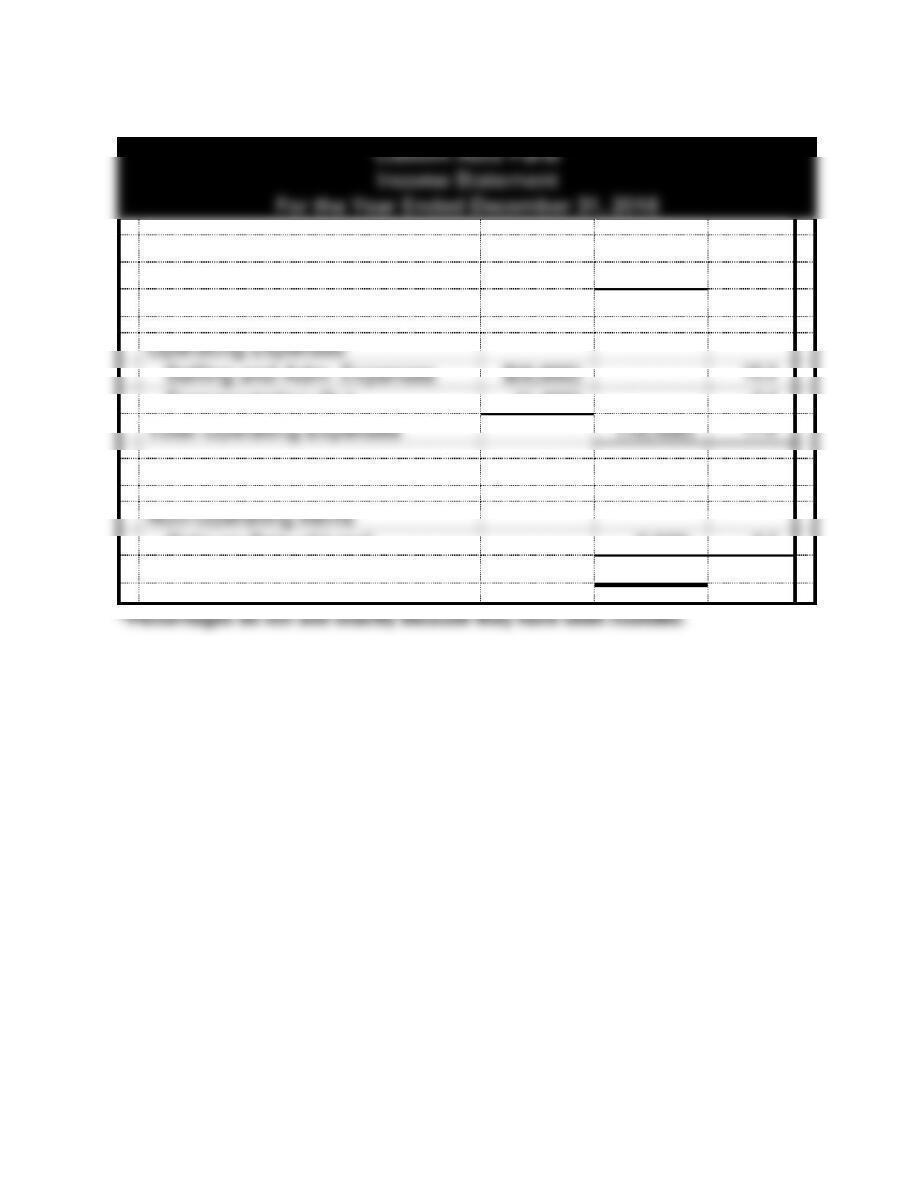
EXERCISE 4-17B (cont.)
b.
Custom Auto Parts
Income Statement
For the Year Ended December 31, 2016
Net Sales
$59,000
100.0%
Cost of Goods Sold
(45,000)
76.3
Gross Margin
14,000
23.7
Operating Expenses
Selling and Adm. Expenses
$(9,000)
15.3
Transportation-Out
(1,400)
2.4
Total Operating Expenses
(10,400)
17.6
Operating Income
3,600
6.1
Non-Operating Items
Gain on Sale of Land
2,500
4.2
Net Income
$6,100
10.3
4-125
EXERCISE 4-17B (cont.)
c. All other things being equal, the higher the gross margin percentage,
recur.
4-126
EXERCISE 4-18B
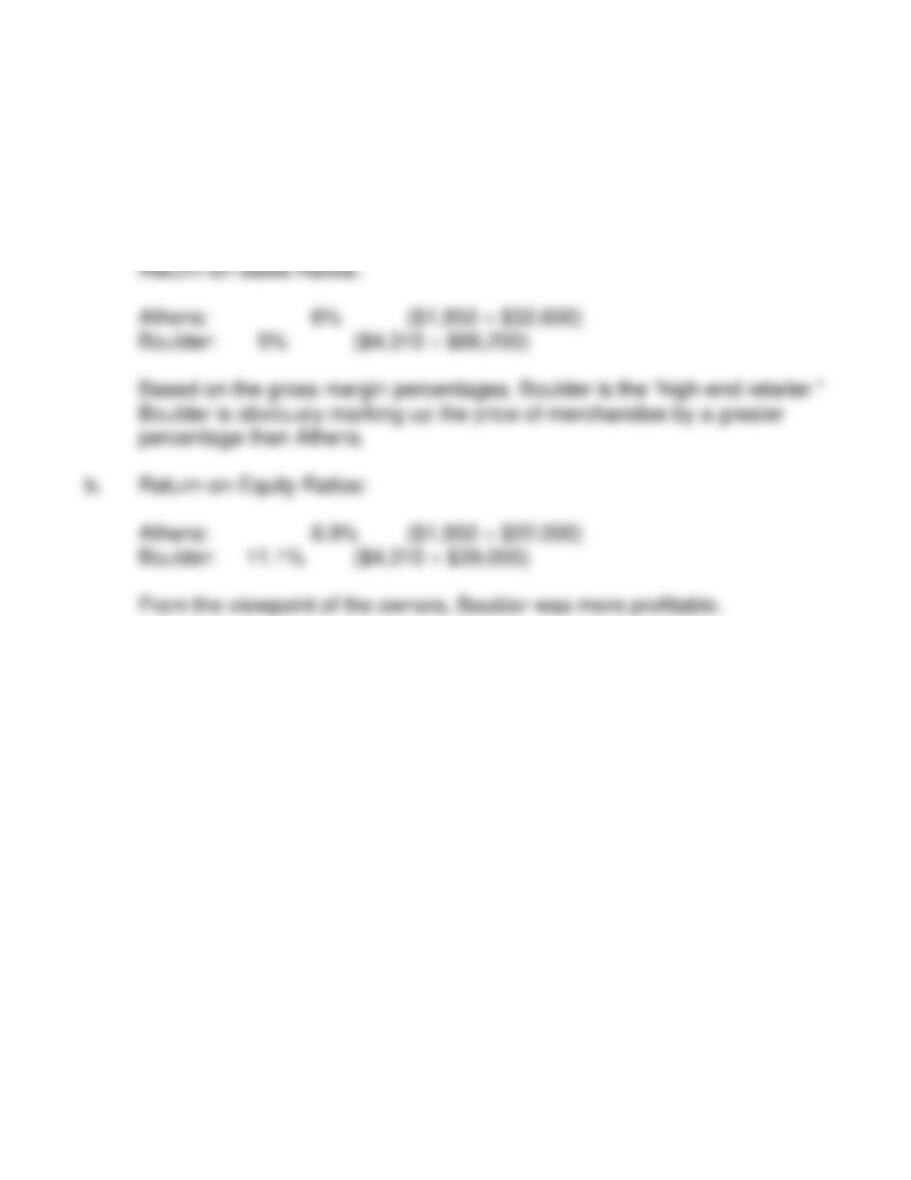
a. Gross Margin Percentages:
Athens: 25% ($ 8,150 ÷ $32,600)
Boulder: 45% ($38,790 ÷ $86,200)
4-127
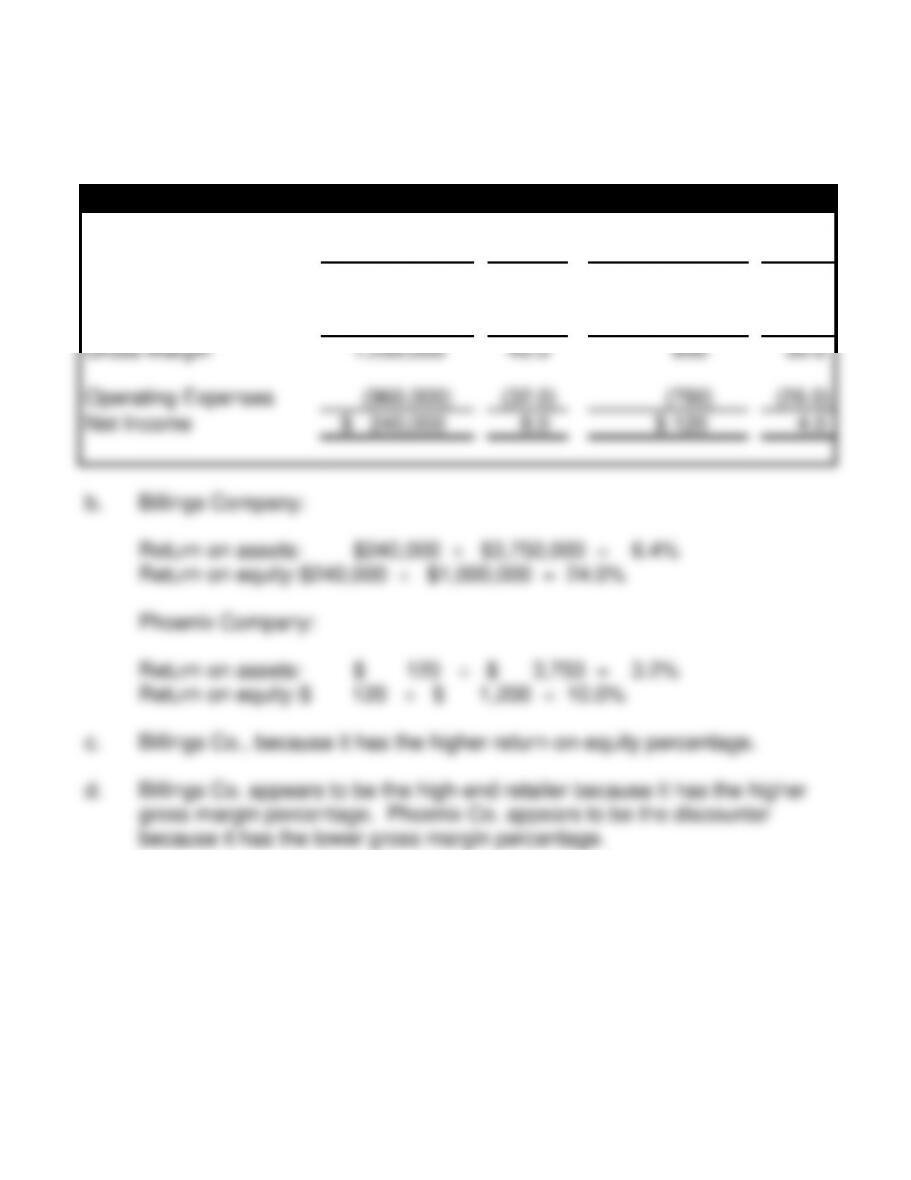
EXERCISE 4-19B
a.
Common Size Income Statements
Billings
%
Phoenix
%
Sales
$3,000,000
100.0
$3,000
100.0
Cost of Goods Sold
(1,800,000)
(60.0)
(2,100)
(70.0)
Gross Margin
1,200,000
40.0
900
30.0
Operating Expenses
(960,000)
(32.0)
(780)
(26.0)
Net Income
$ 240,000
8.0
$ 120
4.0
b. Billings Company:
Return on assets: $240,000 ÷ $3,750,000 = 6.4%
Return on equity: $240,000 ÷ $1,000,000 = 24.0%
Phoenix Company:
Return on assets: $ 120 ÷ $ 3,750 = 3.2%
Return on equity: $ 120 ÷ $ 1,200 = 10.0%
c. Billings Co., because it has the higher return–on-equity percentage.
d. Billings Co. appears to be the high-end retailer because it has the higher
gross margin percentage. Phoenix Co. appears to be the discounter
because it has the lower gross margin percentage.
4-128
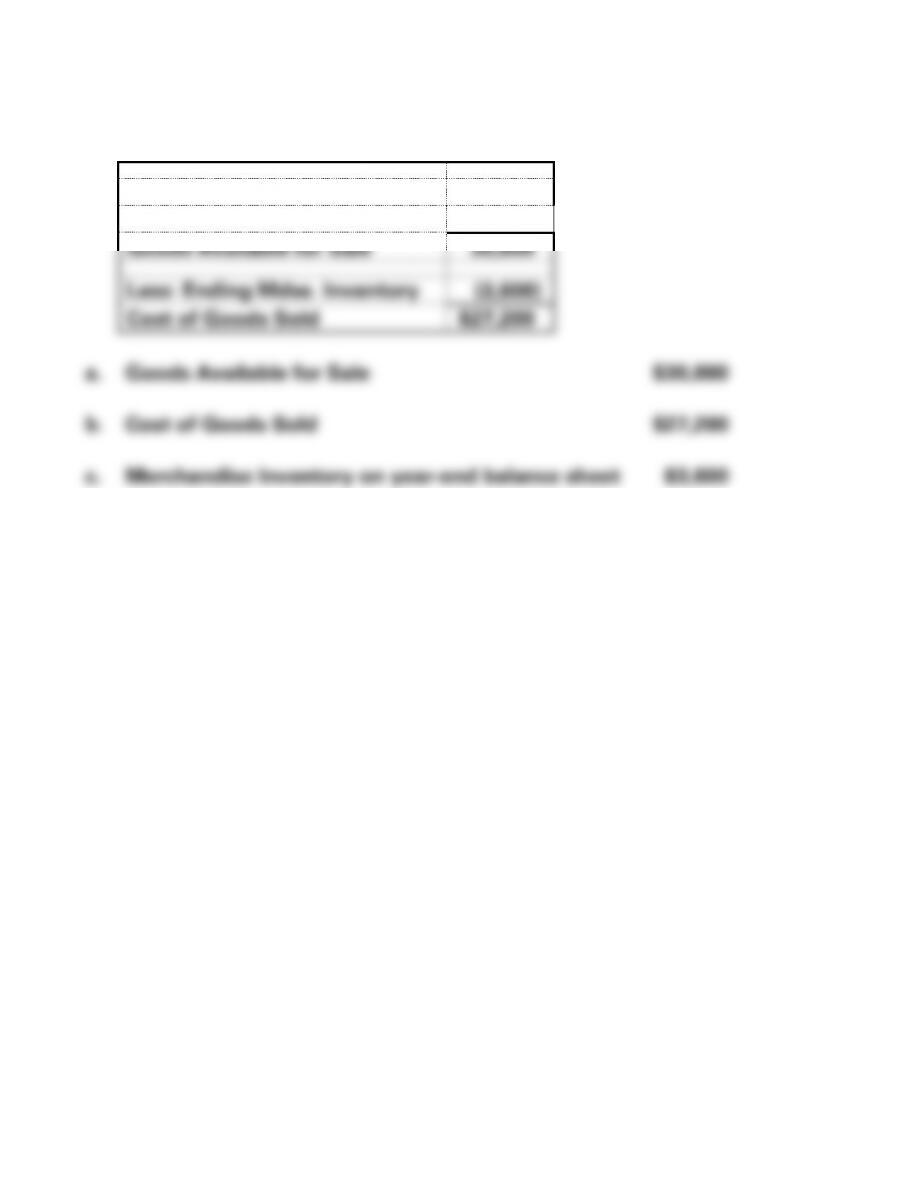
EXERCISE 4-20B (Appendix)
Beginning Mdse. Inventory
$ 4,800
Plus: Merchandise Purchased
26,000
Goods Available for Sale
30,800
Less: Ending Mdse. Inventory
(3,600)
Cost of Goods Sold
$27,200
a. Goods Available for Sale $30,800
b. Cost of Goods Sold $27,200
c. Merchandise Inventory on year-end balance sheet $3,600
4-129
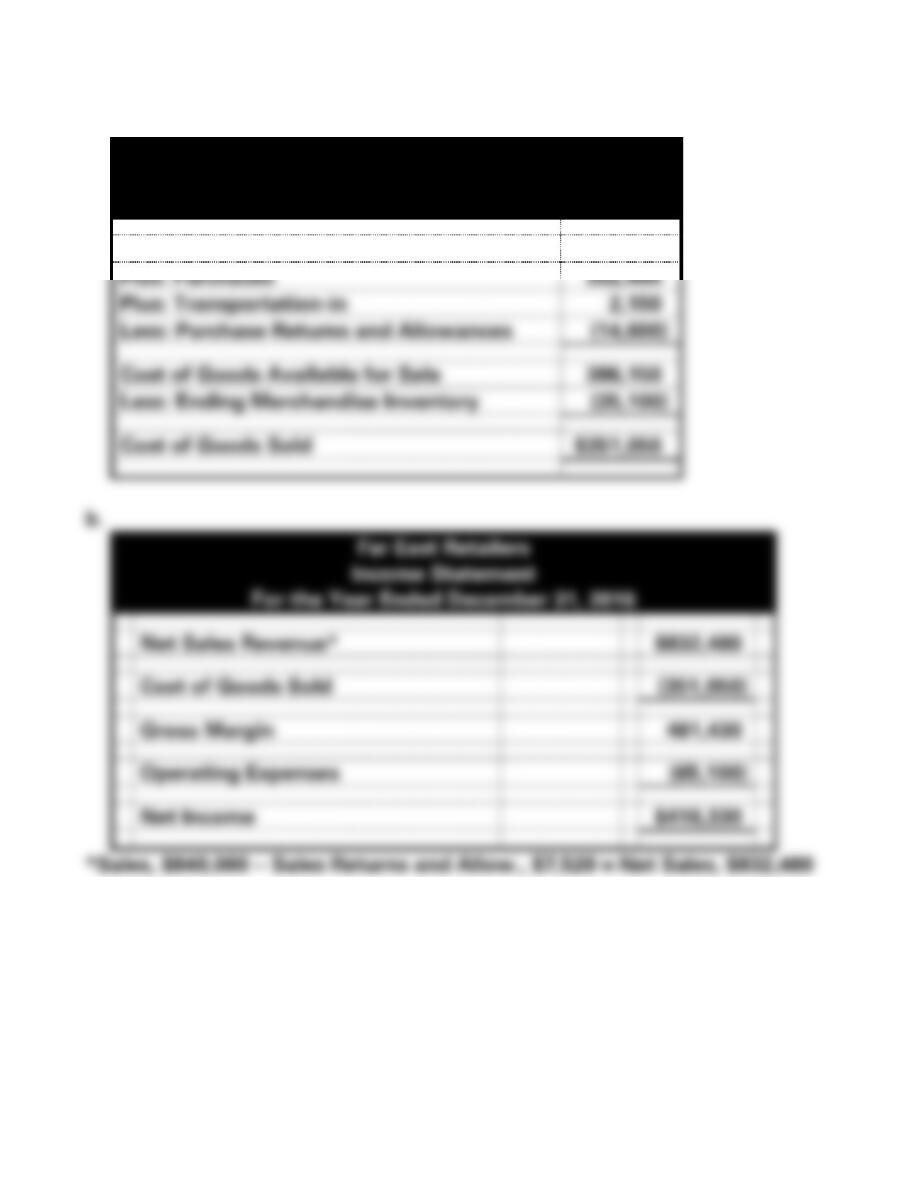
EXERCISE 4-21B (Appendix)
a.
Far East Retailers
Schedule of Cost of Goods Sold
For the Year Ended 2016
Beginning Merchandise Inventory
$ 46,200
Plus: Purchases
352,400
Plus: Transportation-in
2,150
Less: Purchase Returns and Allowances
(14,600)
Cost of Goods Available for Sale
386,150
Less: Ending Merchandise Inventory
(35,100)
Cost of Goods Sold
$351,050
b.
Far East Retailers
Income Statement
For the Year Ended December 31, 2016
Net Sales Revenue*
$832,480
Cost of Goods Sold
(351,050)
Gross Margin
481,430
Operating Expenses
(65,100)
Net Income
$416,330
*Sales, $840,000 − Sales Returns and Allow., $7,520 = Net Sales, $832,480
4-130
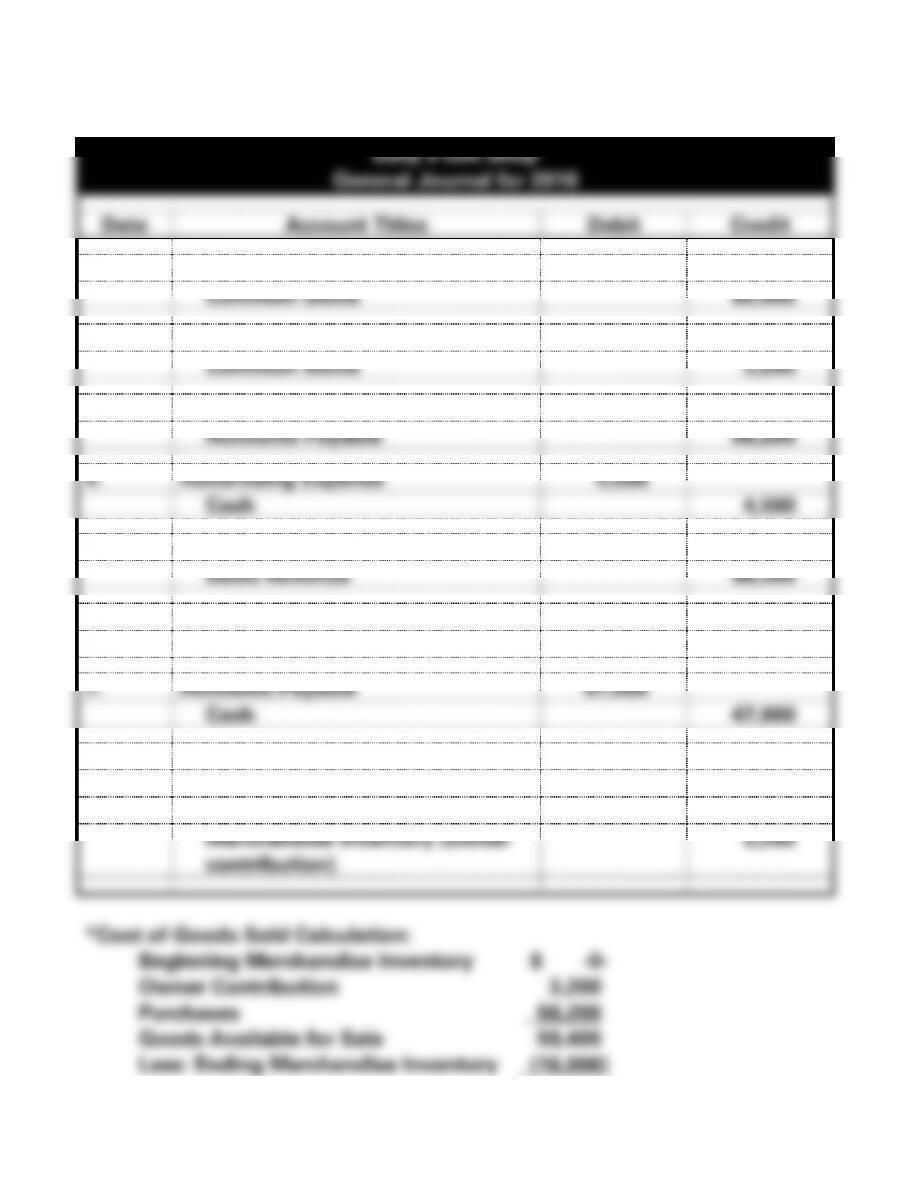
EXERCISE 4-22B (Appendix)
a.
Sally’s Gift Shop
General Journal for 2016
Date
Account Titles
Debit
Credit
1.
Cash
60,000
Common Stock
60,000
2.
Merchandise Inventory
3,200
Common Stock
3,200
3.
Purchases
56,200
Accounts Payable
56,200
4.
Advertising Expense
4,500
Cash
4,500
5.
Cash
98,300
Sales Revenue
98,300
6.
Salaries Expense
12,000
Cash
12,000
7.
Accounts Payable
47,000
Cash
47,000
8. (adj.)
Cost of Goods Sold*
43,400
Merchandise Inventory (Ending)
16,000
Purchases
56,200
Merchandise Inventory (owner
contribution)
3,200

4-131
Cost of Goods Sold $43,400
4-132
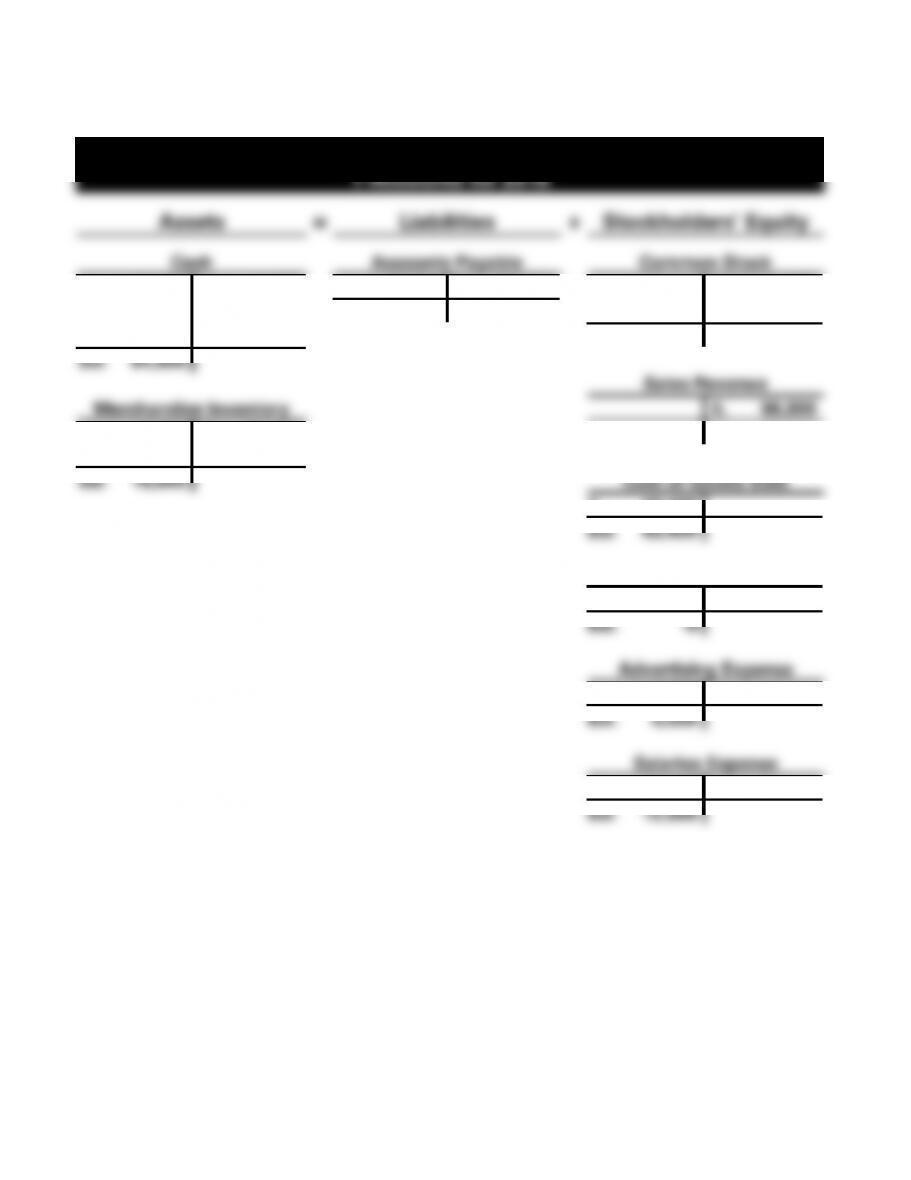
EXERCISE 4-22B (cont.)
b.
Sally’s Gift Shop
T-Accounts for 2016
Assets
=
Liabilities
+
Stockholders’ Equity
Cash
Accounts Payable
Common Stock
1. 60,000
4. 4,500
7. 47,000
3. 56,200
1. 60,000
5. 98,300
6. 12,000
Bal. 9,200
2. 3,200
7. 47,000
Bal. 63,200
Bal. 94,800
Sales Revenue
Merchandise Inventory
5. 98,300
2. 3,200
8. 43,400
Bal. 98,300
8. 56,200
Bal. 16,000
Cost of Goods Sold
8. 43,400
Bal. 43,400
Purchases
3. 56,200
8. 56,200
Bal. -0-
Advertising Expense
4. 4,500
Bal. 4,500
Salaries Expense
6. 12,000
Bal. 12,000
4-133
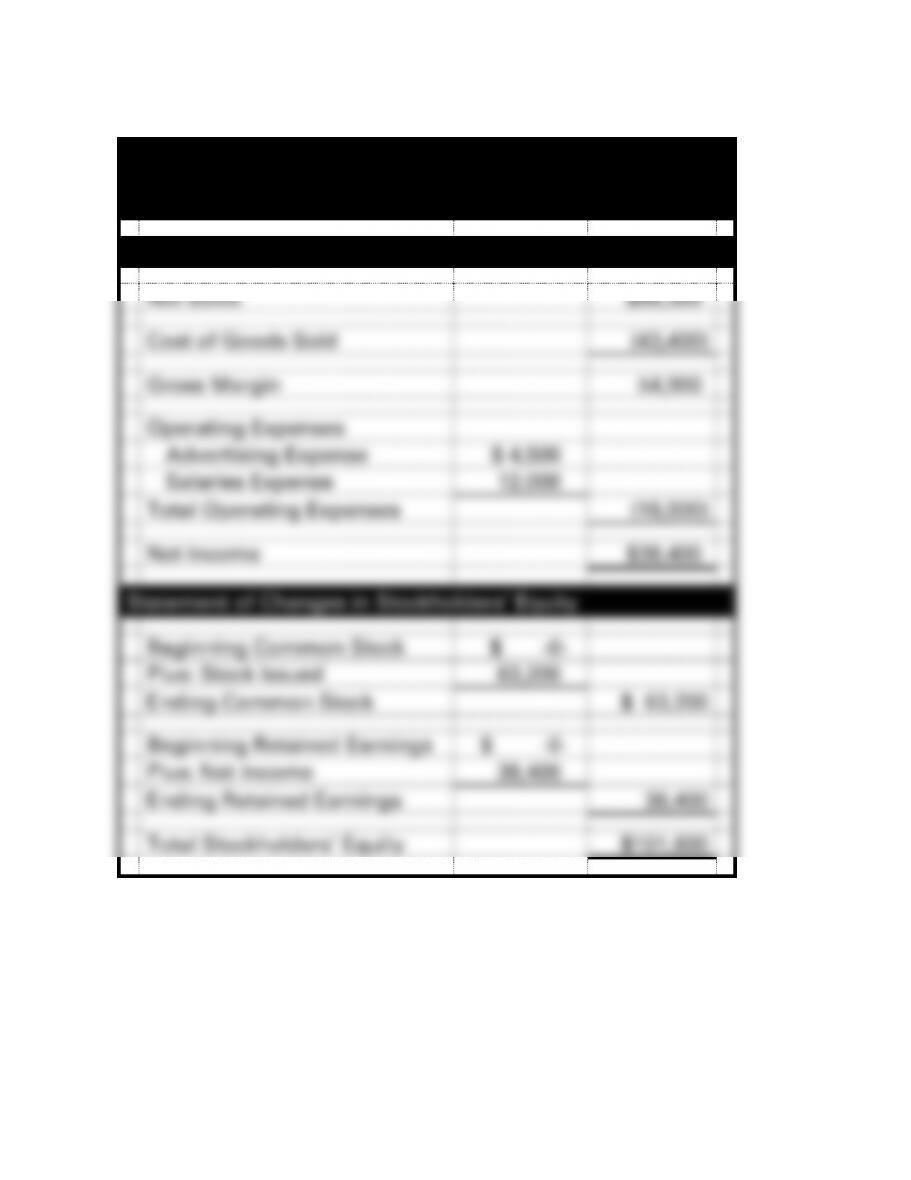
EXERCISE 4-22B (cont.)
c.
Sally’s Gift Shop
Financial Statements
For the Year Ended December 31, 2016
Income Statement
Net Sales
$98,300
Cost of Goods Sold
(43,400)
Gross Margin
54,900
Operating Expenses
Advertising Expense
$ 4,500
Salaries Expense
12,000
Total Operating Expenses
(16,500)
Net Income
$38,400
Statement of Changes in Stockholders’ Equity
Beginning Common Stock
$ -0-
Plus: Stock Issued
63,200
Ending Common Stock
$ 63,200
Beginning Retained Earnings
$ -0-
Plus: Net Income
38,400
Ending Retained Earnings
38,400
Total Stockholders’ Equity
$101,600
4-134
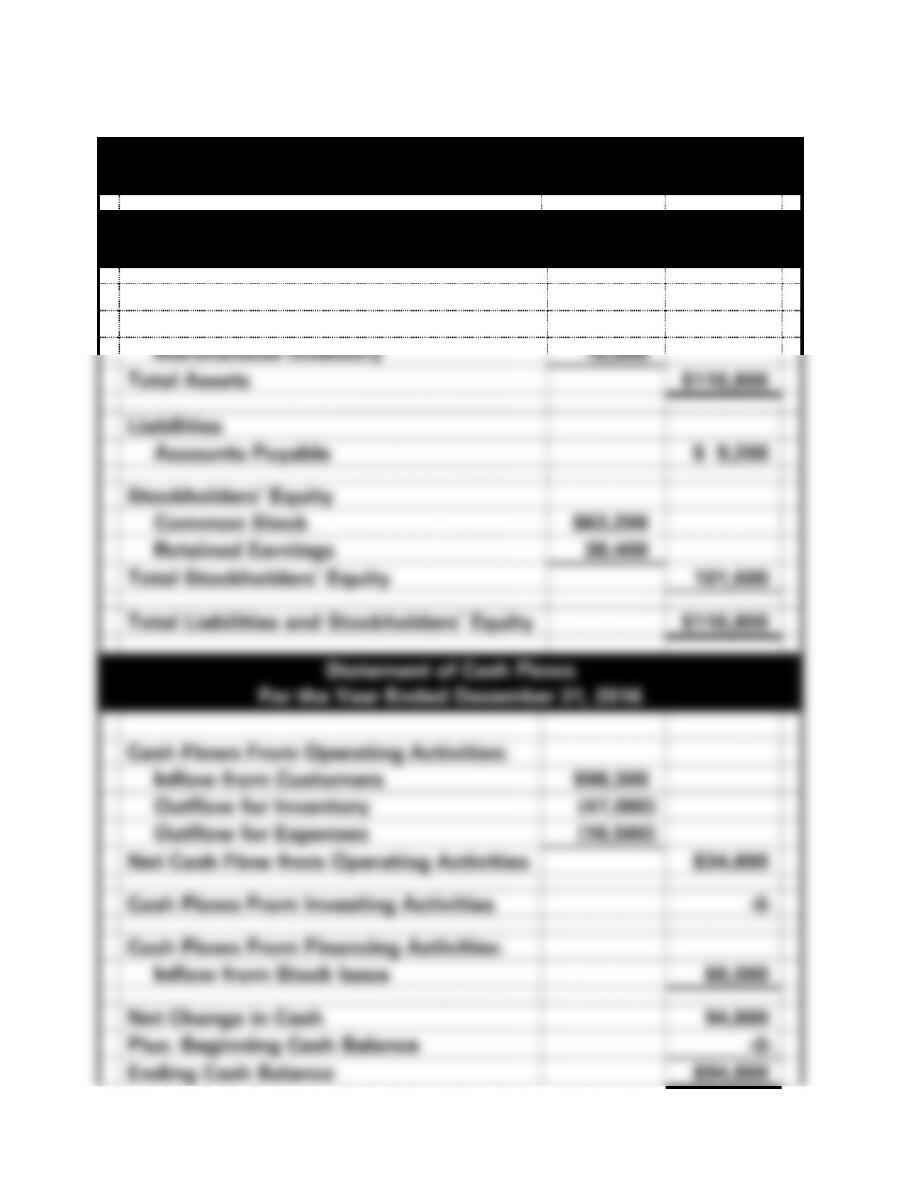
EXERCISE 4-22B c. (cont.)
Sally’s Gift Shop
Financial Statements
Balance Sheet
As of December 31, 2016
Assets
Cash
$94,800
Merchandise Inventory
16,000
Total Assets
$110,800
Liabilities
Accounts Payable
$ 9,200
Stockholders’ Equity
Common Stock
$63,200
Retained Earnings
38,400
Total Stockholders’ Equity
101,600
Total Liabilities and Stockholders’ Equity
$110,800
Statement of Cash Flows
For the Year Ended December 31, 2016
Cash Flows From Operating Activities:
Inflow from Customers
$98,300
Outflow for Inventory
(47,000)
Outflow for Expenses
(16,500)
Net Cash Flow from Operating Activities
$34,800
Cash Flows From Investing Activities
-0-
Cash Flows From Financing Activities:
Inflow from Stock Issue
60,000
Net Change in Cash
94,800
Plus: Beginning Cash Balance
-0-
Ending Cash Balance
$94,800