9
13-9
Exercise 13-3B
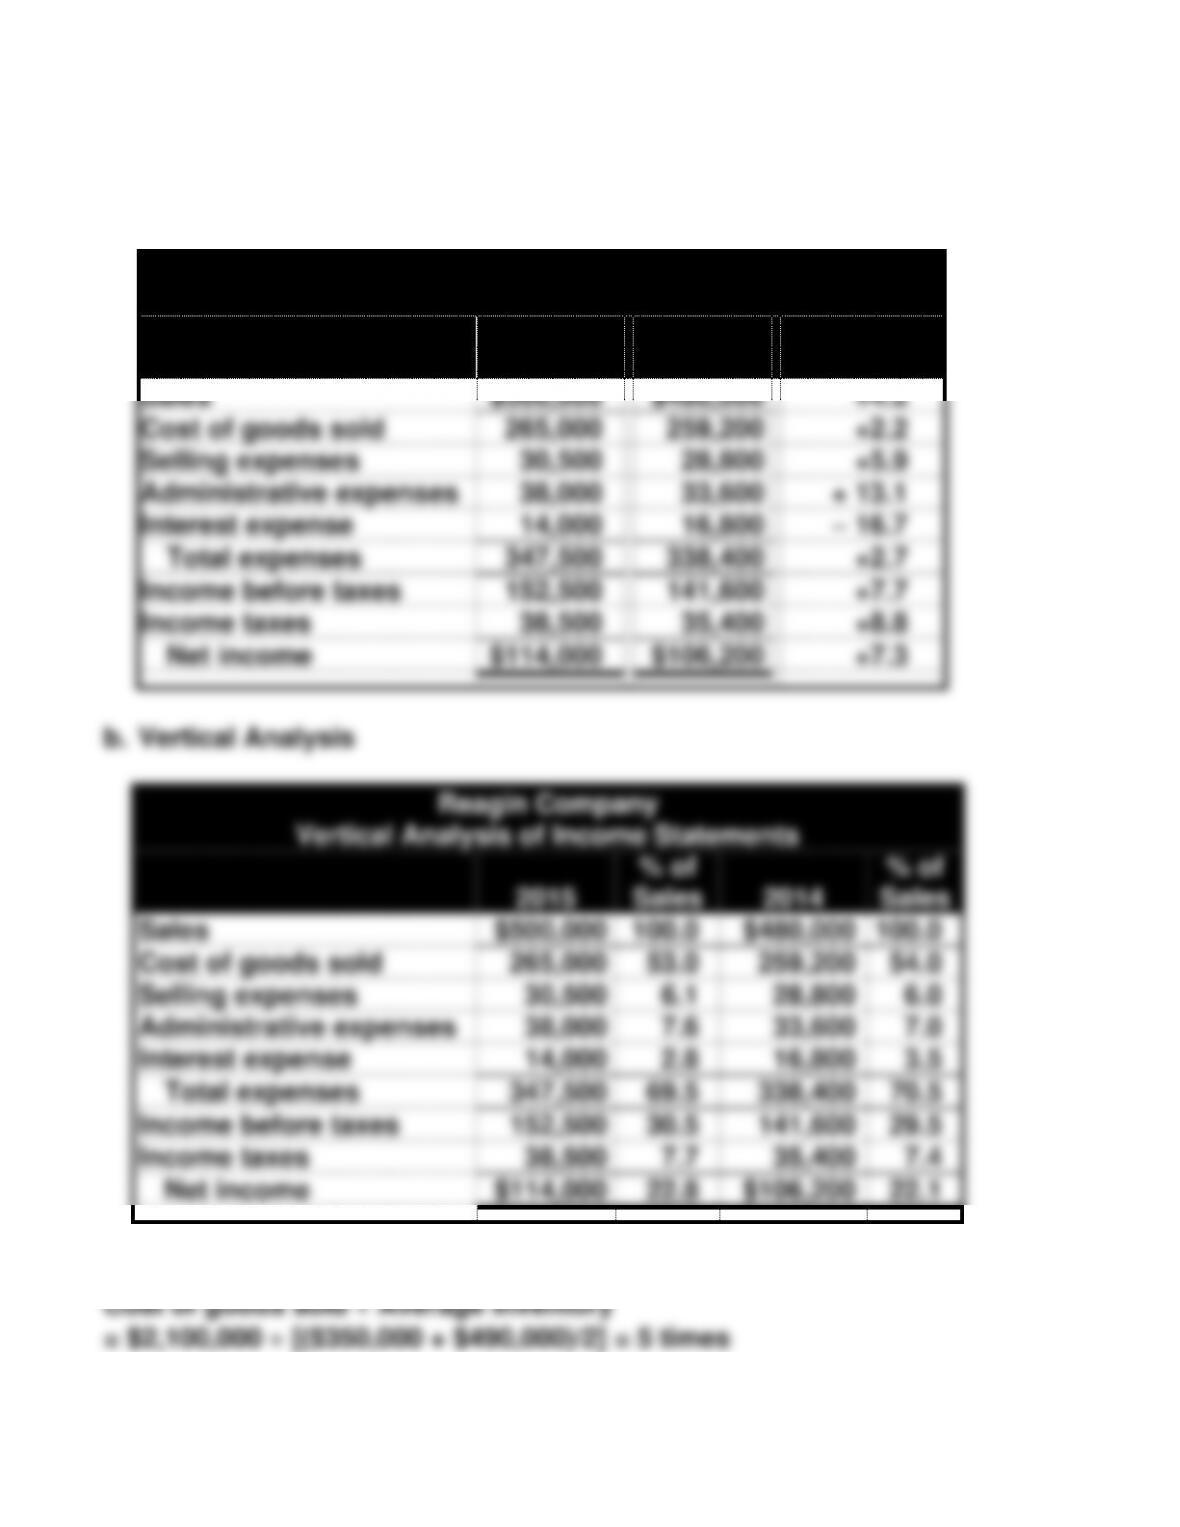
a. Horizontal Analysis
Reagin Company
Horizontal Analysis of Income Statements
2015
2014
% Change
over 2014
Sales
$500,000
$480,000
+4.2
Cost of goods sold
265,000
259,200
+2.2
Selling expenses
30,500
28,800
+5.9
Administrative expenses
38,000
33,600
+ 13.1
Interest expense
14,000
16,800
– 16.7
Total expenses
347,500
338,400
+2.7
Income before taxes
152,500
141,600
+7.7
Income taxes
38,500
35,400
+8.8
Net income
$114,000
$106,200
+7.3
b. Vertical Analysis
Reagin Company
Vertical Analysis of Income Statements
2015
% of
Sales
2014
% of
Sales
Sales
$500,000
100.0
$480,000
100.0
Cost of goods sold
265,000
53.0
259,200
54.0
Selling expenses
30,500
6.1
28,800
6.0
Administrative expenses
38,000
7.6
33,600
7.0
Interest expense
14,000
2.8
16,800
3.5
Total expenses
347,500
69.5
338,400
70.5
Income before taxes
152,500
30.5
141,600
29.5
Income taxes
38,500
7.7
35,400
7.4
Net income
$114,000
22.8
$106,200
22.1
Exercise 13-4B
13–10
Exercise 13-5B
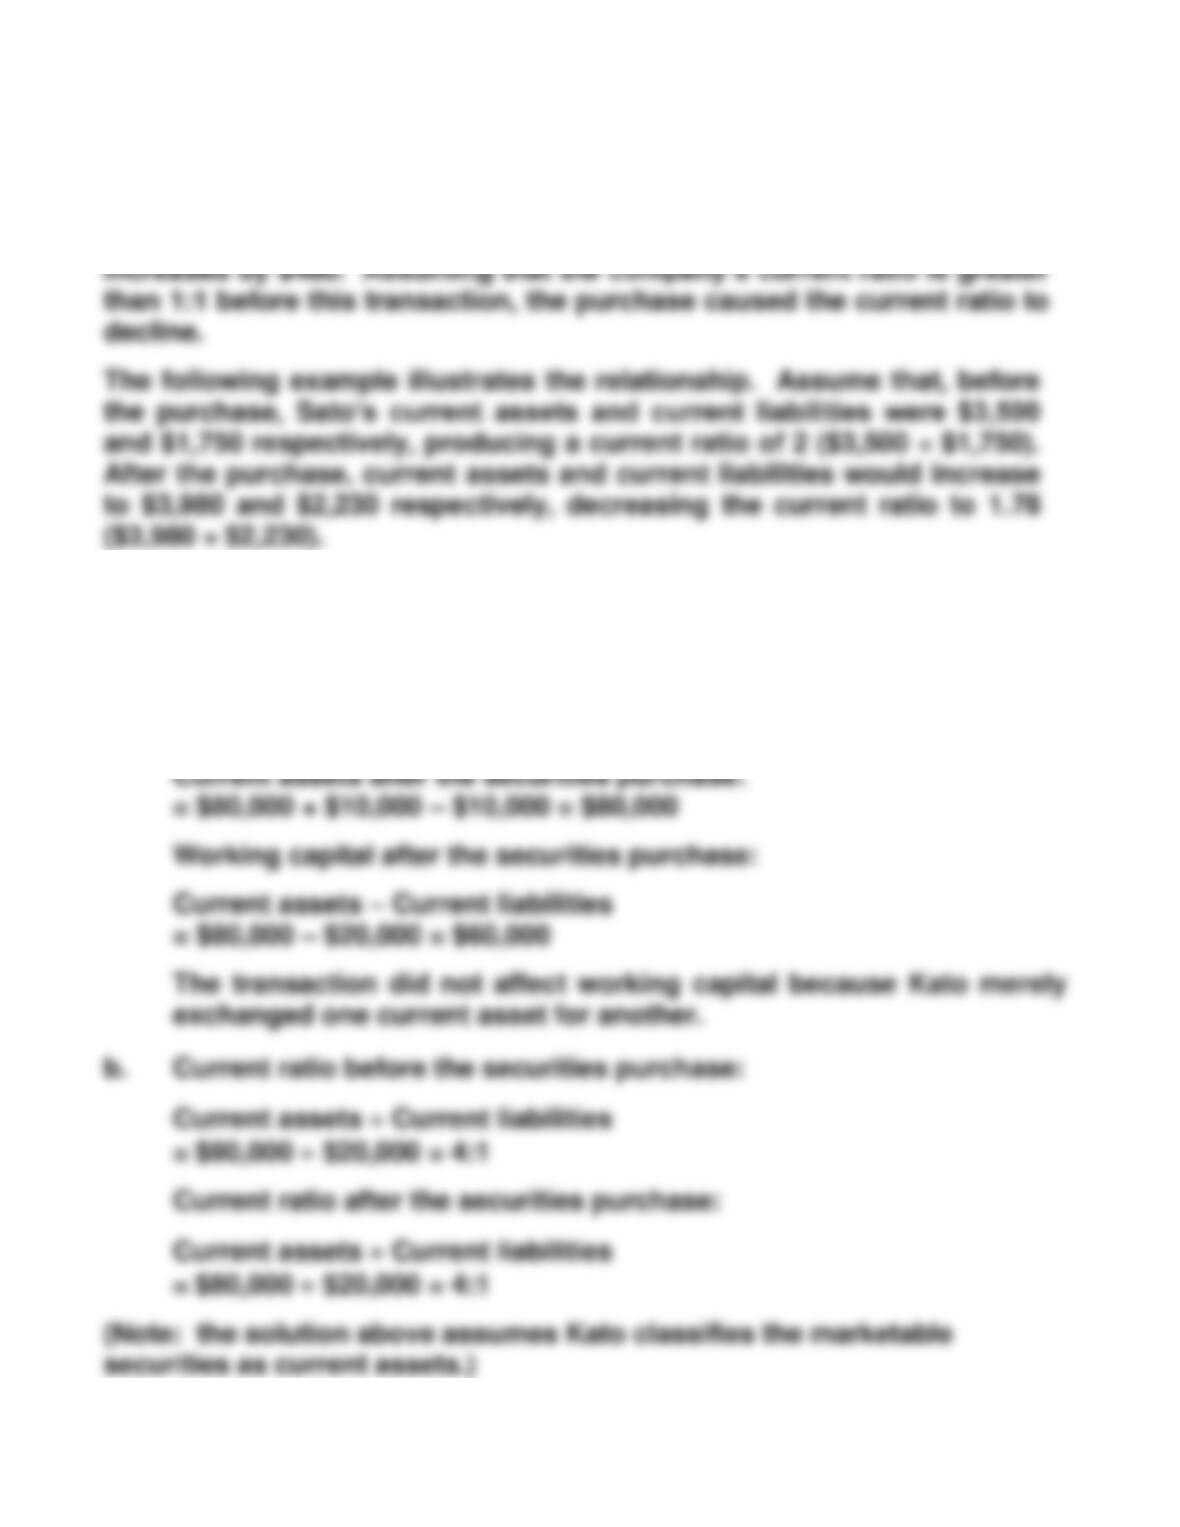
If Sato Corporation purchased $480 of merchandise on account, both the
current asset inventory and the current liability accounts payable
Exercise 13–6B
a. Working capital before the securities purchase:
Current assets – Current liabilities
= $80,000 – $20,000 = $60,000
13–11
Exercise 13-7B
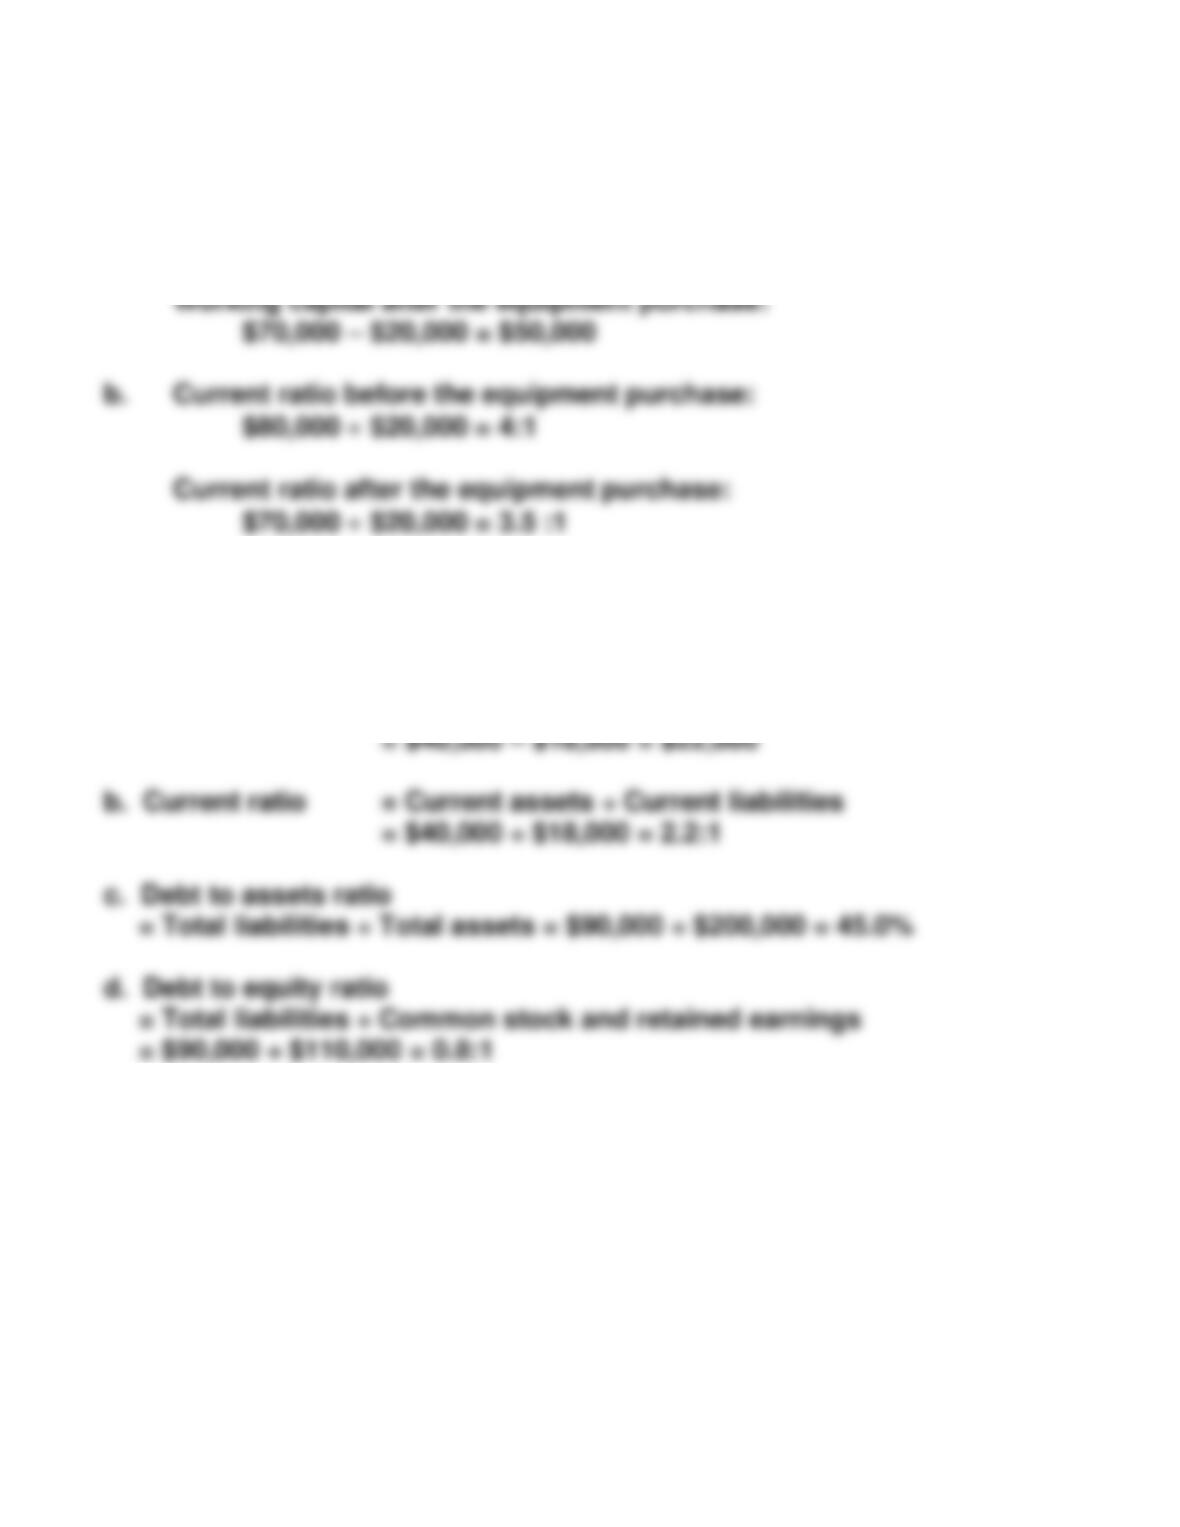
a. Working capital before the equipment purchase:
$80,000 – $20,000 = $60,000
Exercise 13-8B
All results are rounded to the nearest tenth.
a. Working capital = Current assets – Current liabilities
13–12
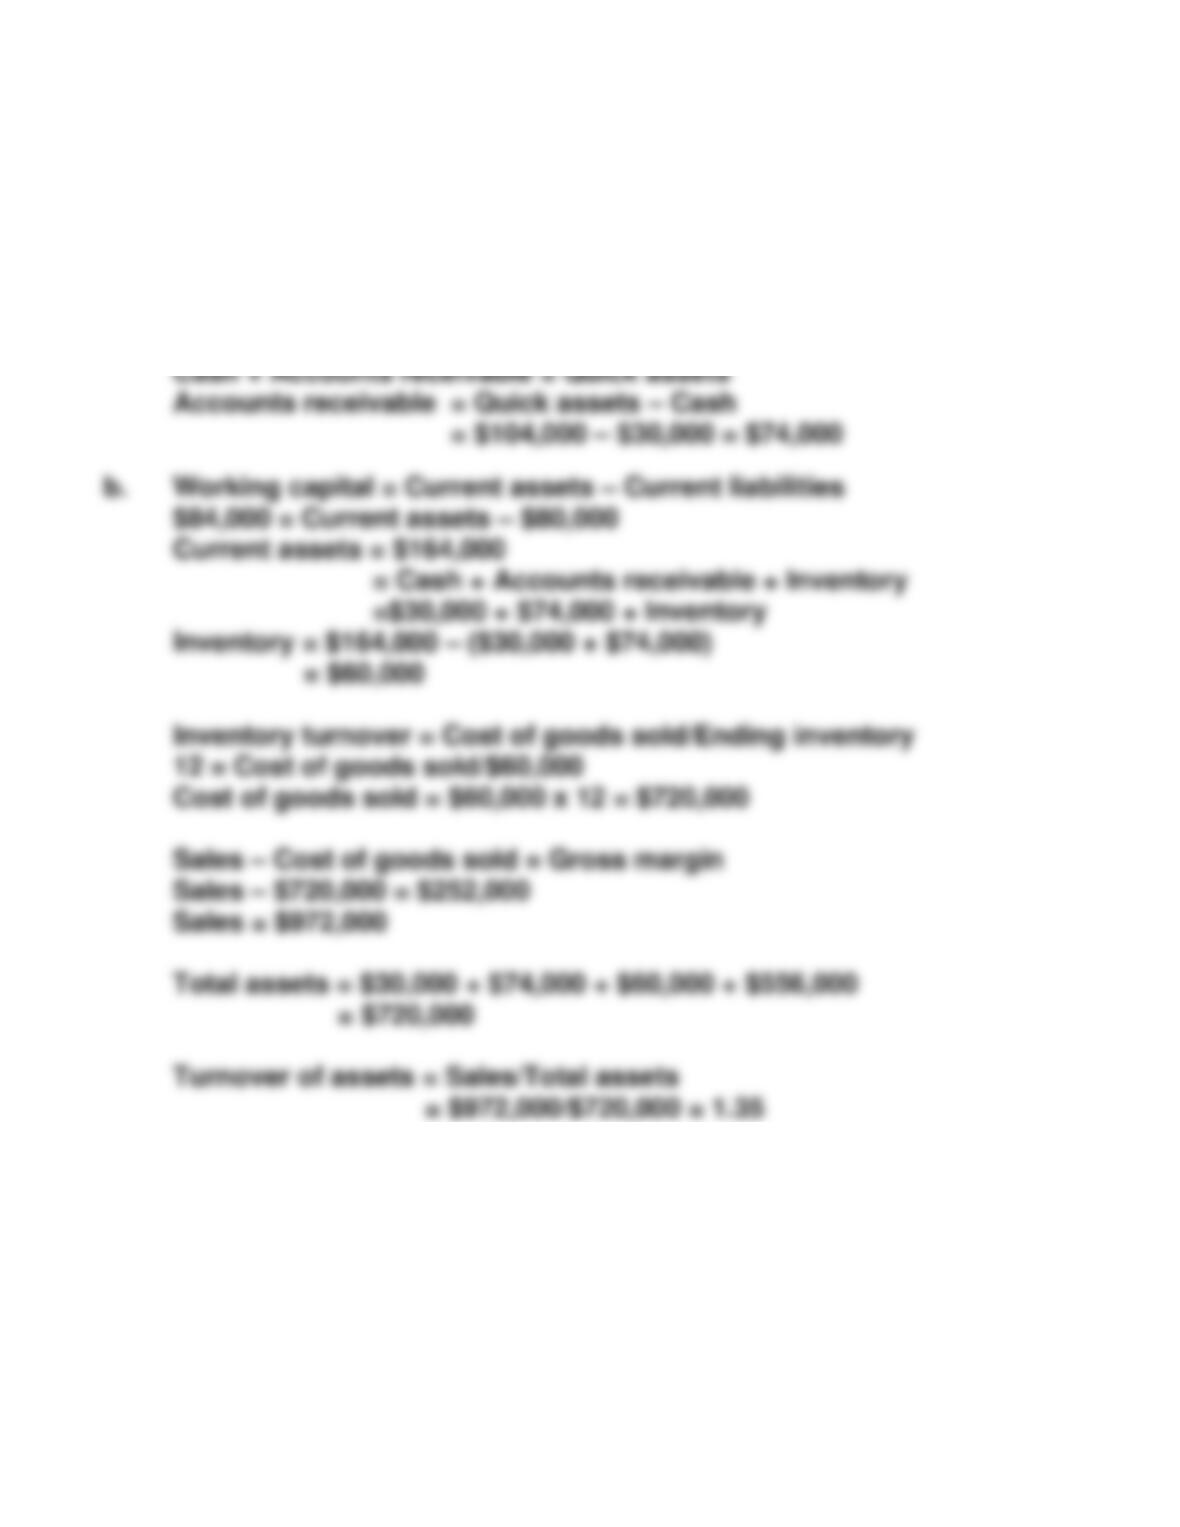
Exercise 13-9B
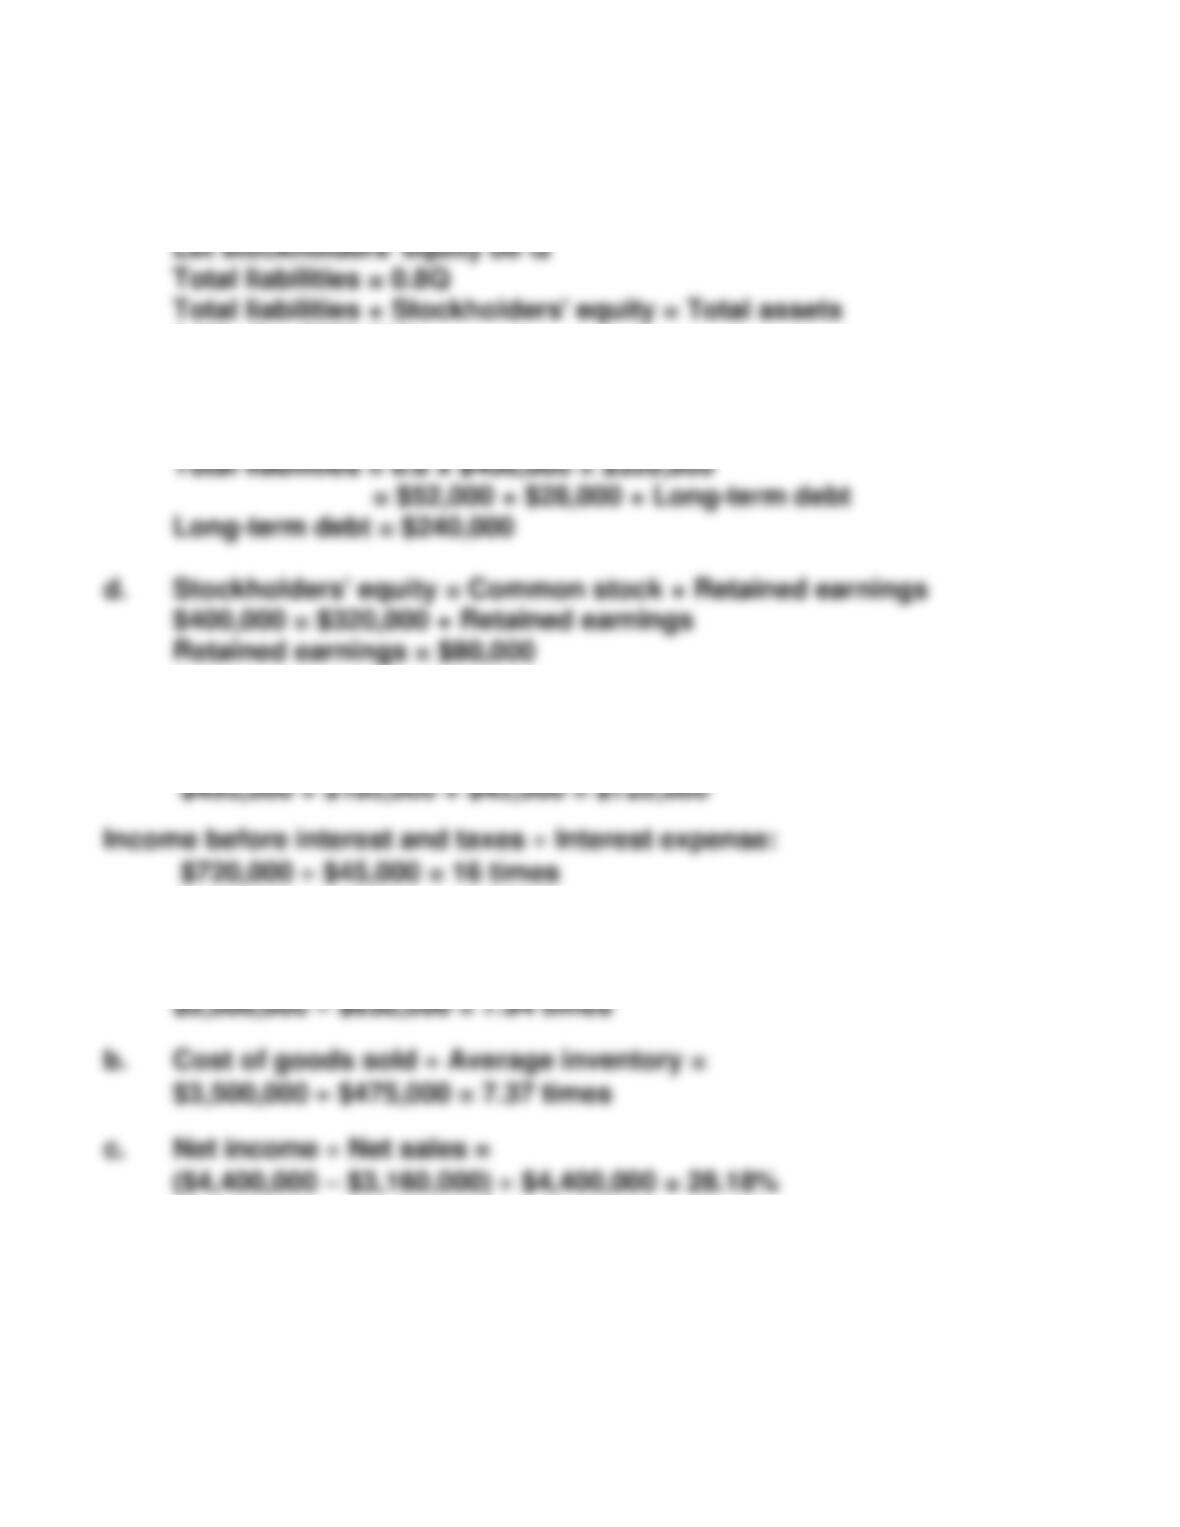
a. Current liabilities = $52,000 + $28,000 = $80,000
Quick ratio = Quick assets/Current liabilities
Quick assets = Quick ratio x Current liabilities
Quick assets = 1.3 x $80,000 = $104,000
13–13
Exercise 13-9B (continued)
c. Total liabilities to stockholders’ equity = 0.8
0.8Q+Q = $720,000
1.8Q = $720,000
Q = $400,000
Exercise 13-10B
Income before interest and taxes:
Exercise 13-11B
a. Net credit sales Average accounts receivables =
13–14
Exercise 13-12B
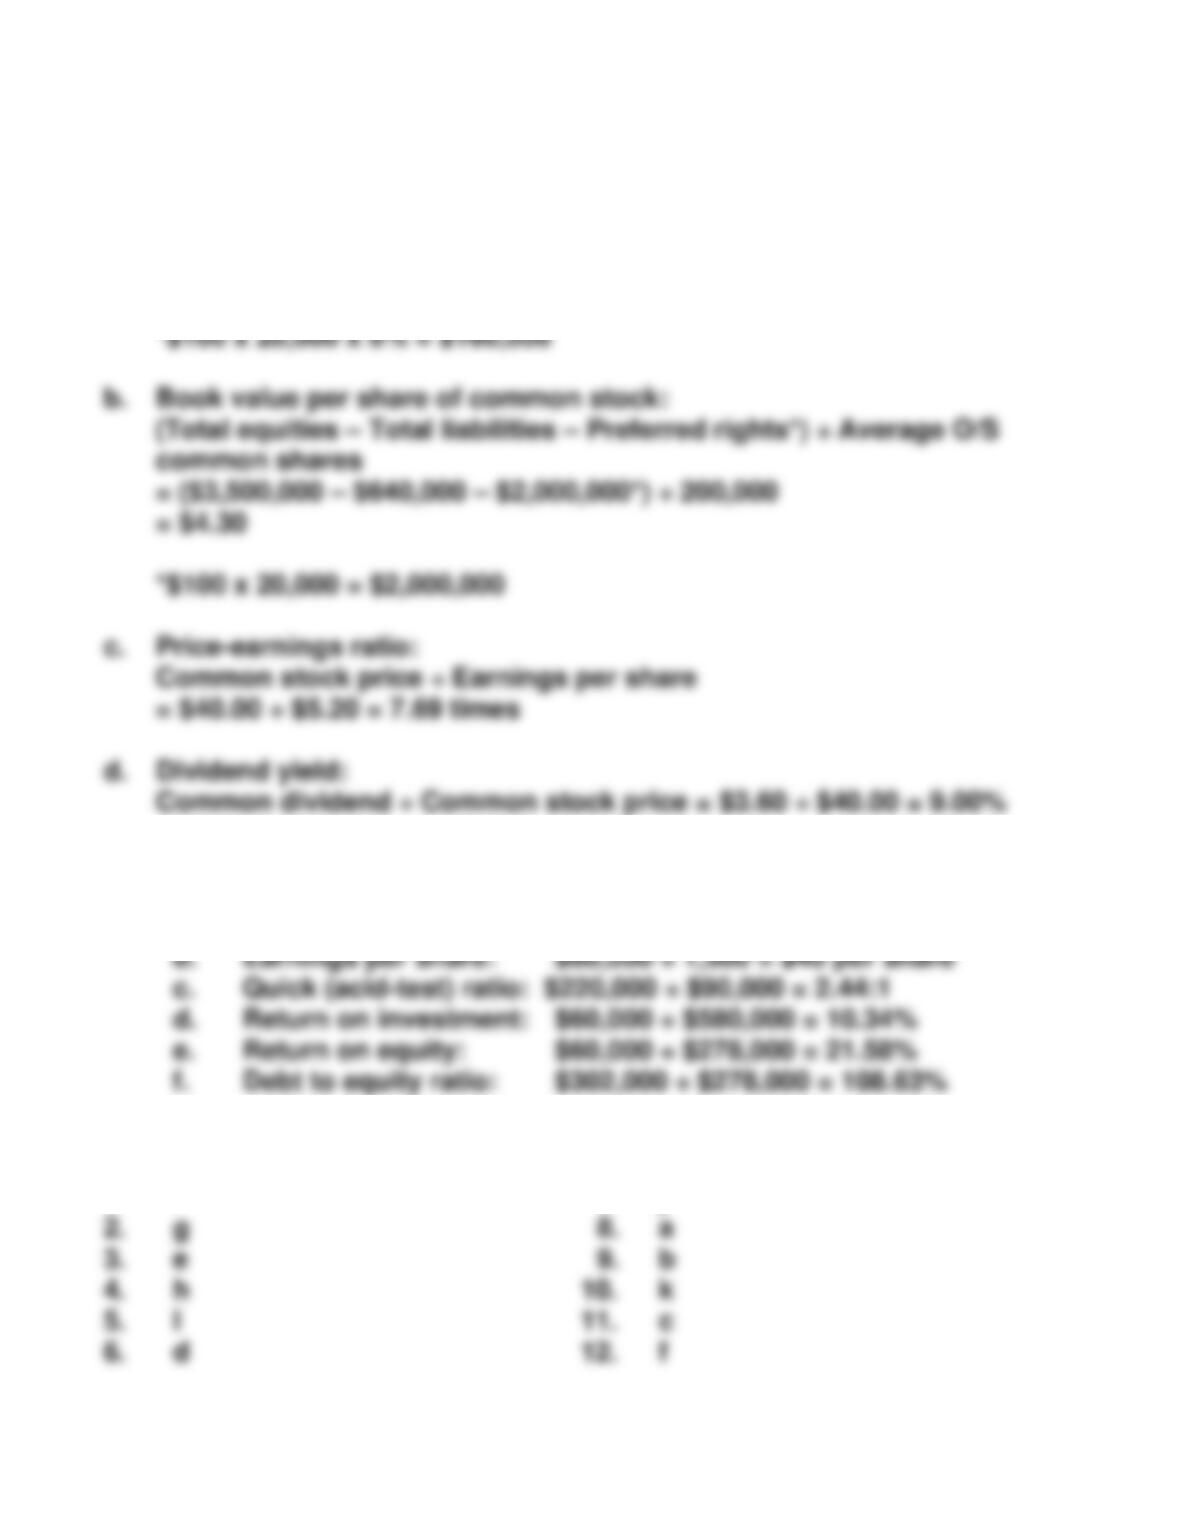
a. Earnings per share:
(Net income – Preferred dividends) ÷ Average O/S common shares
= ($1,200,000 – $160,000*) ÷ 200,000 = $5.20
Exercise 13-13B
a. Current ratio: $380,000 ÷ $90,000 = 4.22:1
Exercise 13-14B
1. i 7. j
13–15
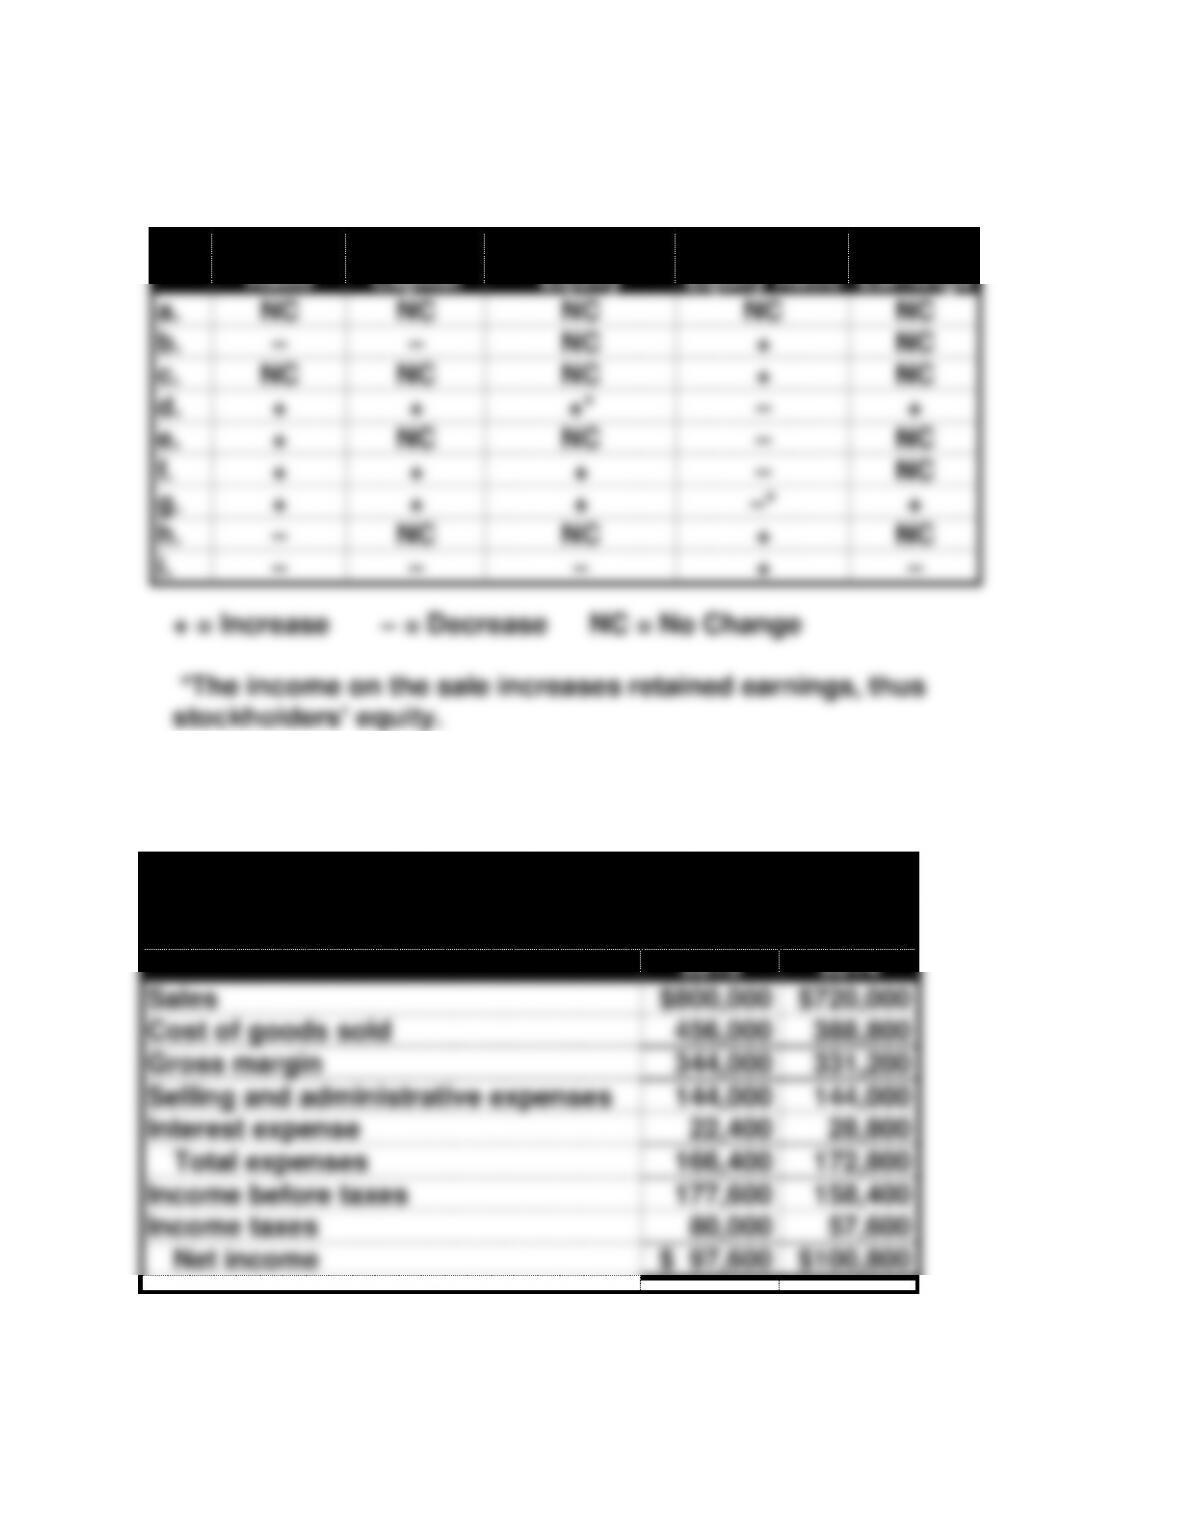
Exercise 13-15B
Quick
Ratio
Working
Capital
Stockholders’
Equity
Debt to
Equity Ratio
Retained
Earnings
a.
NC
NC
NC
NC
NC
b.
–
–
NC
+
NC
c.
NC
NC
NC
+
NC
d.
+
+
+*
–
+
e.
+
NC
NC
–
NC
f.
+
+
+
–
NC
g.
+
+
+
–*
+
h.
–
NC
NC
+
NC
i.
–
–
–
+
–
+ = Increase – = Decrease NC = No Change
*The income on the sale increases retained earnings, thus
stockholders’ equity.
Problem 13-16B
Spier Corporation
Income Statements
For the Years Ended December 31,
2015
2014
Sales
$800,000
$720,000
Cost of goods sold
456,000
388,800
Gross margin
344,000
331,200
Selling and administrative expenses
144,000
144,000
Interest expense
22,400
28,800
Total expenses
166,400
172,800
Income before taxes
177,600
158,400
Income taxes
80,000
57,600
Net income
$ 97,600
$100,800
13–16
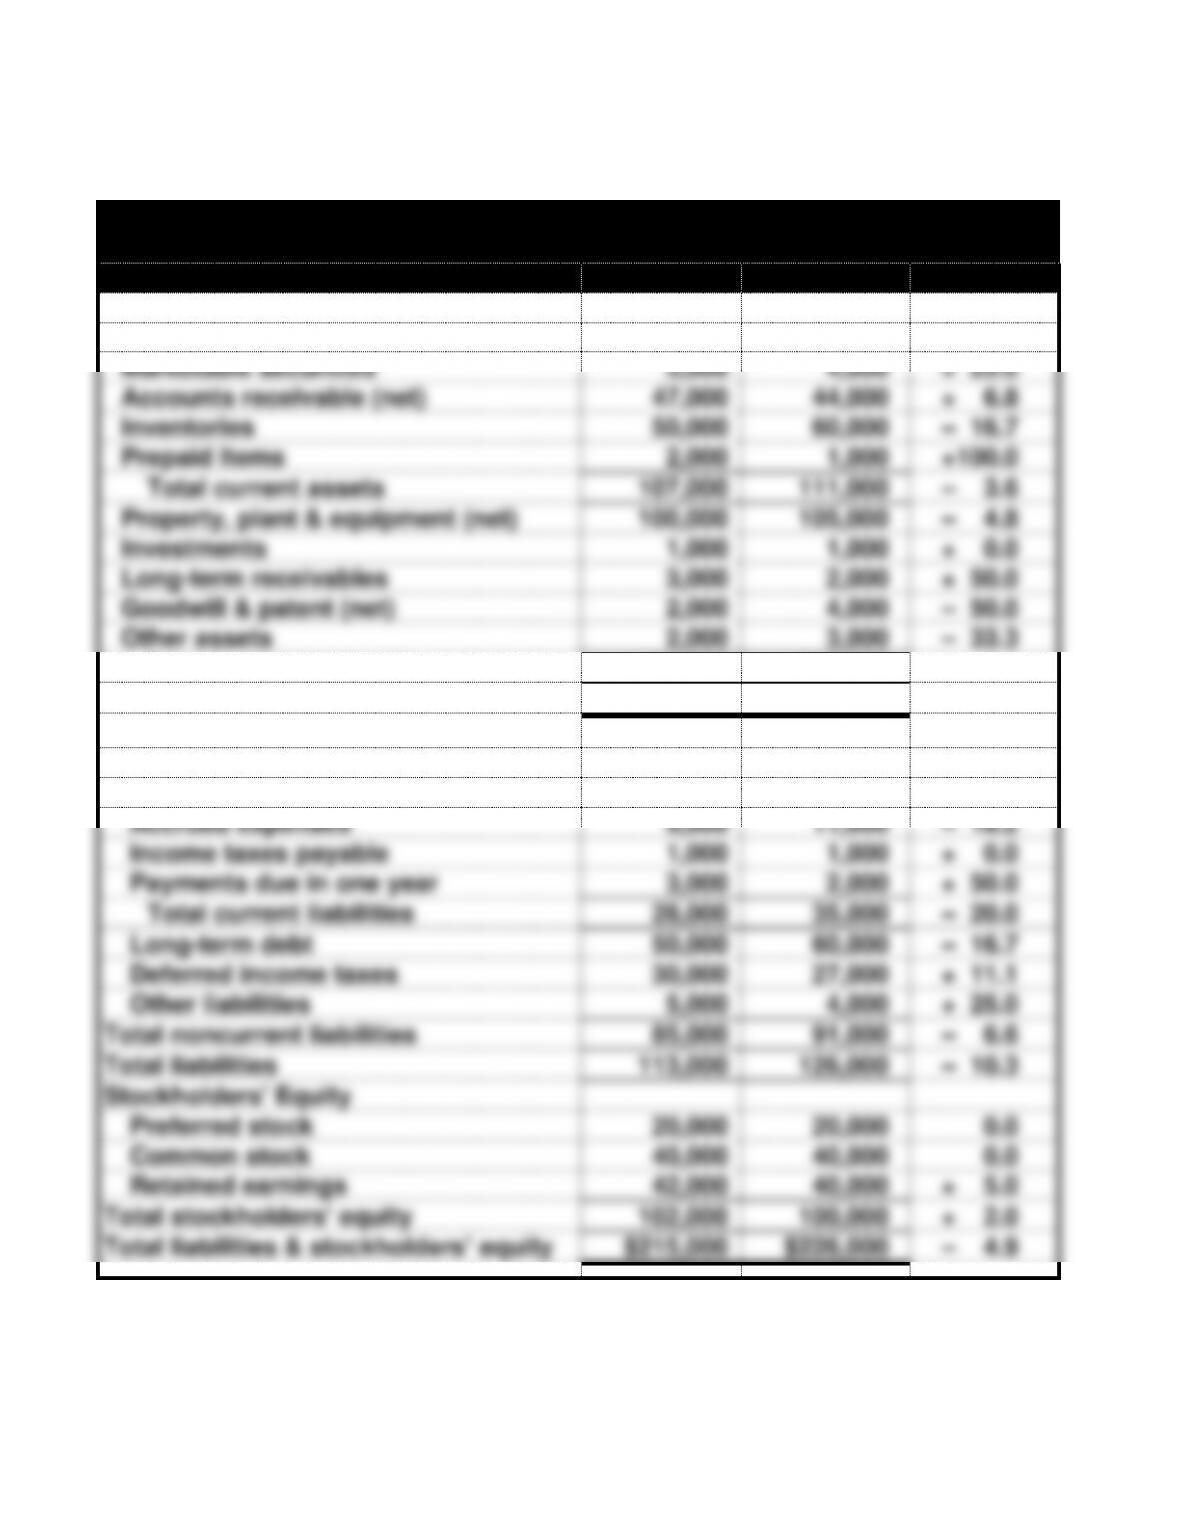
Problem 13-17B
Coleman Company
Horizontal Analysis of Balance Sheets
2015
2014
% Change
Assets
Cash
$ 3,000
$ 2,000
+ 50.0%
Marketable securities
5,000
4,000
+ 25.0
Accounts receivable (net)
47,000
44,000
+ 6.8
Inventories
50,000
60,000
– 16.7
Prepaid Items
2,000
1,000
+100.0
Total current assets
107,000
111,000
– 3.6
Property, plant & equipment (net)
100,000
105,000
– 4.8
Investments
1,000
1,000
+ 0.0
Long–term receivables
3,000
2,000
+ 50.0
Goodwill & patent (net)
2,000
4,000
– 50.0
Other assets
2,000
3,000
– 33.3
Total long-term assets
108,000
115,000
– 6.1
Total assets
$215,000
$226,000
– 4.9
Liabilities
Notes payable
$ 3,000
$ 5,000
– 40.0
Accounts payable
12,000
16,000
– 25.0
Accrued expenses
9,000
11,000
– 18.2
Income taxes payable
1,000
1,000
+ 0.0
Payments due in one year
3,000
2,000
+ 50.0
Total current liabilities
28,000
35,000
– 20.0
Long-term debt
50,000
60,000
– 16.7
Deferred income taxes
30,000
27,000
+ 11.1
Other liabilities
5,000
4,000
+ 25.0
Total noncurrent liabilities
85,000
91,000
– 6.6
Total liabilities
113,000
126,000
– 10.3
Stockholders’ Equity
Preferred stock
20,000
20,000
0.0
Common stock
40,000
40,000
0.0
Retained earnings
42,000
40,000
+ 5.0
Total stockholders’ equity
102,000
100,000
+ 2.0
Total liabilities & stockholders’ equity
$215,000
$226,000
– 4.9
13–17
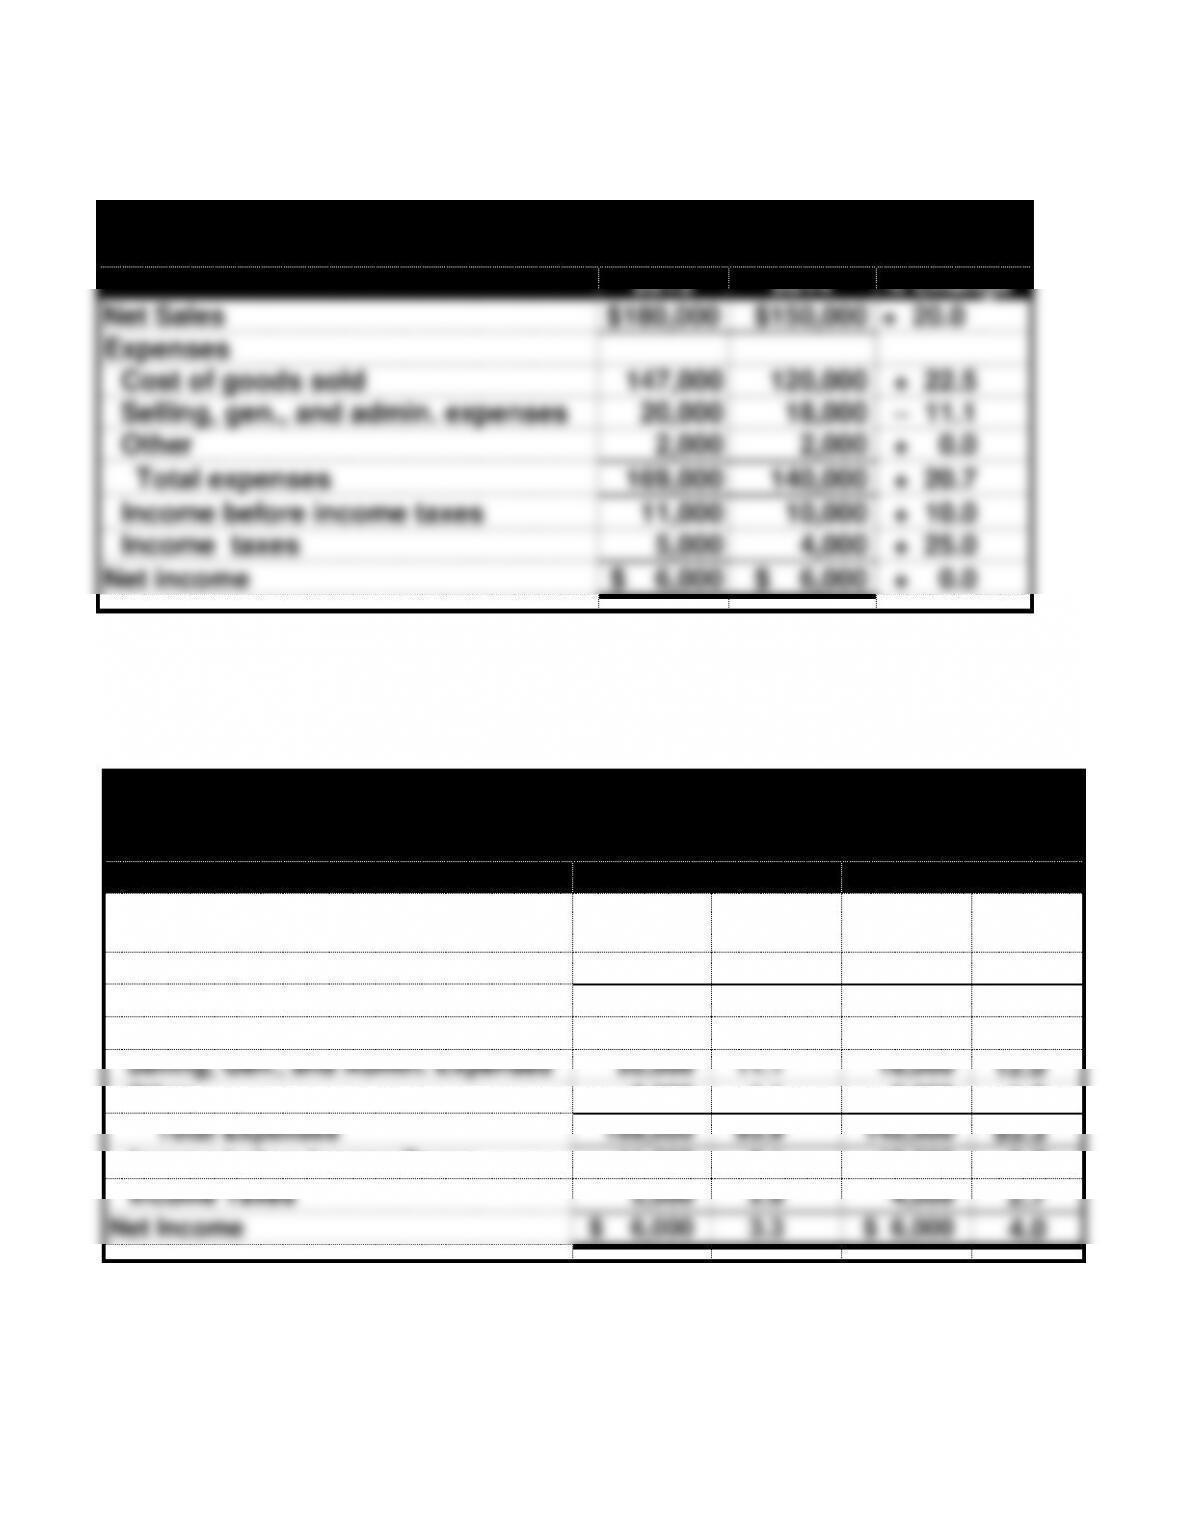
Problem 13-17B (continued)
Coleman Company
Horizontal Analysis of Income Statements
2015
2014
% Change
Net Sales
$180,000
$150,000
+ 20.0
Expenses
Cost of goods sold
147,000
120,000
+ 22.5
Selling, gen., and admin. expenses
20,000
18,000
– 11.1
Other
2,000
2,000
+ 0.0
Total expenses
169,000
140,000
+ 20.7
Income before income taxes
11,000
10,000
+ 10.0
Income taxes
5,000
4,000
+ 25.0
Net income
$ 6,000
$ 6,000
+ 0.0
Problem 13-18B
Coleman Company
Vertical Analysis
(In thousands)
2015
2014
Amount
% of
Total
Amount
% of
Total
Net Sales
$180,000
100.0%
$150,000
100.0%
Expenses
Cost of Goods Sold
147,000
81.7
120,000
80.0
Selling, Gen., and Admin. Expenses
20,000
11.1
18,000
12.0
Other
2,000
1.1
2,000
1.3
Total Expenses
169,000
93.9
140,000
93.3
Income before Income Taxes
11,000
6.1
10,000
6.7
Income Taxes
5,000
2.8
4,000
2.7
Net Income
$ 6,000
3.3
$ 6,000
4.0
13–18
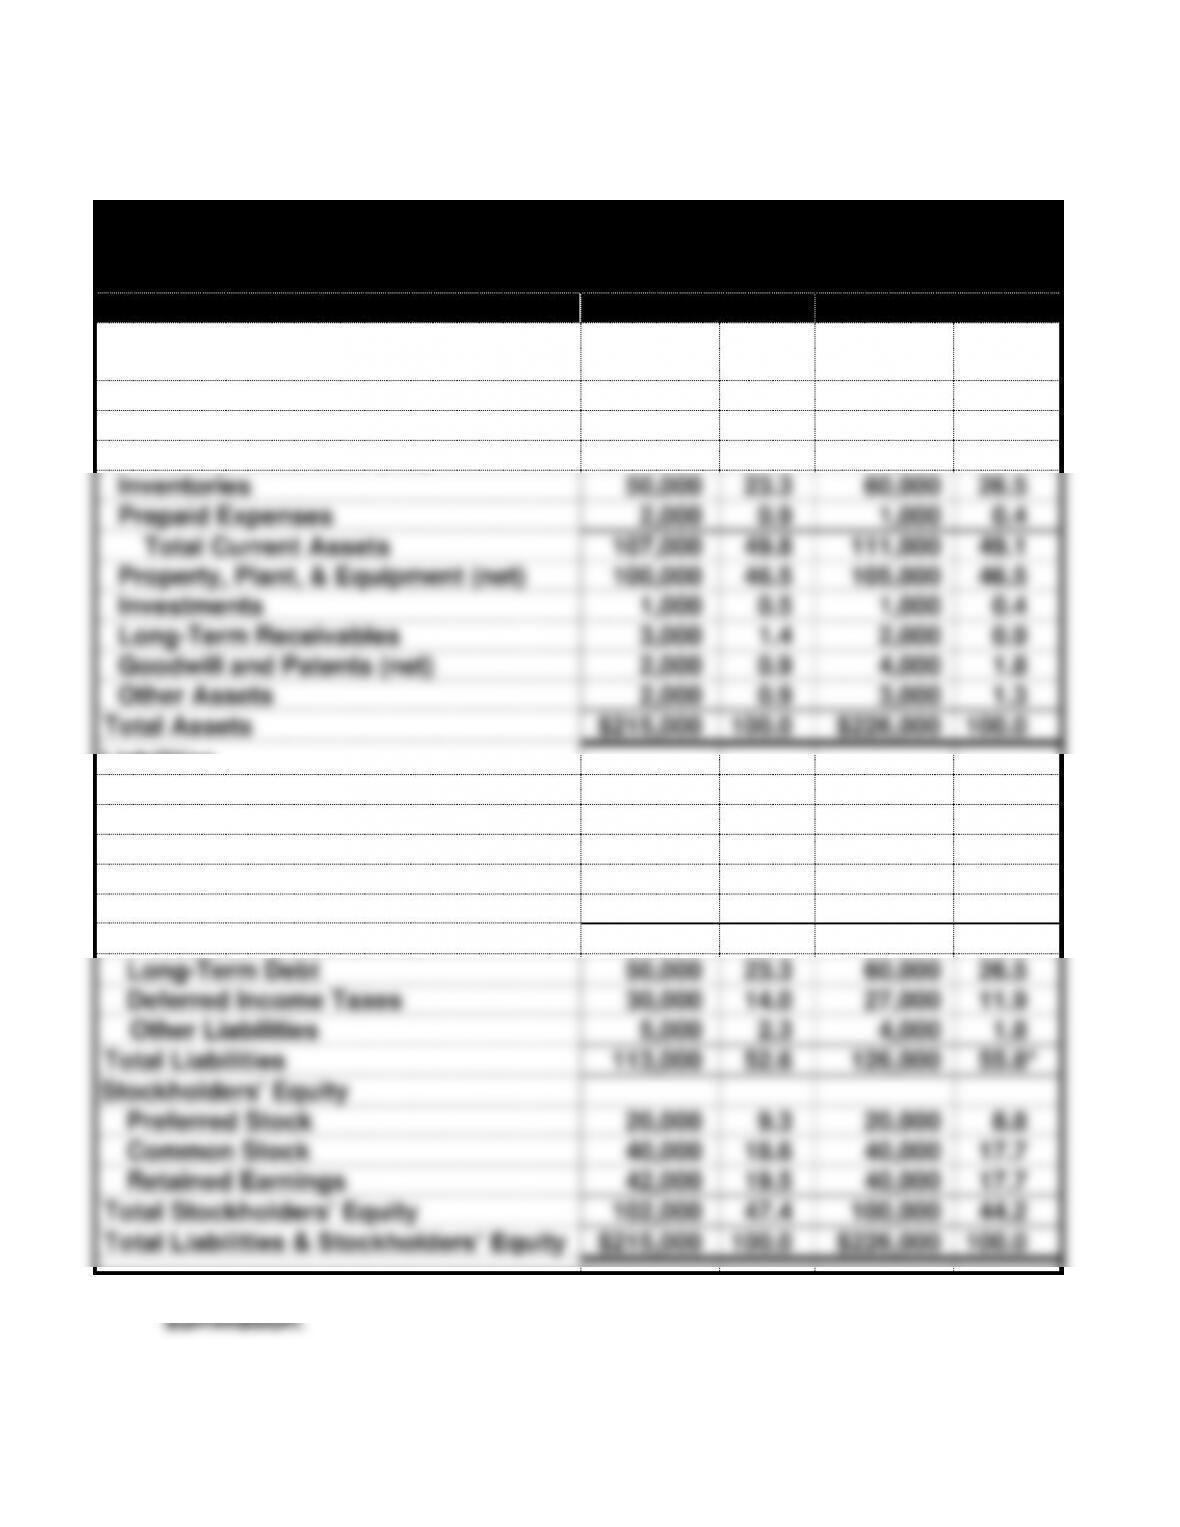
Problem 13-18B (continued)
Coleman Company
Vertical Analysis
(In thousands)
2015
2014
Assets
Amount
% of
Total
Amount
% of
Total
Cash
$ 3,000
1.4%
$ 2,000
0.9%
Marketable Securities
5,000
2.3
4,000
1.8
Accounts Receivable (net)
47,000
21.9
44,000
19.5
Inventories
50,000
23.3
60,000
26.5
Prepaid Expenses
2,000
0.9
1,000
0.4
Total Current Assets
107,000
49.8
111,000
49.1
Property, Plant, & Equipment (net)
100,000
46.5
105,000
46.5
Investments
1,000
0.5
1,000
0.4
Long-Term Receivables
3,000
1.4
2,000
0.9
Goodwill and Patents (net)
2,000
0.9
4,000
1.8
Other Assets
2,000
0.9
3,000
1.3
Total Assets
$215,000
100.0
$226,000
100.0
Liabilities
Notes Payable
$ 3,000
1.4
$ 5,000
2.2
Accounts Payable
12,000
5.6
16,000
7.1
Accrued Expenses
9,000
4.2
11,000
4.9
Income Taxes Payable
1,000
0.5
1,000
0.4
Payments Due within One Year
3,000
1.4
2,000
0.9
Total Current Liabilities
28,000
13.0*
35,000
15.5
Long-Term Debt
50,000
23.3
60,000
26.5
Deferred Income Taxes
30,000
14.0
27,000
11.9
Other Liabilities
5,000
2.3
4,000
1.8
Total Liabilities
113,000
52.6
126,000
55.8*
Stockholders’ Equity
Preferred Stock
20,000
9.3
20,000
8.8
Common Stock
40,000
18.6
40,000
17.7
Retained Earnings
42,000
19.5
40,000
17.7
Total Stockholders’ Equity
102,000
47.4
100,000
44.2
Total Liabilities & Stockholders’ Equity
$215,000
100.0
$226,000
100.0
* Rounding percentages based on dollars causes arithmetic difference in
13–19
Problem 13-19B
Current
Ratio
Working
Capital
a.
+
+
b.
+
NA
c.
+
+
d.
NA
NA
e.
NA
NA
f.
–
NA
g.
NA
NA
h.
–
–
i.
–
–
j.
+
+
k.
–
NA
l.
NA
NA
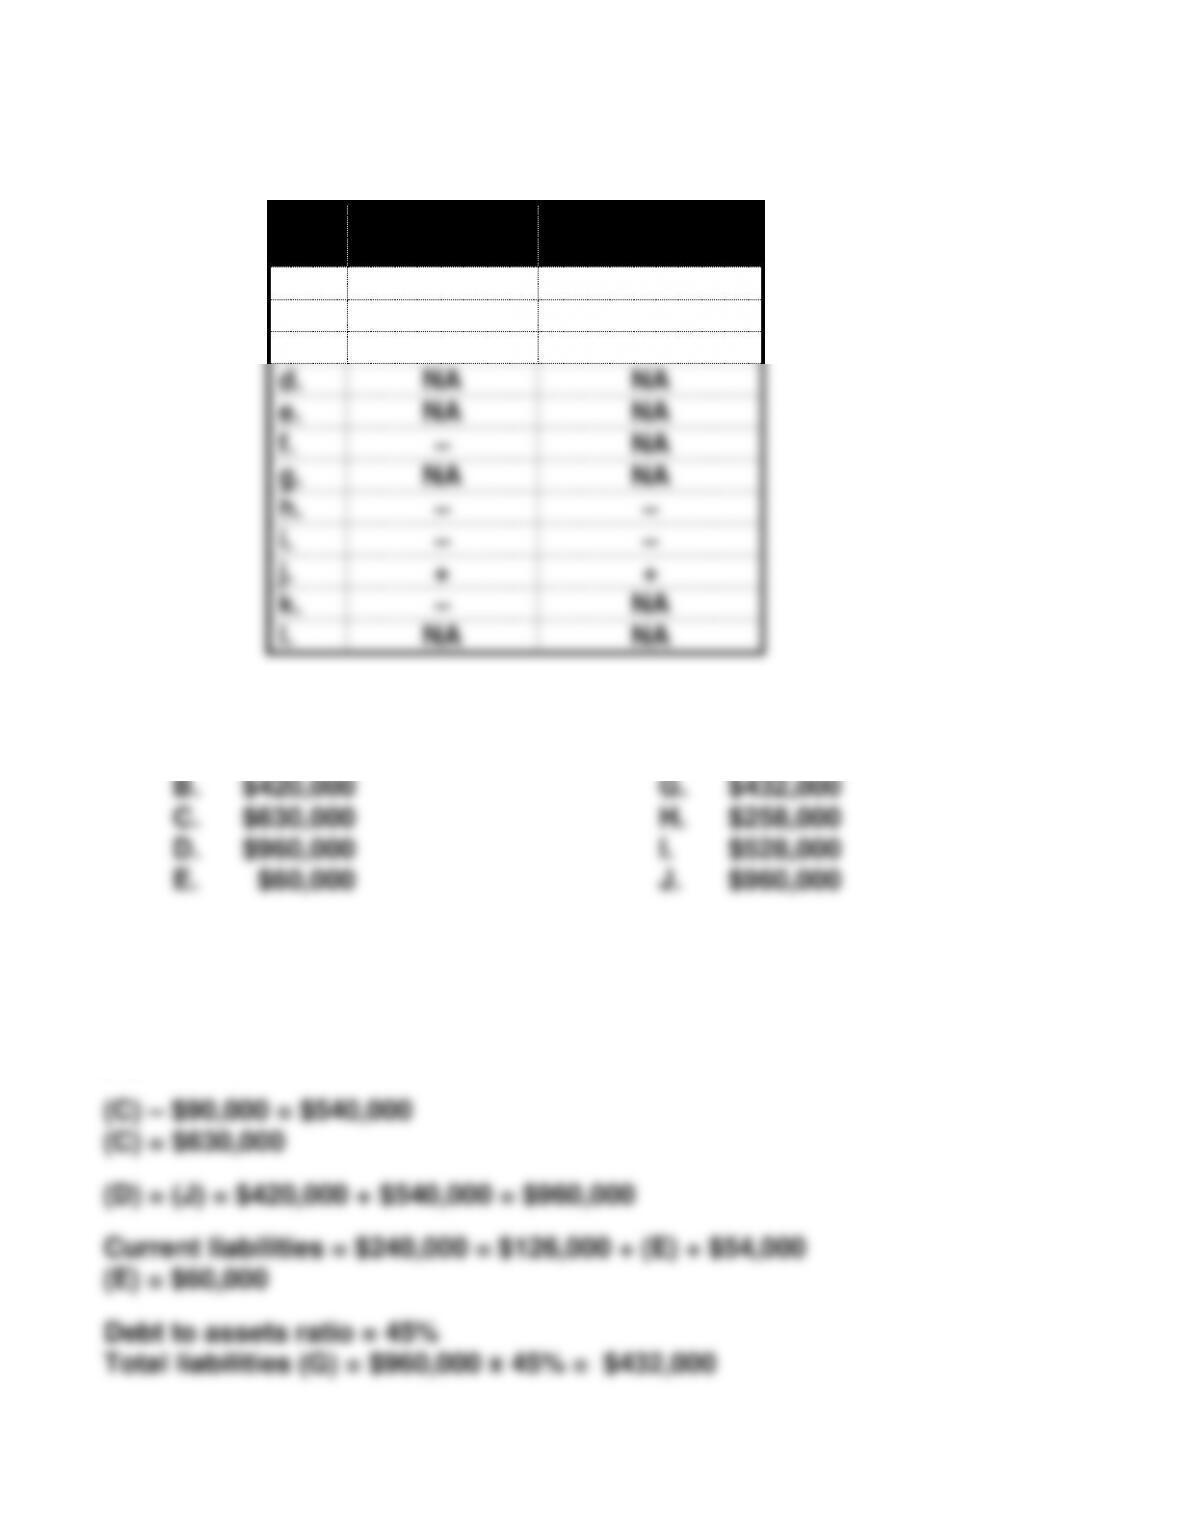
Problem 13-20B
A. $192,000 F. $ 57,000
Current ratio = 1.75 Current liabilities = $240,000
Current assets = 1.75 x $240,000 = $420,000 (B).
$75,000 + (A) + $126,000 + $27,000 = $420,000
(A) = $192,000
13–20
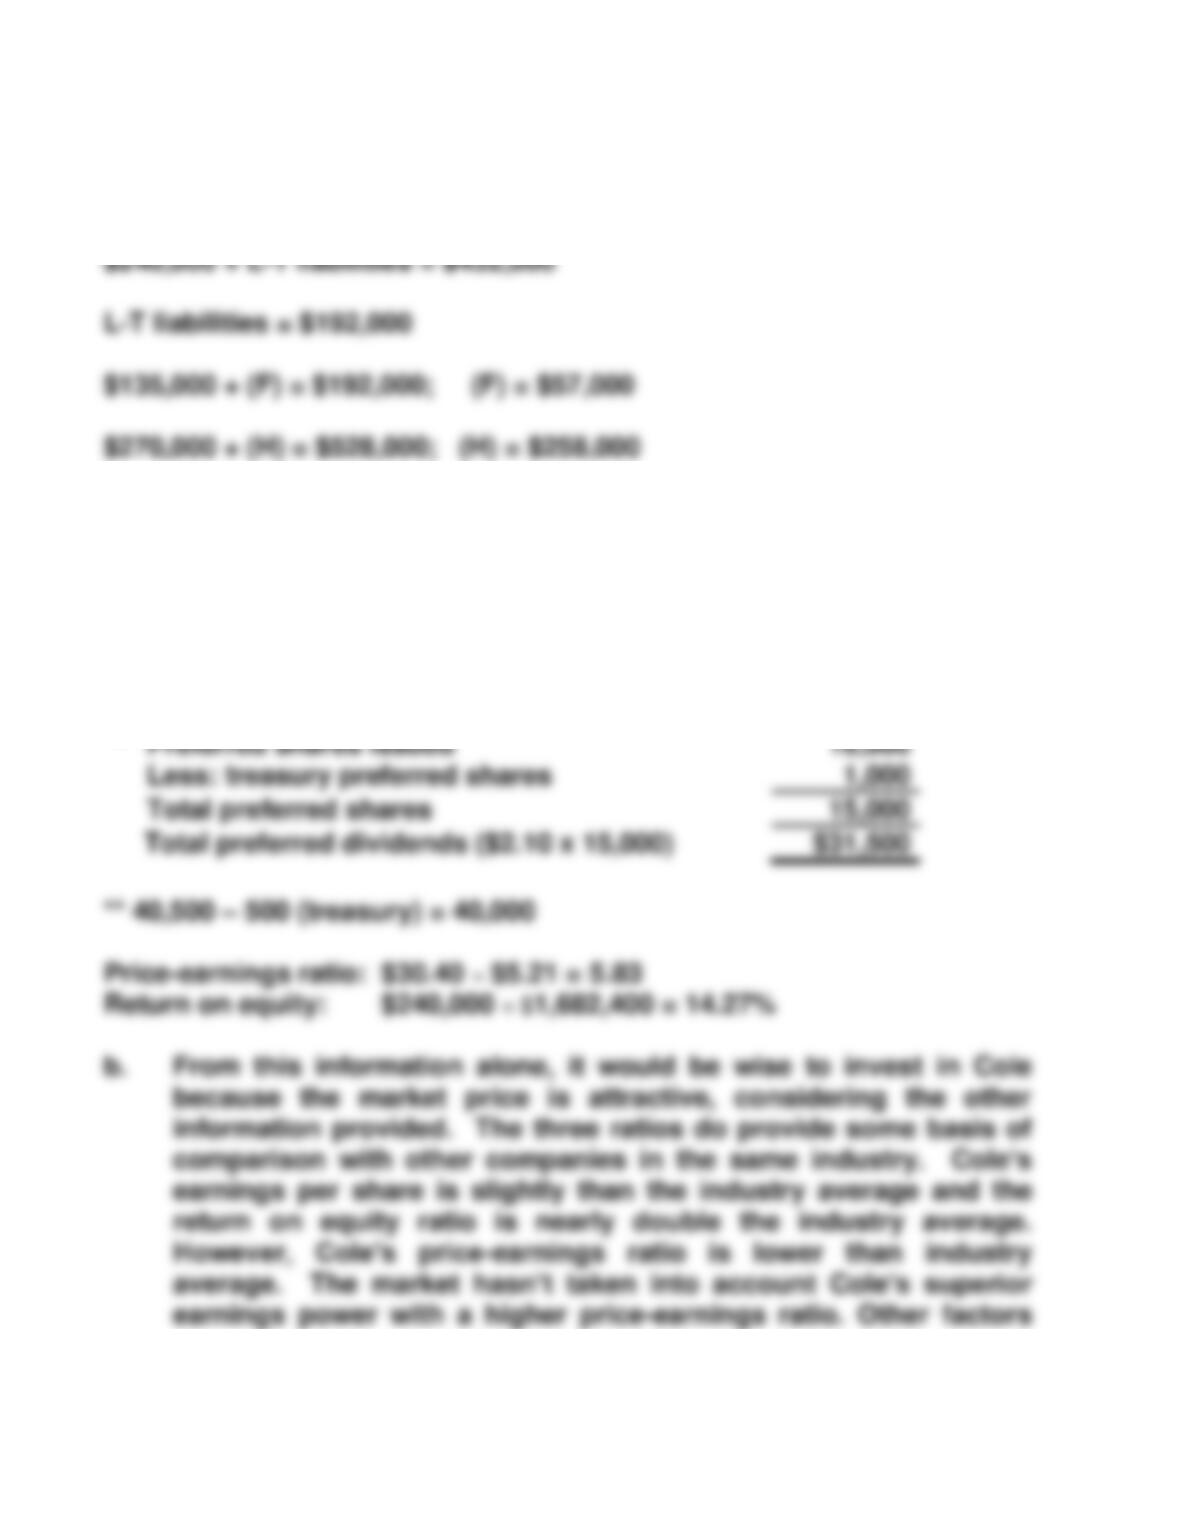
Problem 13-20B (continued)
Stockholders’ equity (I) = $960,000 – $432,000 = $528,000
Problem 13-21B
a. Earnings per share:
$240,000 – $31,500*
—————–—————– = $5.21 per share
40,000**
* Preferred shares issued
16,000
Less: treasury preferred shares
1,000
Total preferred shares
15,000
Total preferred dividends ($2.10 x 15,000)
$31,500
** 40,500 – 500 (treasury) = 40,000
Price-earnings ratio: $30.40 ÷ $5.21 = 5.83
Return on equity: $240,000 ÷ $1,682,400 = 14.27%
b. From this information alone, it would be wise to invest in Cole
because the market price is attractive, considering the other
information provided. The three ratios do provide some basis of
comparison with other companies in the same industry. Cole’s
earnings per share is slightly than the industry average and the
return on equity ratio is nearly double the industry average.
However, Cole’s price-earnings ratio is lower than industry
average. The market hasn’t taken into account Cole’s superior
earnings power with a higher price-earnings ratio. Other factors

13–21
such as non-financial factors, industry prospects and the
13–22
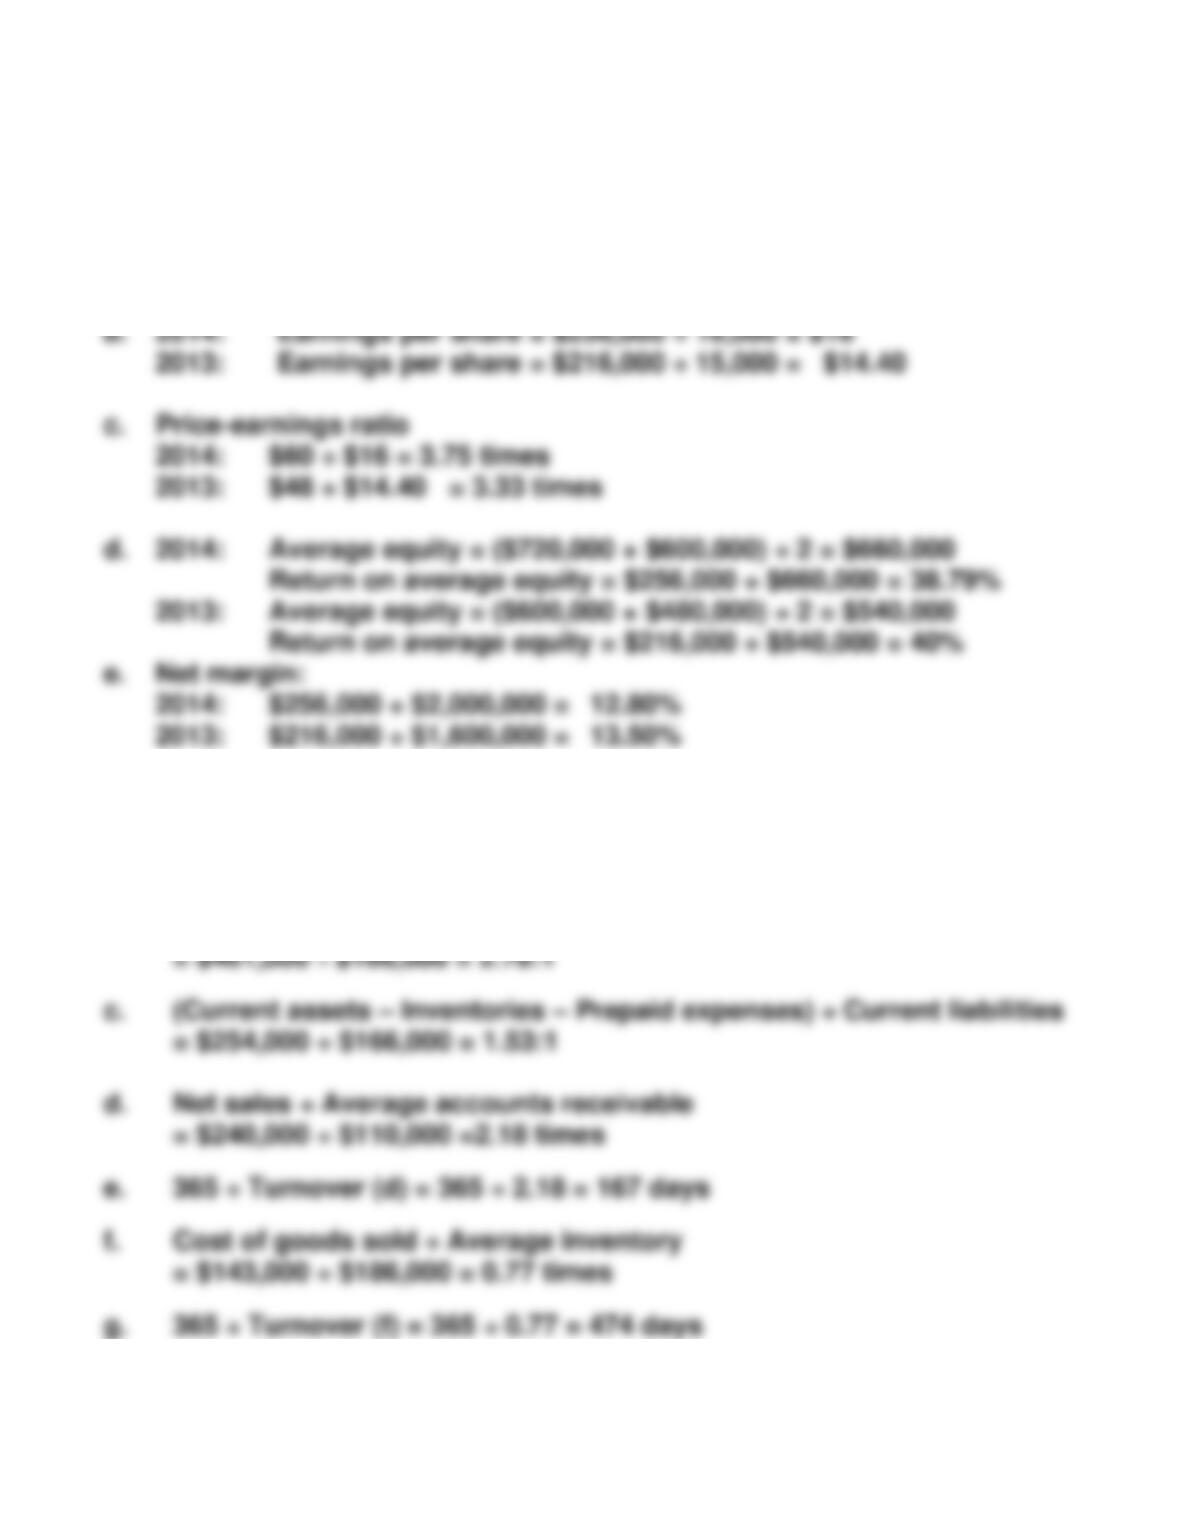
Problem 13-22B
a. Times interest earned
2014: $360,000 ÷ $40,000 = 9 times
2013: $300,000 ÷ $32,000 = 9.38 times
Problem 13-23B
a. Current assets – Current liabilities
= $461,000 – $166,000 = $295,000
b. Current assets ÷ Current liabilities
13–23
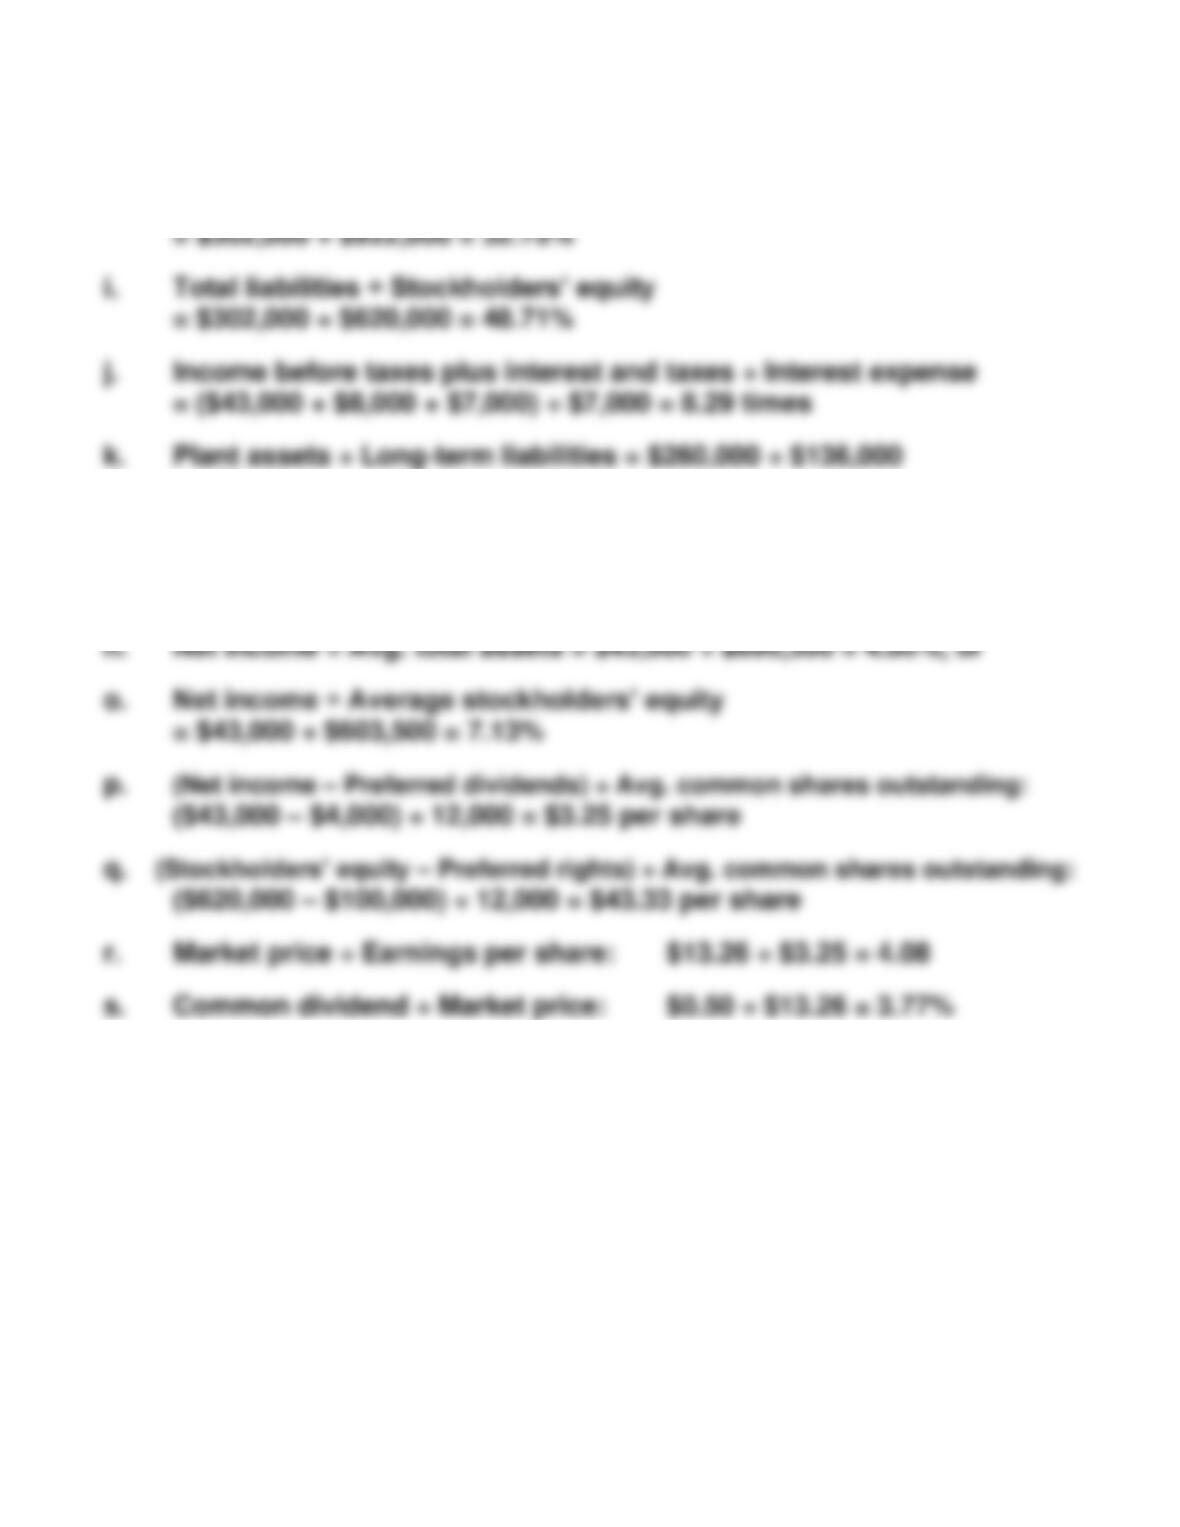
Problem 13-23B (continued)
h. Total liabilities ÷ Total assets
= 1.91 : 1
l. Net income ÷ Net sales = $43,000 ÷ $240,000 = 17.92%
m. Net sales ÷ Avg. total assets = $240,000 ÷ $896,500 = 0.27