Answers to Questions
1. Ratios and trends are useful tools for analyzing financial
statements because they give the analyst a basis for comparing
2. “Liquidity” is the short-term ability to convert assets to cash or
3. Horizontal analysis is a tool for comparing the behavior of items
4. This ratio provides information about how rapidly a company is
selling its inventory.
5. The current ratio presents the number of dollars of current assets
to each dollar of current liabilities. The quick ratio, by omitting the
6. Absolute amounts are often insufficient because companies are of
different sizes, thus have different levels of materiality. One
7. ROI is a measure of income as a percentage of the total capital
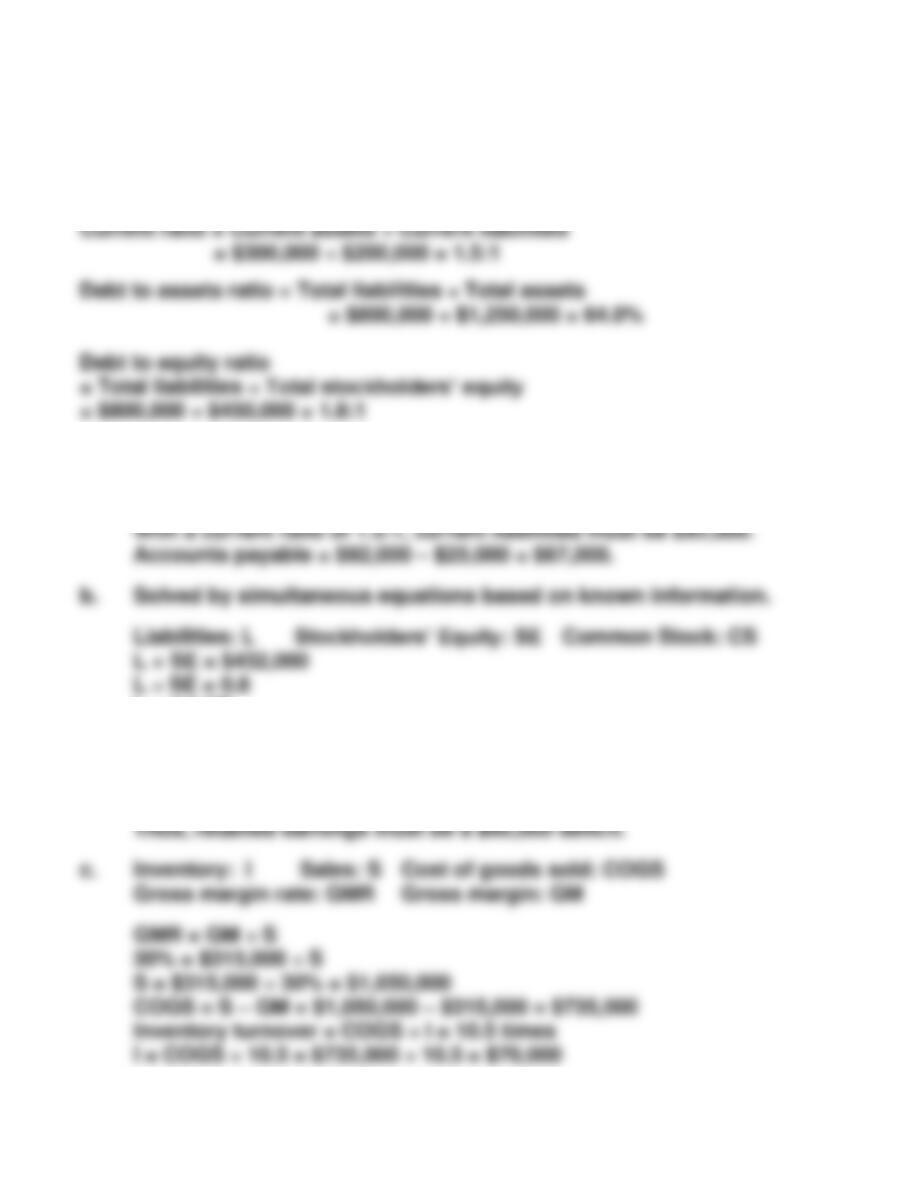
8. a) Debt to equity ratio: Total Liabilities
———————————————
9. Because earnings per share is a combination of “net income” and
“average shares outstanding,” problems in either part affect the
figures.
10. ROI: Net Income
———————
Total Assets
11. Information overload refers to a situation where users of
12. Price-earnings ratio = Market Price per Share
––––––––––––––––––––––––
Earnings per Share
13. Some environmental factors that should be considered are (1) the
14. Accounting principles are the major determinants of the methods
used to account for assets, liabilities, expenses, and revenues. In
Exercise 13-1A
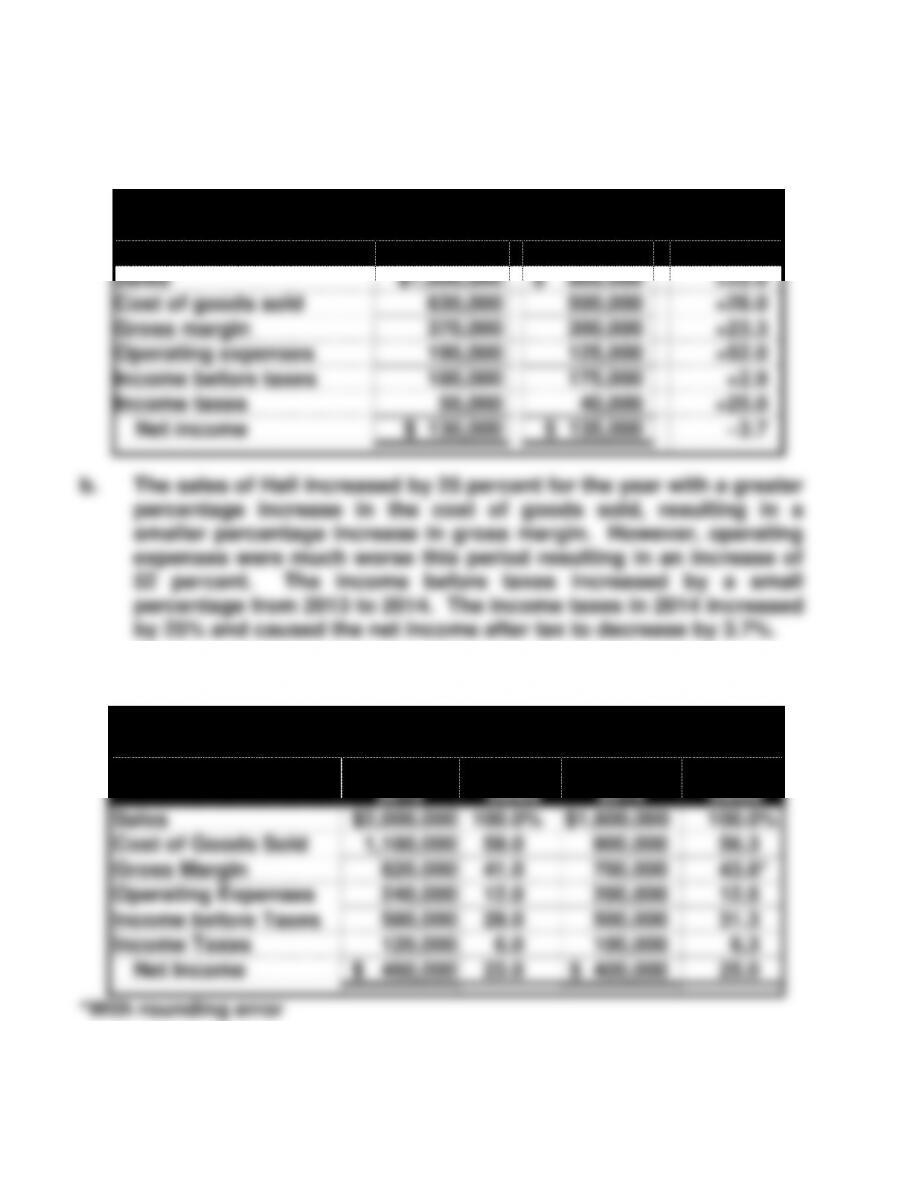
a.
Hall Corporation
Income Statements
2014
2013
% Change
Sales
$1,000,000
$ 800,000
+25.0
Cost of goods sold
630,000
500,000
+26.0
Gross margin
370,000
300,000
+23.3
Operating expenses
190,000
125,000
+52.0
Income before taxes
180,000
175,000
+2.9
Income taxes
50,000
40,000
+25.0
Net income
$ 130,000
$ 135,000
–3.7
b. The sales of Hall increased by 25 percent for the year with a greater
percentage increase in the cost of goods sold, resulting in a
smaller percentage increase in gross margin. However, operating
expenses were much worse this period resulting in an increase of
52 percent. The income before taxes increased by a small
percentage from 2013 to 2014. The income taxes in 2014 increased
by 25% and caused the net income after tax to decrease by 3.7%.
Exercise 13-2A
Jordan Company
Vertical Analysis of Income Statements
2015
% of
Sales
2014
% of
Sales
Sales
$2,000,000
100.0%
$1,600,000
100.0%
Cost of Goods Sold
1,180,000
59.0
900,000
56.3
Gross Margin
820,000
41.0
700,000
43.8*
Operating Expenses
240,000
12.0
200,000
12.5
Income before Taxes
580,000
29.0
500,000
31.3
Income Taxes
120,000
6.0
100,000
6.3
Net Income
$ 460,000
23.0
$ 400,000
25.0
*With rounding error
Exercise 13-3A
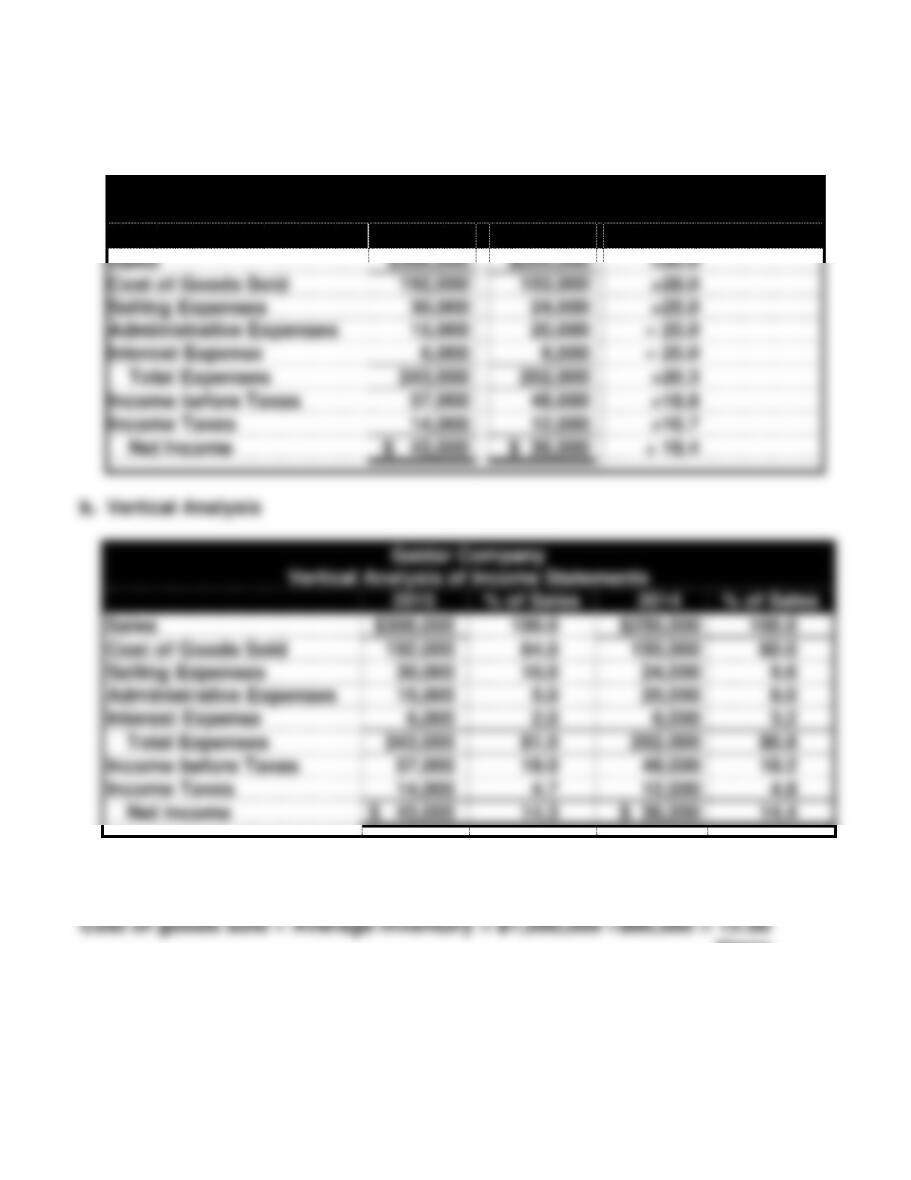
a. Horizontal Analysis
Gaidar Company
Horizontal Analysis of Income Statements
2015
2014
% Change over 2014
Sales
$300,000
$250,000
+20.0
Cost of Goods Sold
192,000
150,000
+28.0
Selling Expenses
30,000
24,000
+25.0
Administrative Expenses
15,000
20,000
– 25.0
Interest Expense
6,000
8,000
– 25.0
Total Expenses
243,000
202,000
+20.3
Income before Taxes
57,000
48,000
+18.8
Income Taxes
14,000
12,000
+16.7
Net Income
$ 43,000
$ 36,000
+ 19.4
b. Vertical Analysis
Gaidar Company
Vertical Analysis of Income Statements
2015
% of Sales
2014
% of Sales
Sales
$300,000
100.0
$250,000
100.0
Cost of Goods Sold
192,000
64.0
150,000
60.0
Selling Expenses
30,000
10.0
24,000
9.6
Administrative Expenses
15,000
5.0
20,000
8.0
Interest Expense
6,000
2.0
8,000
3.2
Total Expenses
243,000
81.0
202,000
80.8
Income before Taxes
57,000
19.0
48,000
19.2
Income Taxes
14,000
4.7
12,000
4.8
Net Income
$ 43,000
14.3
$ 36,000
14.4
Exercise 13-4A
times
Exercise 13-5A
When an account is written off, the net realizable value of accounts
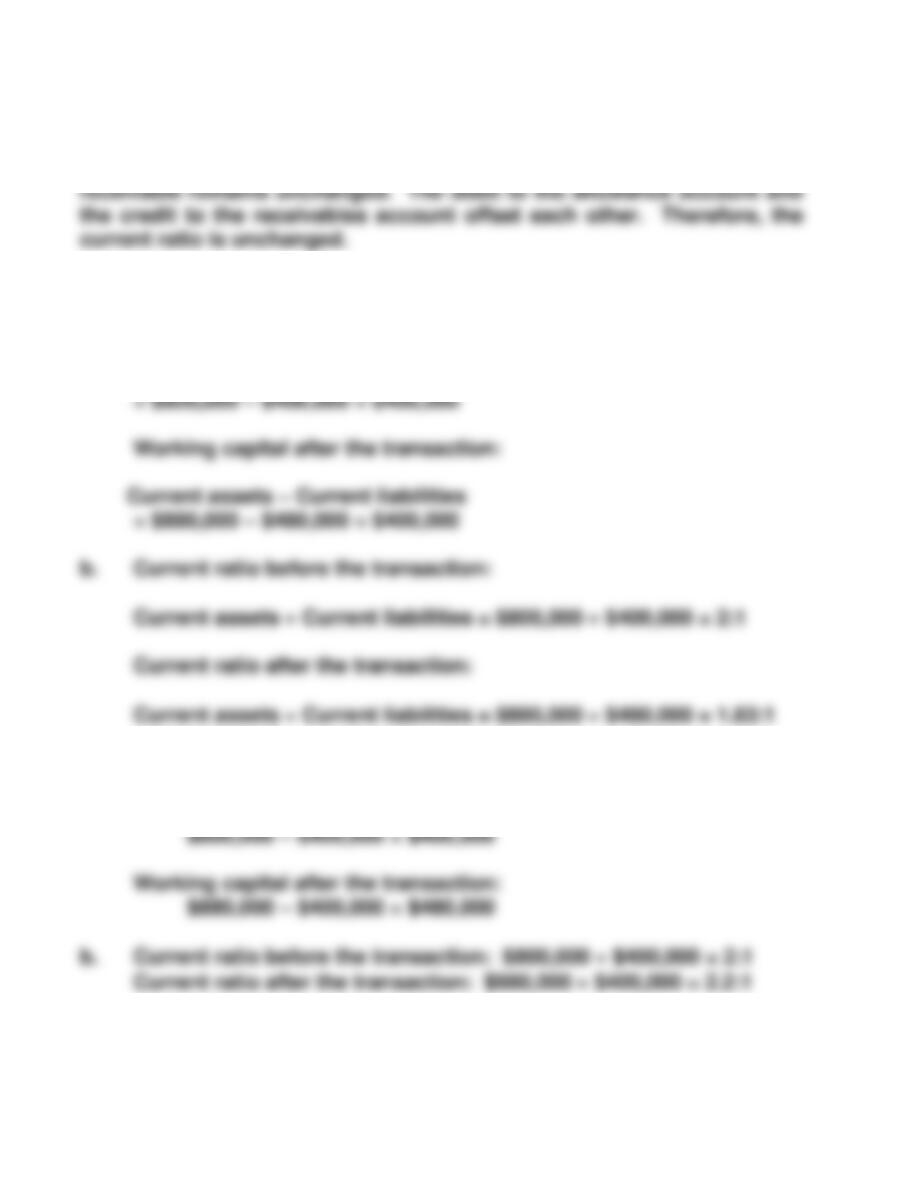
Exercise 13-6A
a. Working capital before the transaction:
Current assets – Current liabilities
Exercise 13-7A
a. Working capital before the transaction:
Exercise 13-8A
Working capital = Current assets – Current liabilities
= $300,000 – $200,000 = $100,000
Exercise 13-9A
a. Current assets = $432,000 – $294,000 = $138,000
L = 0.8 SE
0.8 SE + SE = $432,000
1.8 SE = $432,000
SE = $240,000
But, CS = $300,000
Exercise 13-10A
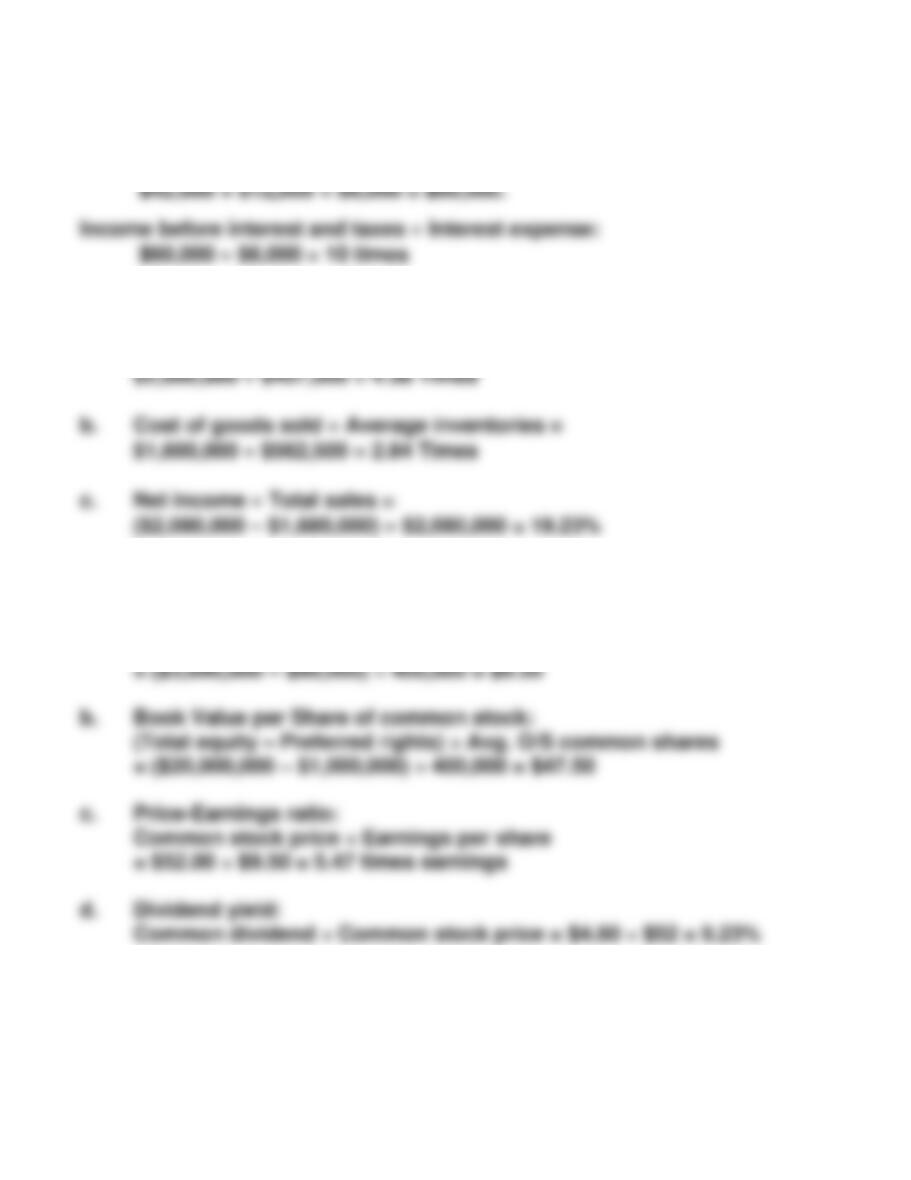
Income before interest and taxes:
Exercise 13-11A
a. Net credit sales Average net receivables =
Exercise 13-12A
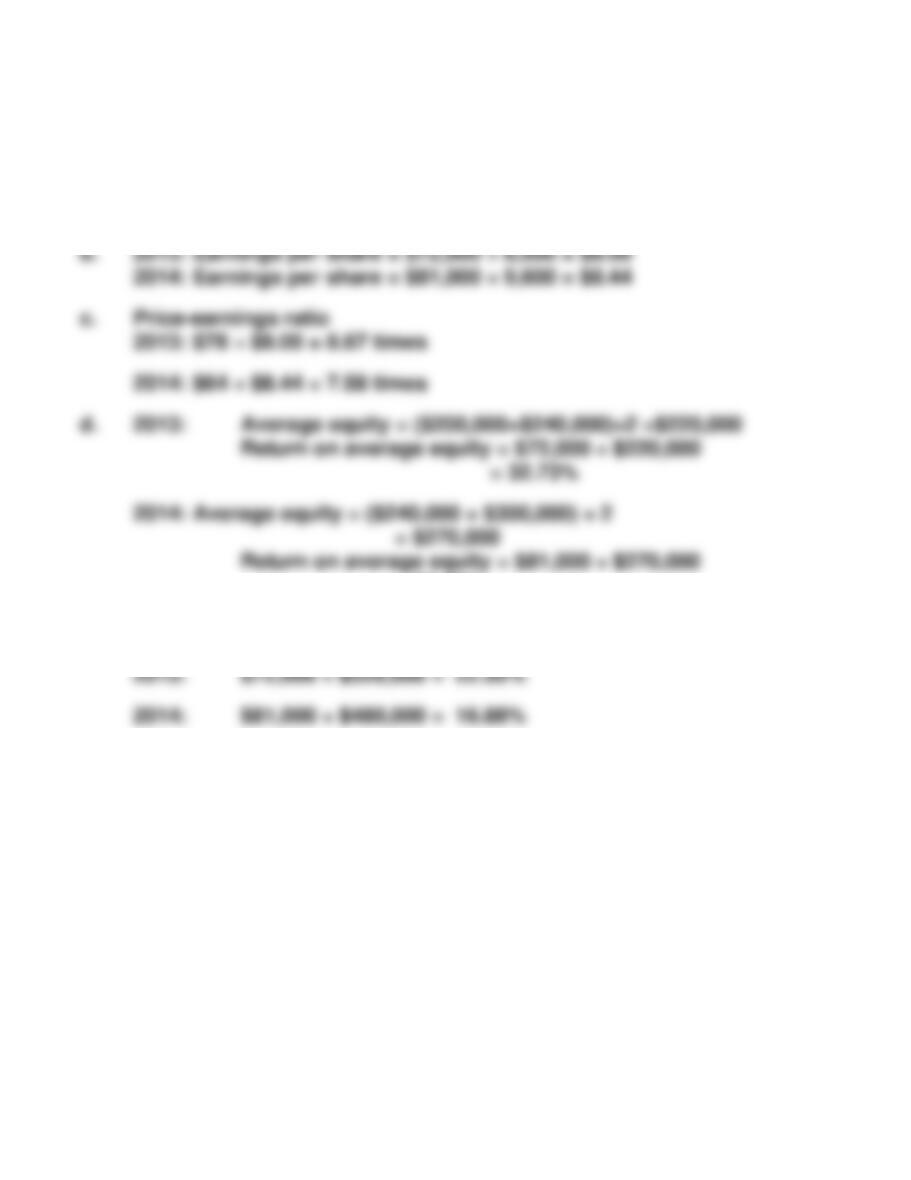
a. Earnings per share:
(Net income – Preferred dividend) ÷ Avg. O/S common shares
Exercise 13-13A
a. Current ratio: $77,000 ÷ $15,000 = 5.13:1
b. Earnings per share: $20,000 ÷ 880 = $22.73 per share
Exercise 13-14A
1. c 7. d
2. l 8. h
3. g 9. j
4. k 10. e
5. i 11. a
6. b 12. f
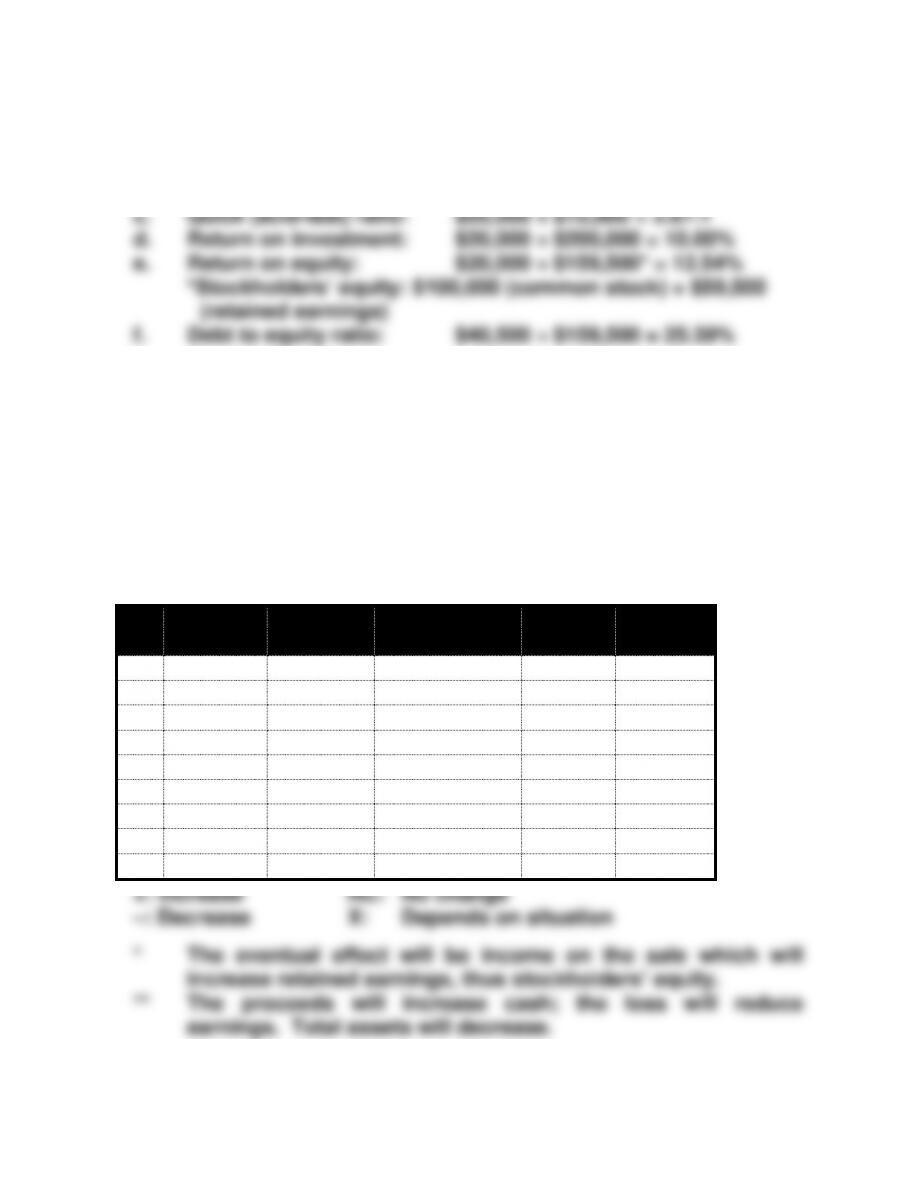
Exercise 13-15A
Current
Ratio
Working
Capital
Stockholders’
Equity
Book
Value
Retained
Earnings
a.
NC
NC
NC
NC
NC
b.
NC
NC
NC
NC
NC
c.
+
+
NC
NC
NC
d.
–
NC
NC
NC
NC
e.
–
–
–
–
–
f.
+
+
+*
+
+
g.
NC
NC
NC
–
–
h.
+
NC
NC
NC
NC
i.
+
+
–**
–
–
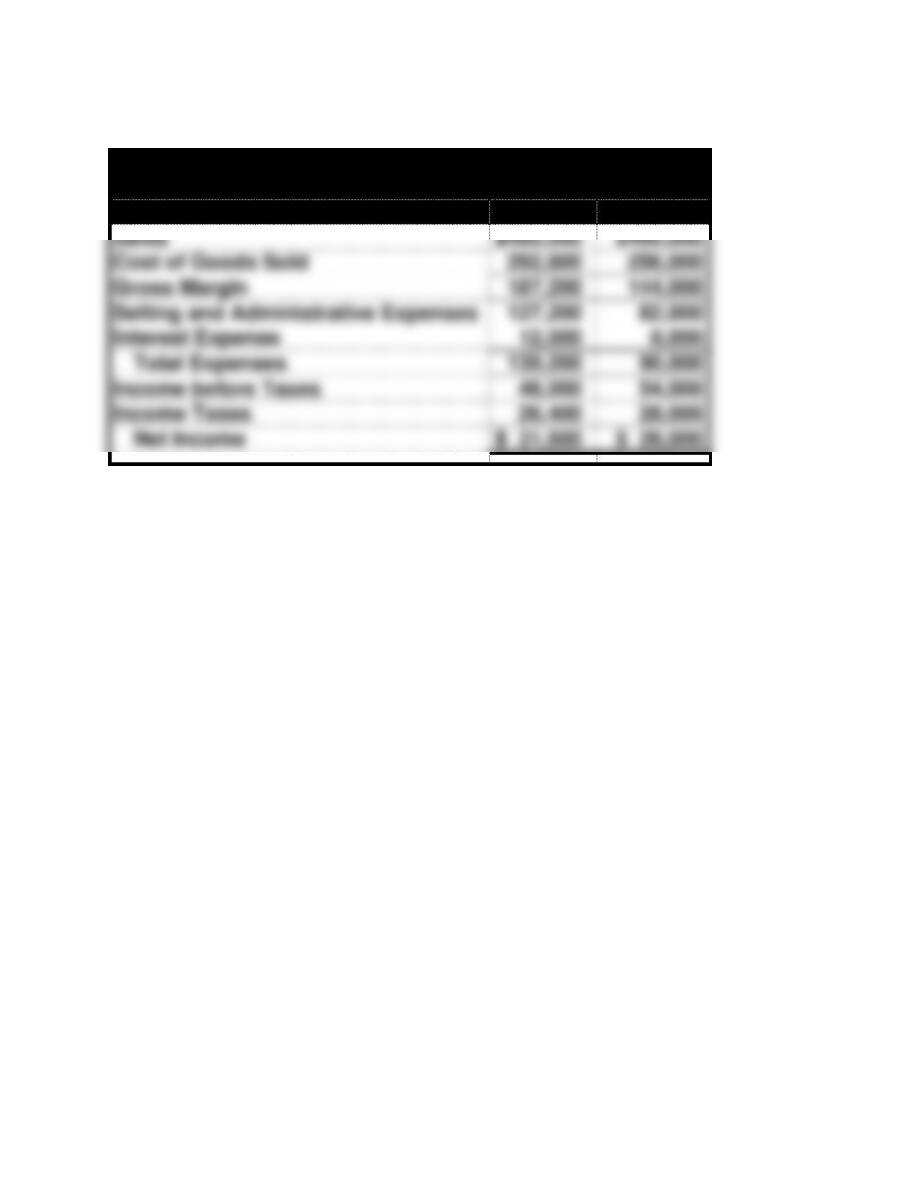
Problem 13-16A
Safin Company
Income Statements
2015
2014
Sales
$480,000
$400,000
Cost of Goods Sold
292,800
256,000
Gross Margin
187,200
144,000
Selling and Administrative Expenses
127,200
82,000
Interest Expense
12,000
8,000
Total Expenses
139,200
90,000
Income before Taxes
48,000
54,000
Income Taxes
26,400
28,000
Net Income
$ 21,600
$ 26,000
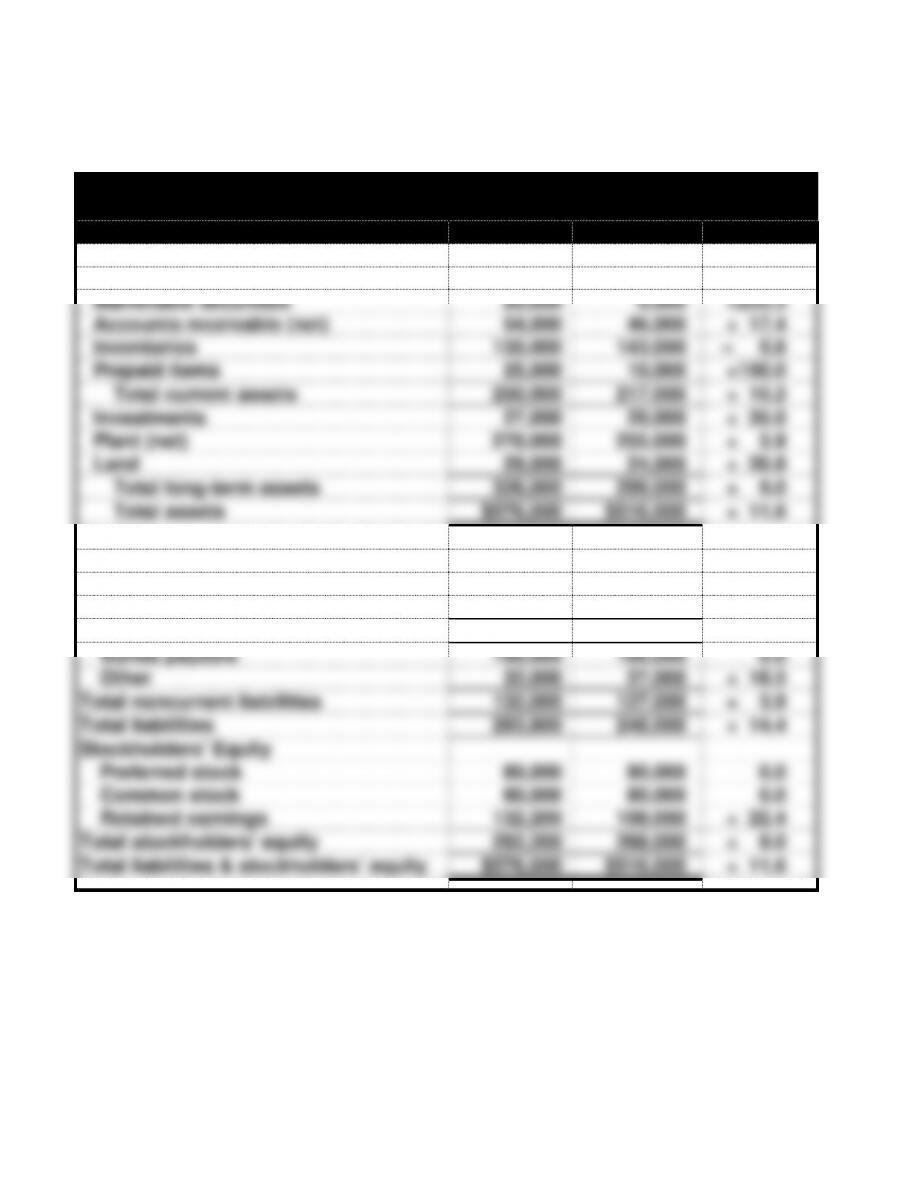
Problem 13-17A
Revnik Company
Horizontal Analysis of Balance Sheets
2015
2014
% Change
Assets
Cash
$ 16,000
$ 12,000
+ 33.3%
Marketable securities
20,000
6,000
+233.3
Accounts receivable (net)
54,000
46,000
+ 17.4
Inventories
135,000
143,000
– 5.6
Prepaid items
25,000
10,000
+150.0
Total current assets
250,000
217,000
+ 15.2
Investments
27,000
20,000
+ 35.0
Plant (net)
270,000
255,000
+ 5.9
Land
29,000
24,000
+ 20.8
Total long-term assets
326,000
299,000
+ 9.0
Total assets
$576,000
$516,000
+ 11.6
Liabilities
Notes payable
$ 17,000
$ 6,000
+183.3
Accounts payable
113,800
100,000
+ 13.8
Salaries payable
21,000
15,000
+ 40.0
Total current liabilities
151,800
121,000
+ 25.5
Bonds payable
100,000
100,000
0.0
Other
32,000
27,000
+ 18.5
Total noncurrent liabilities
132,000
127,000
+ 3.9
Total liabilities
283,800
248,000
+ 14.4
Stockholders’ Equity
Preferred stock
80,000
80,000
0.0
Common stock
80,000
80,000
0.0
Retained earnings
132,200
108,000
+ 22.4
Total stockholders’ equity
292,200
268,000
+ 9.0
Total liabilities & stockholders’ equity
$576,000
$516,000
+ 11.6
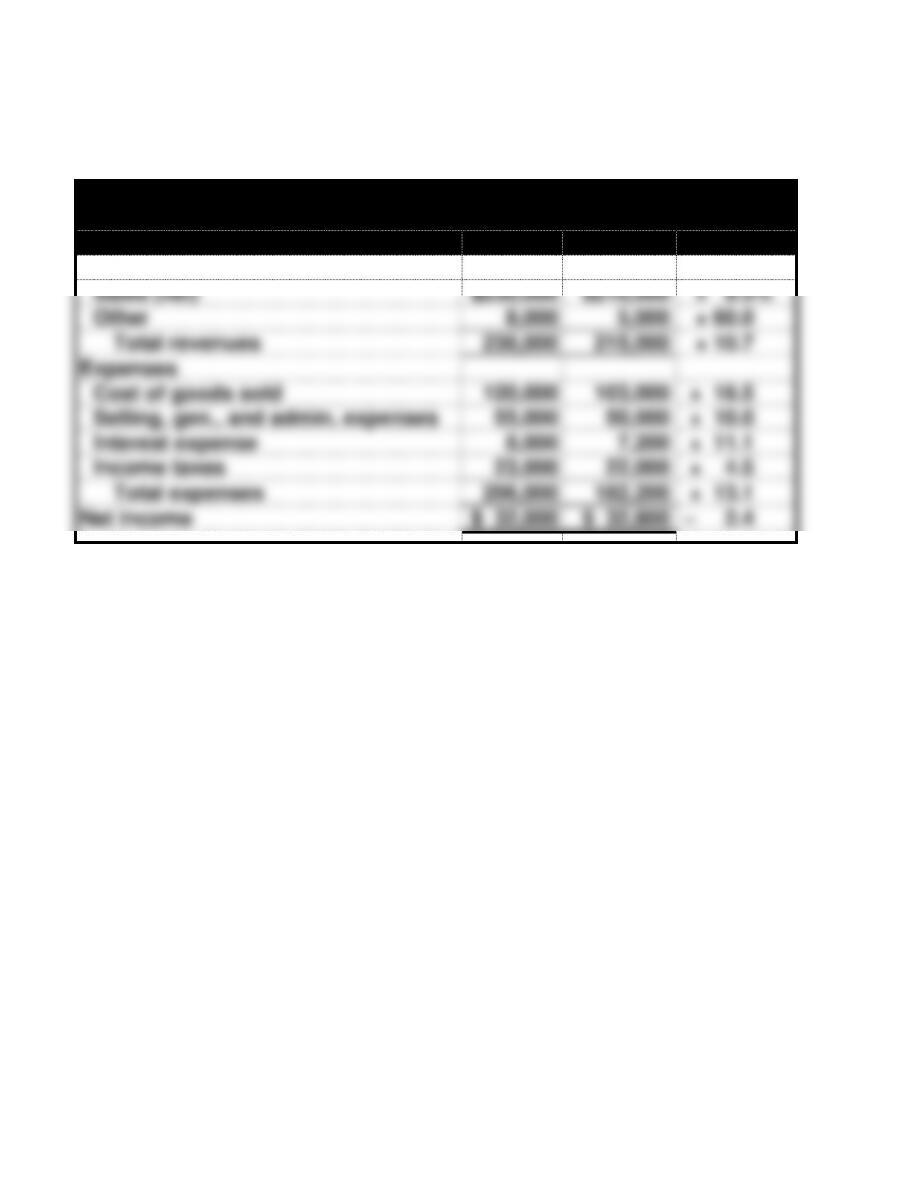
Problem 13-17A (continued)
Revnik Company
Horizontal Analysis of Income Statements
2015
2014
% Change
Revenues
Sales (net)
$230,000
$210,000
+ 9.5%
Other
8,000
5,000
+ 60.0
Total revenues
238,000
215,000
+ 10.7
Expenses
Cost of goods sold
120,000
103,000
+ 16.5
Selling, gen., and admin. expenses
55,000
50,000
+ 10.0
Interest expense
8,000
7,200
+ 11.1
Income taxes
23,000
22,000
+ 4.5
Total expenses
206,000
182,200
+ 13.1
Net income
$ 32,000
$ 32,800
– 2.4
13-1
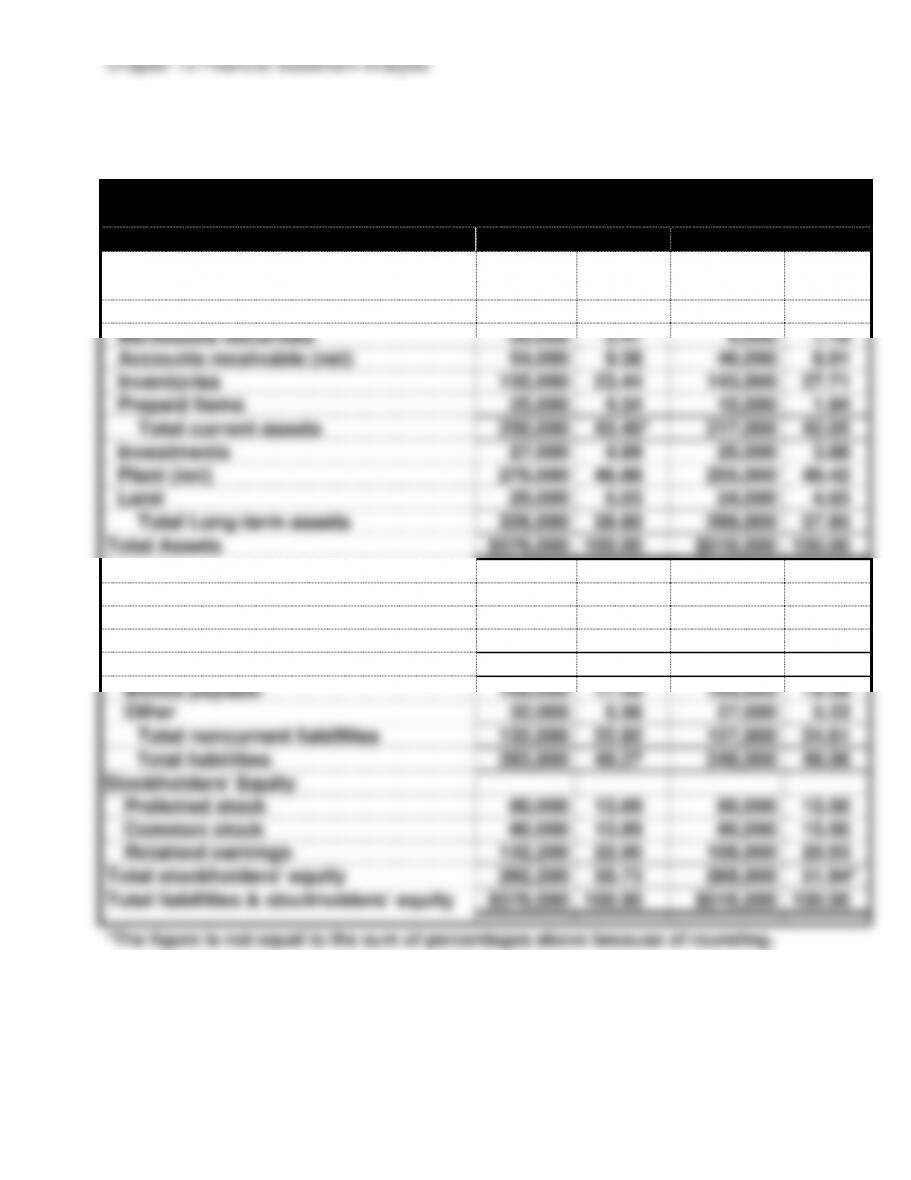
Problem 13-18A
Revnik Company
Vertical Analysis of Balance Sheets
2015
2014
Assets
Amount
% of
Total
Amount
% of
Total
Cash
$ 16,000
2.78%
$ 12,000
2.33%
Marketable securities
20,000
3.47
6,000
1.16
Accounts receivable (net)
54,000
9.38
46,000
8.91
Inventories
135,000
23.44
143,000
27.71
Prepaid Items
25,000
4.34
10,000
1.94
Total current assets
250,000
43.40*
217,000
42.05
Investments
27,000
4.69
20,000
3.88
Plant (net)
270,000
46.88
255,000
49.42
Land
29,000
5.03
24,000
4.65
Total Long-term assets
326,000
56.60
299,000
57.95
Total Assets
$576,000
100.00
$516,000
100.00
Liabilities
Notes payable
$ 17,000
2.95
$ 6,000
1.16
Accounts payable
113,800
19.76
100,000
19.38
Salaries payable
21,000
3.65
15,000
2.91
Total current liabilities
151,800
26.35*
121,000
23.45
Bonds payable
100,000
17.36
100,000
19.38
Other
32,000
5.56
27,000
5.23
Total noncurrent liabilities
132,000
22.92
127,000
24.61
Total liabilities
283,800
49.27
248,000
48.06
Stockholders’ Equity
Preferred stock
80,000
13.89
80,000
15.50
Common stock
80,000
13.89
80,000
15.50
Retained earnings
132,200
22.95
108,000
20.93
Total stockholders’ equity
292,200
50.73
268,000
51.94*
Total liabilities & stockholders’ equity
$576,000
100.00
$516,000
100.00
*The figure is not equal to the sum of percentages above because of rounding.
13-2
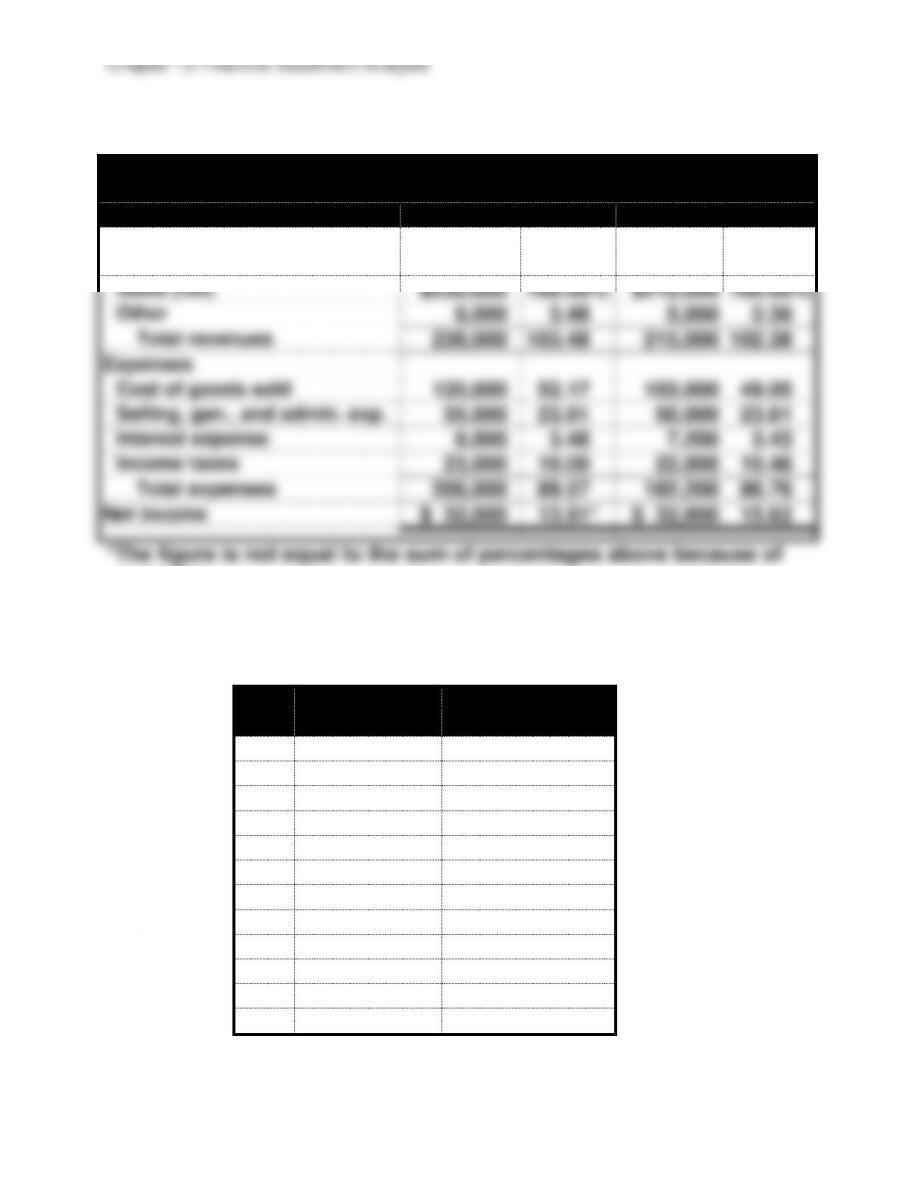
Problem 13-18A (continued)
Revnik Company
Vertical Analysis of Income Statements
2015
2014
Revenues
Amount
% of
Total
Amount
% of
Total
Sales (net)
$230,000
100.00%
$210,000
100.00%
Other
8,000
3.48
5,000
2.38
Total revenues
238,000
103.48
215,000
102.38
Expenses
Cost of goods sold
120,000
52.17
103,000
49.05
Selling, gen., and admin. exp.
55,000
23.91
50,000
23.81
Interest expense
8,000
3.48
7,200
3.43
Income taxes
23,000
10.00
22,000
10.48
Total expenses
206,000
89.57
182,200
86.76
Net income
$ 32,000
13.91*
$ 32,800
15.62
*The figure is not equal to the sum of percentages above because of
rounding.
Problem 13-19A
Current
Ratio
Working
Capital
a.
–
–
b.
NA
NA
c.
+
+
d.
+
+
e.
–
–
f.
–
NA
g.
NA
NA
h.
NA
NA
i.
NA
NA
j.
+
NA
k.
NA
NA
l.
NA
NA
Chapter 13 Financial Statement Analysis
13-3
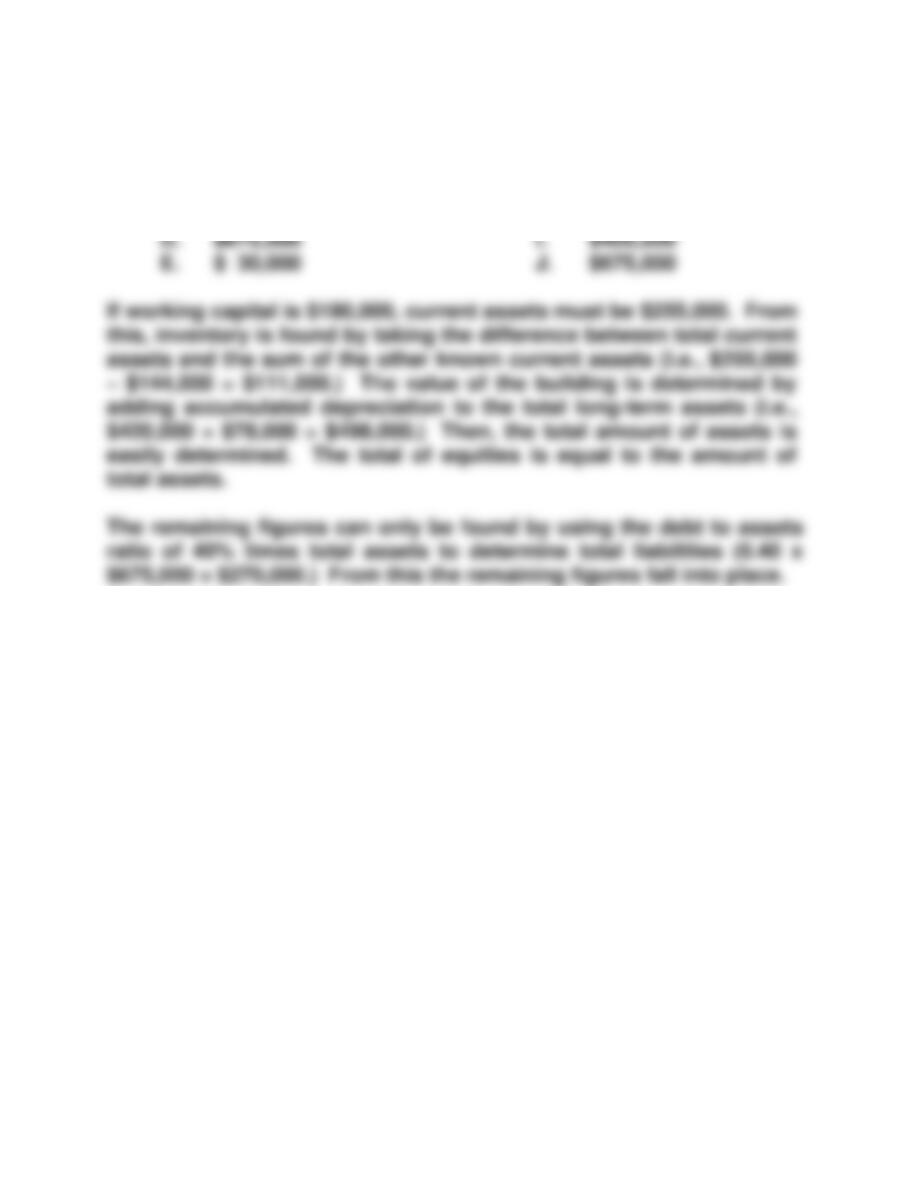
Problem 13-20A
A. $111,000 F. $195,000
B. $255,000 G. $270,000
C. $498,000 H. $195,000
13-4
Problem 13-21A
a. Earnings per share:
$195,600 – $22,800*
———————————— = $4 per share
5
13-5
Problem 13-22A
a. Times interest earned
2013: $98,000 ÷ $8,000 = 12.25 times
2014: $120,000 ÷ $9,000 = 13.33 times
= 30.00%
e. Net margin:
6
13-6
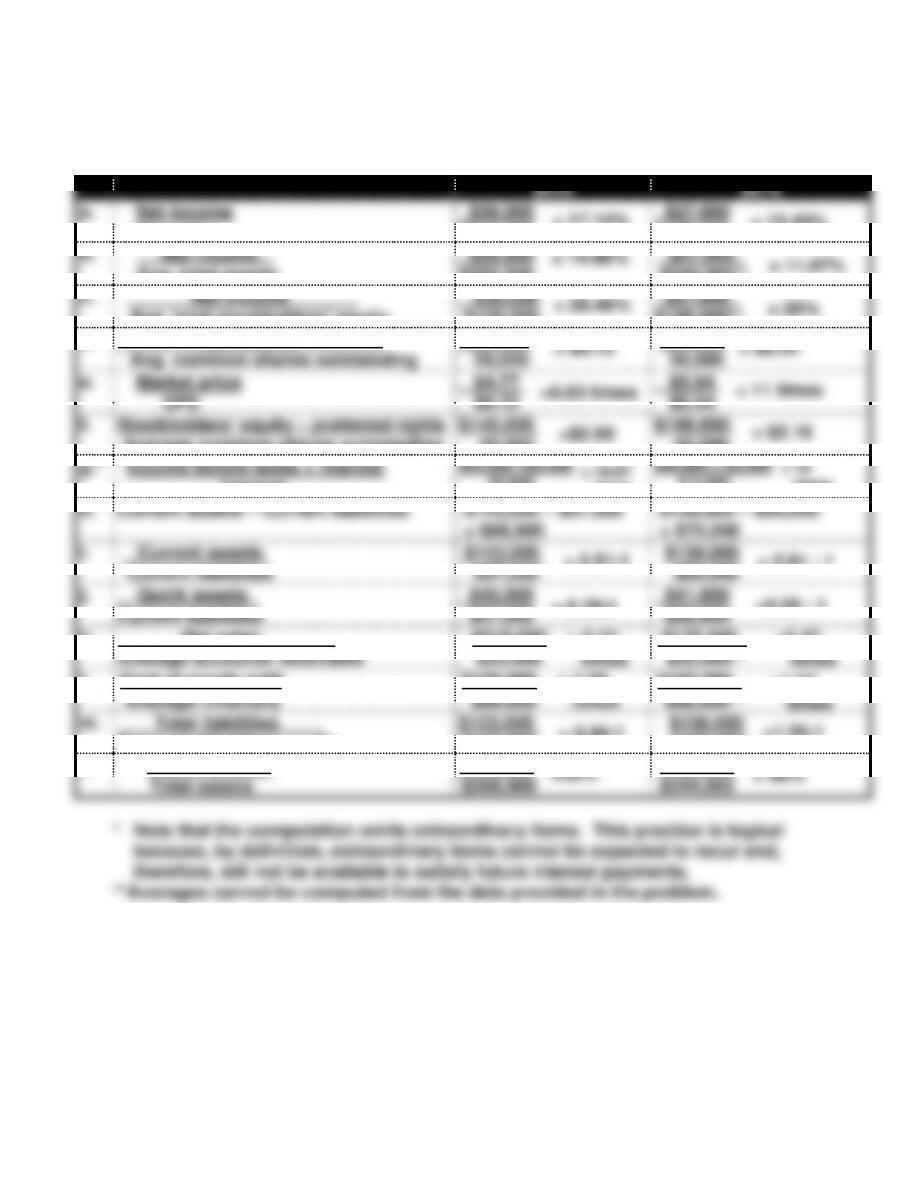
Problem 13-23A
2015
2014
a.
Net income
Net sales
$36,000
$210,000
$27,000
$175,000
b.
Net income
Avg. total assets
$36,000
$256,000
$27,000
$244,000**
c.
Net income
Avg. total stockholders’ equity
$36,000
$126,500
$27,000
$108,000**
d.
Net income
Avg. common shares outstanding
$36,000
50,000
$27,000
50,000
e.
Market price
EPS
$4.77
$0.72
$5.94
$0.54
f.
Stockholders’ equity – preferred rights
Average common shares outstanding
$145,000
50,000
$108,000
50,000
g.*
Income before taxes + Interest
Interest
$53,000*+$3,000
$3,000
$45,000 + $3,000
$ 3,000
h.
Current assets – Current liabilities
$143,000 – $57,000
= $86,000
$139,000 – $69,000
= $70,000
i.
Current assets
Current liabilities
$143,000
$57,000
$139,000
$69,000
j.
Quick assets
Current liabilities
$40,000
$57,000
$41,000
$69,000
k.
Net sales
Average accounts receivable
$210,000
$33,500
$175,000
$32,000**
l.
Cost of goods sold
Average inventory
$126,000
$98,000
$103,000
$96,000**
m.
Total liabilities
Total stockholders’ equity
$123,000
$145,000
$136,000
$108,000
n.
Total liabilities
Total assets
$123,000
$268,000
$136,000
$244,000
= 17.14%
= 15.43%
= 28.46%
= 11.07%
= 14.06%
= 25%
= $0.72
= $0.54
=6.63 times
= 11 times
=$2.90
= $2.16
= 18.67
times
= 16
times
= 2.51:1
= 2.01 : 1
= 0.70:1
=0.59 : 1
= 6.27
times
=5.47
times
= 1.29
times
=1.07
times
= 0.85:1
=1.26:1
=46%
= 56%
7
13-7
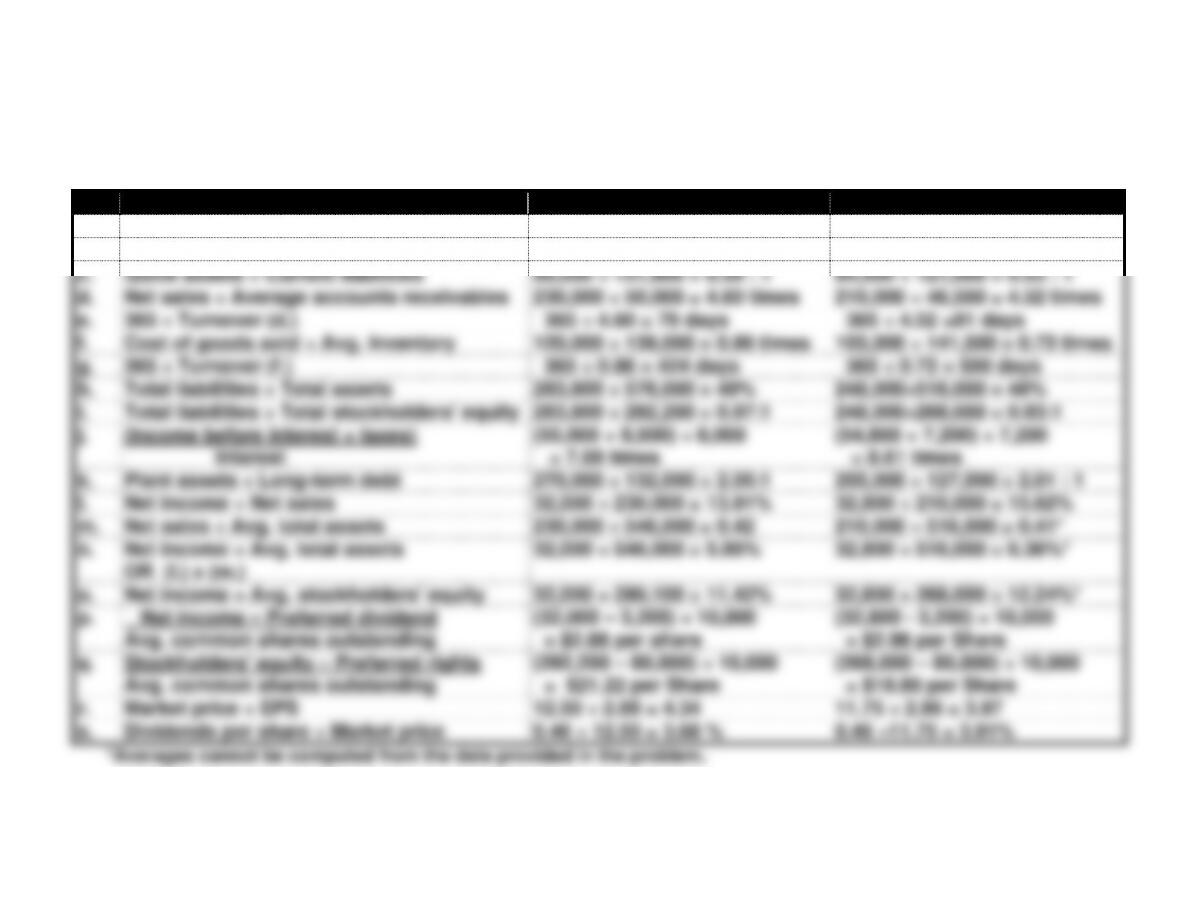
Problem 13-24A
Because of space limitation, $ signs are omitted in these computations.
2015
2014
a.
Current assets – Current liabilities
250,000 – 151,800 = 98,200
217,000 – 121,000 = 96,000
b.
Current assets ÷ Current liabilities
250,000 ÷ 151,800 = 1.65 : 1
217,000 ÷ 121,000 = 1.79 : 1
c.
Quick assets ÷ Current liabilities
90,000 ÷ 151,800 = 0.59 : 1
64,000 ÷ 121,000 = 0.53 : 1
d.
Net sales ÷ Average accounts receivables
230,000 ÷ 50,000 = 4.60 times
210,000 ÷ 46,500 = 4.52 times
e.
365 ÷ Turnover (d.)
365 ÷ 4.60 = 79 days
365 ÷ 4.52 =81 days
f.
Cost of goods sold ÷ Avg. inventory
120,000 ÷ 139,000 = 0.86 times
103,000 ÷ 141,500 = 0.73 times
g.
365 ÷ Turnover (f.)
365 ÷ 0.86 = 424 days
365 ÷ 0.73 = 500 days
h.
Total liabilities ÷ Total assets
283,800 ÷ 576,000 = 49%
248,000÷516,000 = 48%
i.
Total liabilities ÷ Total stockholders’ equity
283,800 ÷ 292,200 = 0.97:1
248,000÷268,000 = 0.93:1
j.
(Income before interest + taxes)
Interest
(55,000 + 8,000) ÷ 8,000
= 7.88 times
(54,800 + 7,200) ÷ 7,200
= 8.61 times
k.
Plant assets ÷ Long-term debt
270,000 ÷ 132,000 = 2.05:1
255,000 ÷ 127,000 = 2.01 : 1
l.
Net income ÷ Net sales
32,000 ÷ 230,000 = 13.91%
32,800 ÷ 210,000 = 15.62%
m.
Net sales ÷ Avg. total assets
230,000 ÷ 546,000 = 0.42
210,000 ÷ 516,000 = 0.41*
n.
Net income ÷ Avg. total assets
OR (l.) x (m.)
32,000 ÷ 546,000 = 5.86%
32,800 ÷ 516,000 = 6.36%*
o.
Net income ÷ Avg. stockholders’ equity
32,000 ÷ 280,100 = 11.42%
32,800 ÷ 268,000 = 12.24%*
p.
Net income – Preferred dividend
Avg. common shares outstanding
(32,000 – 3,200) ÷ 10,000
= $2.88 per share
(32,800 – 3,200) ÷ 10,000
= $2.96 per Share
q.
Stockholders’ equity – Preferred rights
Avg. common shares outstanding
(292,200 – 80,000) ÷ 10,000
= $21.22 per Share
(268,000 – 80,000) ÷ 10,000
= $18.80 per Share
r.
Market price ÷ EPS
12.50 ÷ 2.88 = 4.34
11.75 ÷ 2.96 = 3.97
s.
Dividends per share ÷ Market price
0.46 ÷ 12.50 = 3.68 %
0.46 ÷11.75 = 3.91%
8
13-8
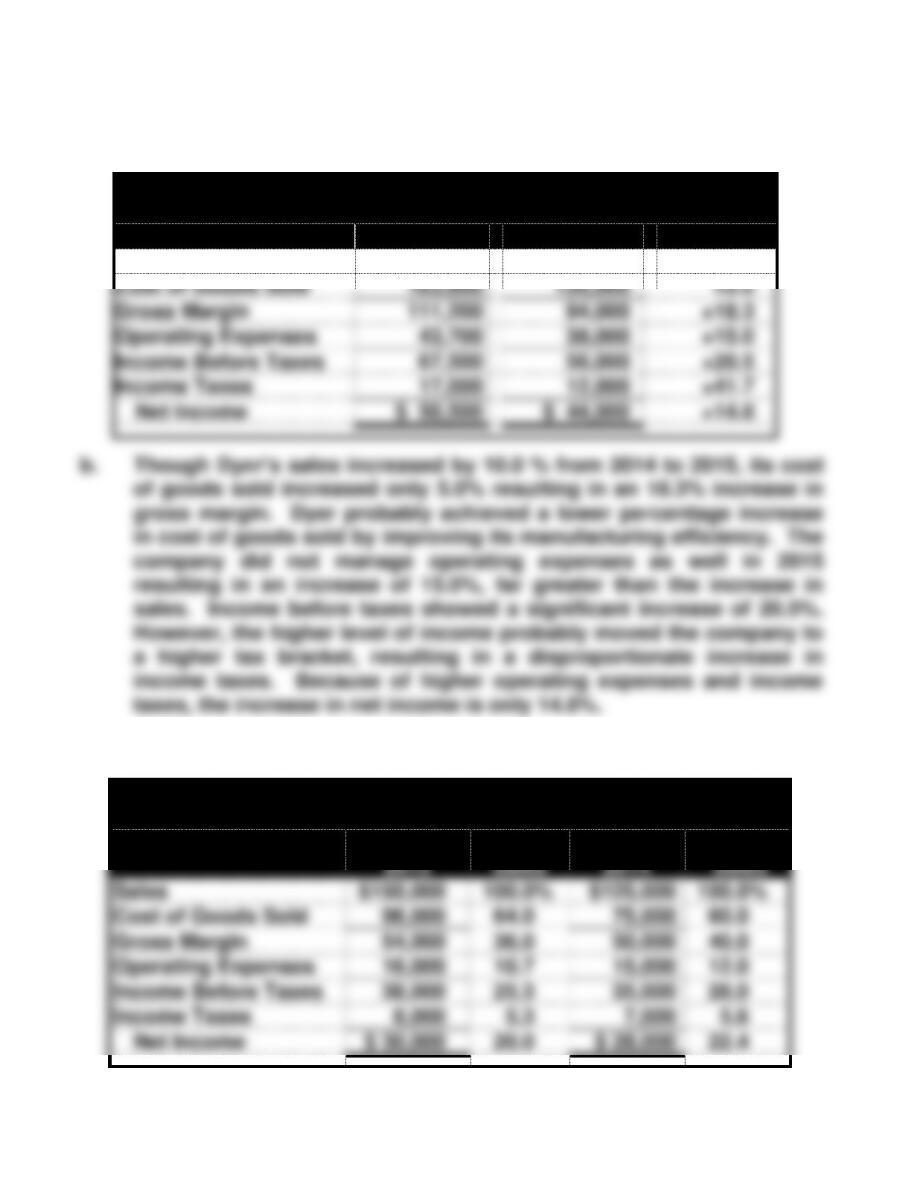
Exercise 13-1B
a.
Dyer Corporation
Income Statements
2015
2014
% Change
Sales
$275,000
$250,000
+10.0
Cost of Goods Sold
163,800
156,000
+5.0
Gross Margin
111,200
94,000
+18.3
Operating Expenses
43,700
38,000
+15.0
Income Before Taxes
67,500
56,000
+20.5
Income Taxes
17,000
12,000
+41.7
Net Income
$ 50,500
$ 44,000
+14.8
b. Though Dyer’s sales increased by 10.0 % from 2014 to 2015, its cost
of goods sold increased only 5.0% resulting in an 18.3% increase in
gross margin. Dyer probably achieved a lower percentage increase
in cost of goods sold by improving its manufacturing efficiency. The
company did not manage operating expenses as well in 2015
resulting in an increase of 15.0%, far greater than the increase in
sales. Income before taxes showed a significant increase of 20.5%.
However, the higher level of income probably moved the company to
a higher tax bracket, resulting in a disproportionate increase in
income taxes. Because of higher operating expenses and income
taxes, the increase in net income is only 14.8%.
Exercise 13-2B
Jarrett Company
Vertical Analysis of Income Statements
2015
% of
Sales
2014
% of
Sales
Sales
$150,000
100.0%
$125,000
100.0%
Cost of Goods Sold
96,000
64.0
75,000
60.0
Gross Margin
54,000
36.0
50,000
40.0
Operating Expenses
16,000
10.7
15,000
12.0
Income Before Taxes
38,000
25.3
35,000
28.0
Income Taxes
8,000
5.3
7,000
5.6
Net Income
$ 30,000
20.0
$ 28,000
22.4