E-1
SOLUTIONS TO EXERCISES – APPENDIX E
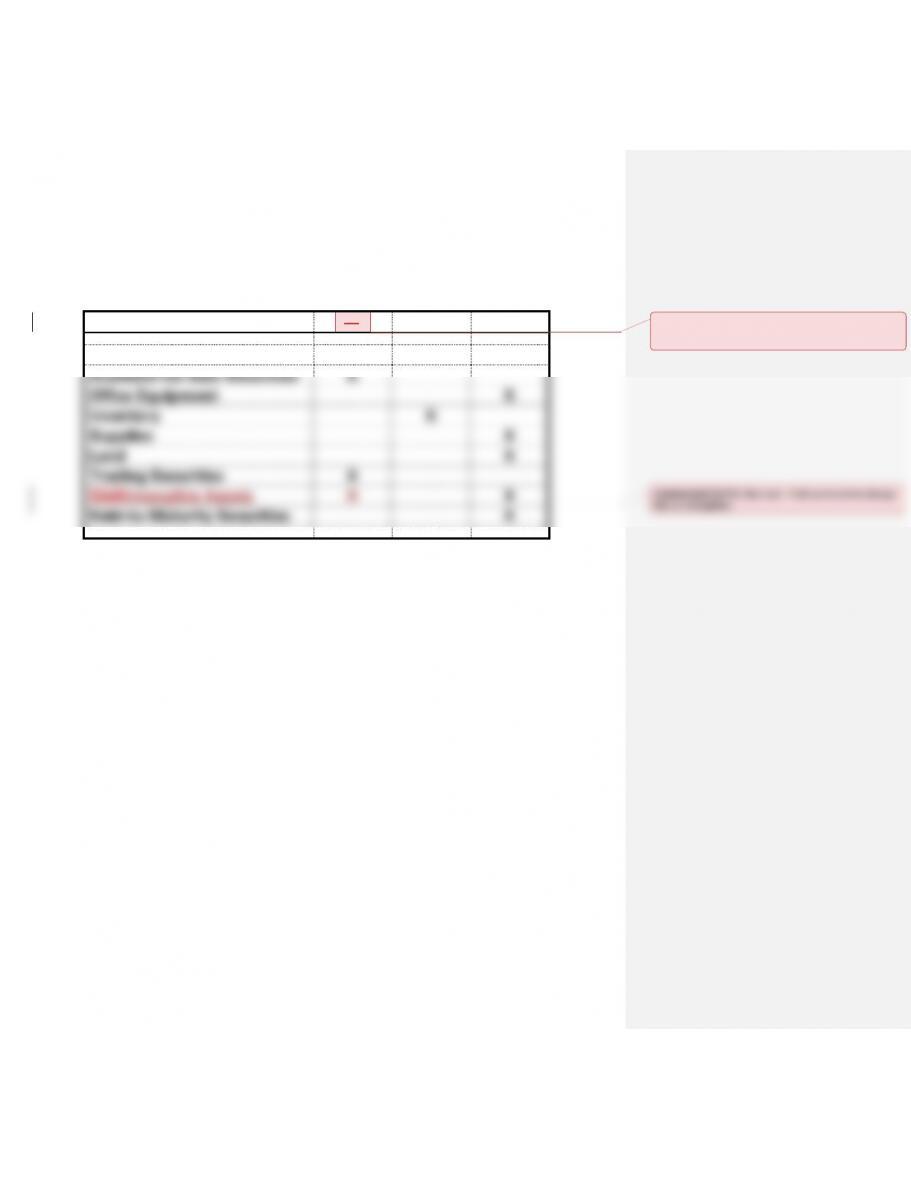
EXERCISE E1
Asset
FMV
LCM
HC/AC
Buildings
X
Available-for-Sale Securities
X
Office Equipment
X
Inventory
X
Supplies
X
Land
X
Trading Securities
X
CashIntangible Assets
X
X
Held-to-Maturity Securities
X
Commented [ILP1]: You can’t use FMV anymore – the
term is no longer used in authoritative literature (FASB
ASC)
Commented [ILP2]: See text – I left comment to change
this to intangibles
E-2
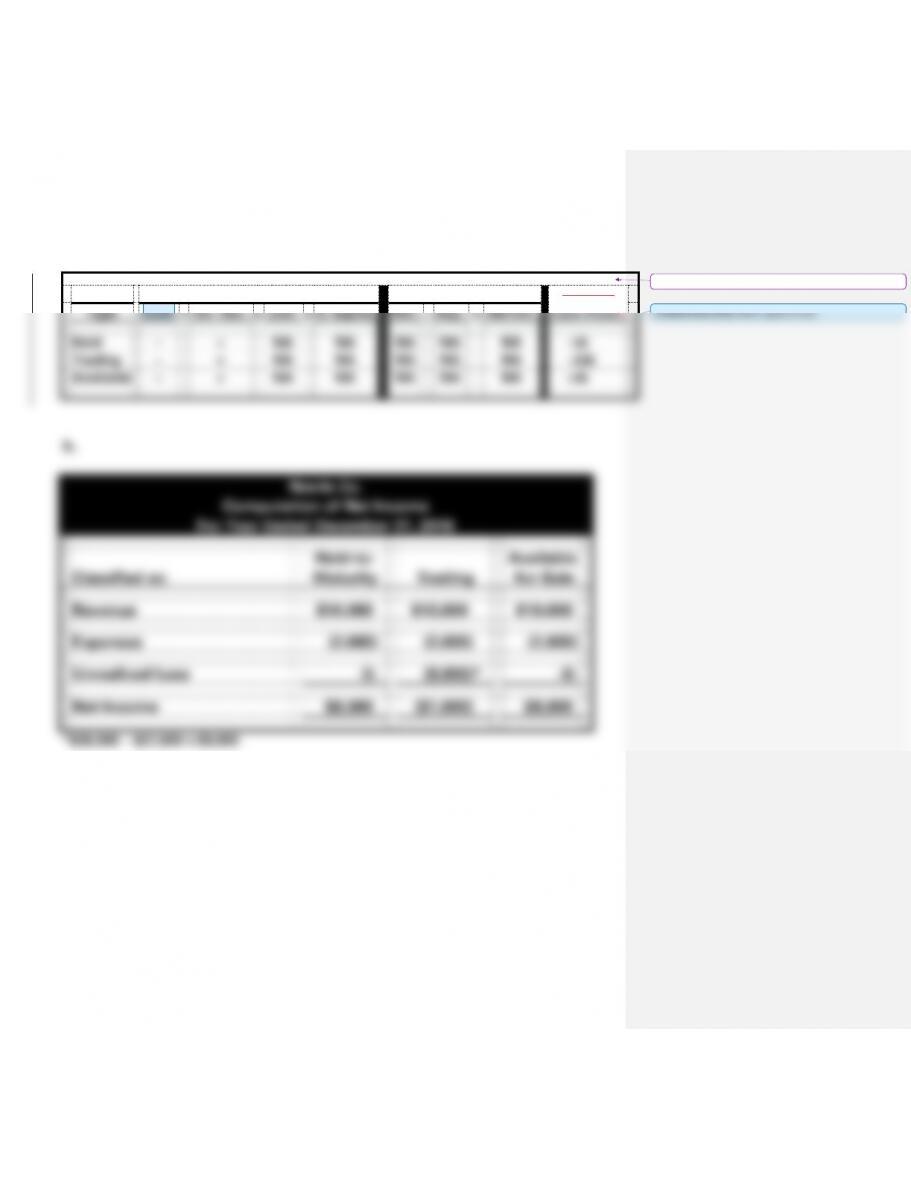
EXERCISE E2
a.
Balance Sheet
Income Statement
Stmt. of
Type
Cash
+
Inv. Sec.
=
Liab.
+
S. Equity
Rev.
−
Exp.
=
Net Inc.
Cash Flows
Held
−
+
NA
NA
NA
NA
NA
−IA
Trading
−
+
NA
NA
NA
NA
NA
−OA
Available
−
+
NA
NA
NA
NA
NA
−IA
b.
Norris Co.
Computation of Net Income
For Year Ended December 31, 2016
Classified as:
Held-to–
Maturity
Trading
Available
-for-Sale
Revenue
$10,000
$10,000
$10,000
Expenses
(2,000)
(2,000)
(2,000)
Unrealized Loss
-0-
(9,000)*
-0-
Net Income
$8,000
($1,000)
$8,000
*$36,000 – $27,000 = $9,000
Formatted Table
Commented [D3]: Add a space in box
E-3
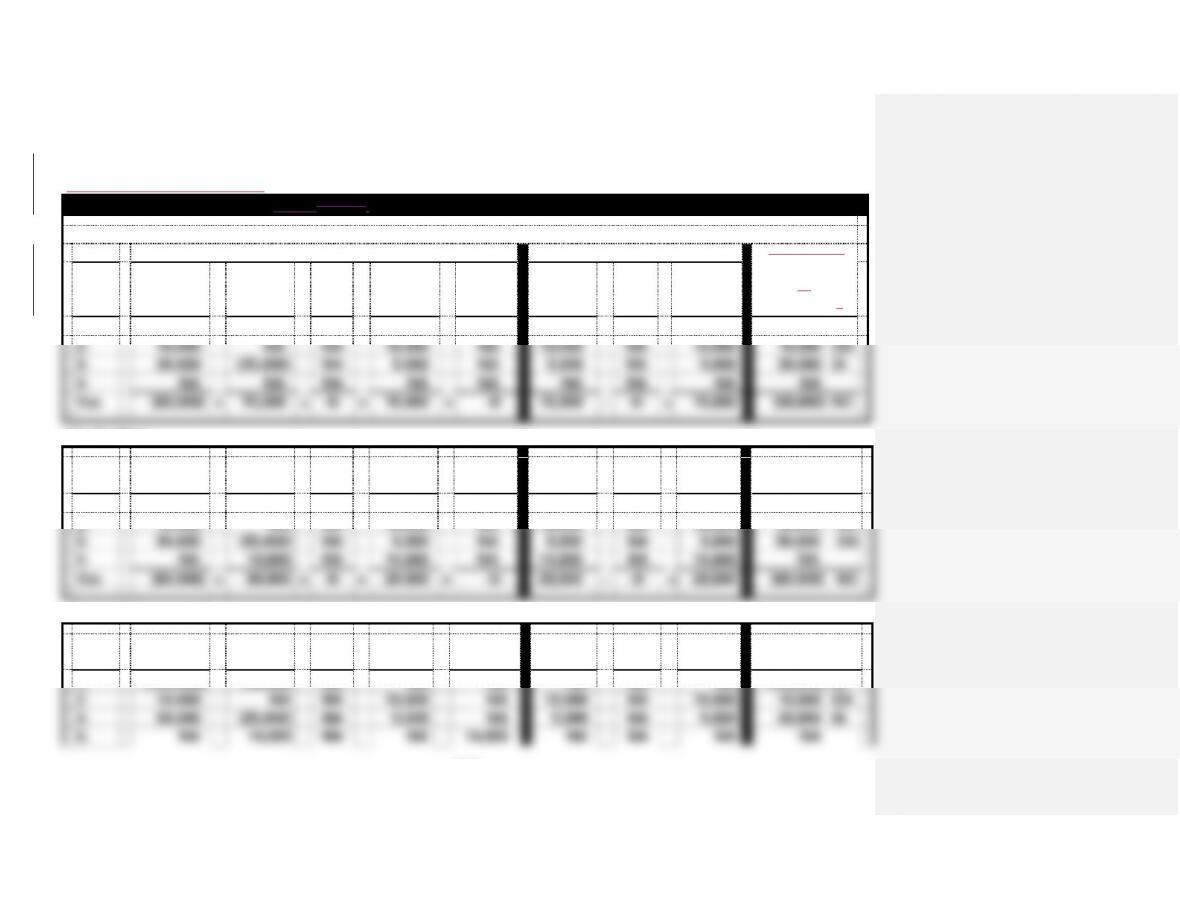
EXERCISE E3
NC = Net Change in Cash
BotterArnold Supply Co. Horizontal Statements Models
(1) Held-to-Maturity
Balance Sheet
Income Statement
Statement
Event
Cash
+
Inv. Sec.
=
Liab.
+
Ret. Ear.
+
Unreal.
Gain.
Rev./
Gain
−
Exp./
Loss
=
Net Inc.
of
Cash Flows
1.
(100,000)
100,000
NA
NA
NA
NA
NA
NA
(100,000) IA
2.
10,000
NA
NA
10,000
NA
10,000
NA
10,000
10,000 OA
3.
30,000
(25,000)
NA
5,000
NA
5,000
NA
5,000
30,000 IA
4.
NA
NA
NA
NA
NA
NA
NA
NA
NA
Tot.
(60,000)
+
75,000
=
-0-
+
15,000
+
-0-
15,000
−
-0-
=
15,000
(60,000) NC
(2) Trading
Event
Cash
+
Inv. Sec.
=
Liab.
+
Ret. Ear.
+
Unreal.
Gain
Rev./
Gain
−
Exp./
Loss
=
Net Inc.
Cash Flow
1.
(100,000)
100,000
NA
NA
NA
NA
NA
NA
(100,000) OA
2.
10,000
NA
NA
10,000
NA
10,000
NA
10,000
10,000 OA
3.
30,000
(25,000)
NA
5,000
NA
5,000
NA
5,000
30,000 OA
4.
NA
14,000
NA
14,000
NA
14,000
NA
14,000
NA
Tot.
(60,000)
+
89,000
=
-0-
+
29,000
+
-0-
29,000
−
-0-
=
29,000
(60,000) NC
(3) Available-for-Sale
Event
Cash
+
Inv. Sec.
=
Liab.
+
Ret.
Ear.
+
Unreal.
Gain
Rev./
Gain
−
Exp./
Loss
=
Net Inc.
Cash Flow
1.
(100,000)
100,000
NA
NA
NA
NA
NA
NA
(100,000) IA
2.
10,000
NA
NA
10,000
NA
10,000
NA
10,000
10,000 OA
3.
30,000
(25,000)
NA
5,000
NA
5,000
NA
5,000
30,000 IA
4.
NA
14,000
NA
NA
14,000
NA
NA
NA
NA
E-4
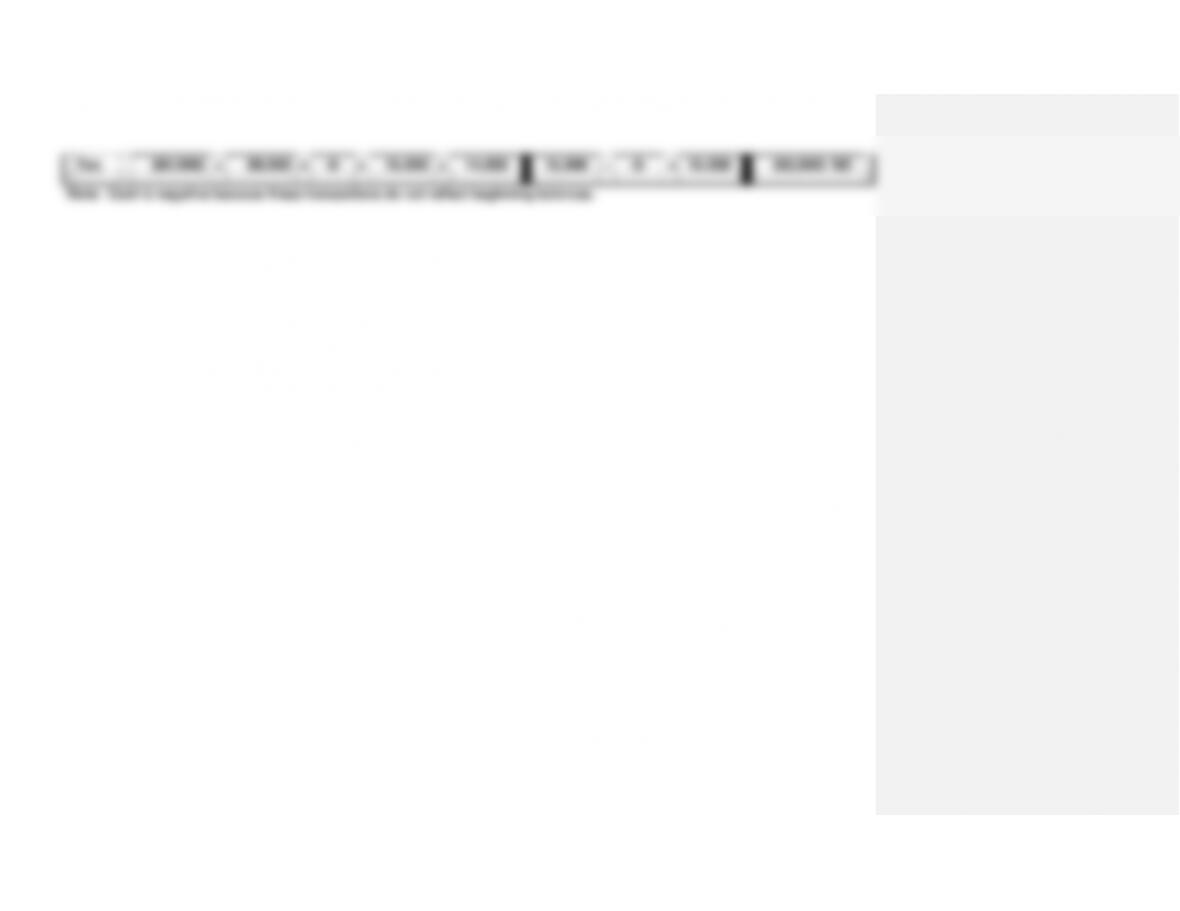
Tot.
(60,000)
+
89,000
=
-0-
+
15,000
+
14,000
15,000
−
-0-
=
15,000
(60,000) NC
Note: Cash is negative because these transactions do not reflect beginning balances.
E-5
EXERCISE E3 (cont.)
b. Held-to-Maturity $15,000
Trading $29,000
Available-for-Sale $15,000
E-6
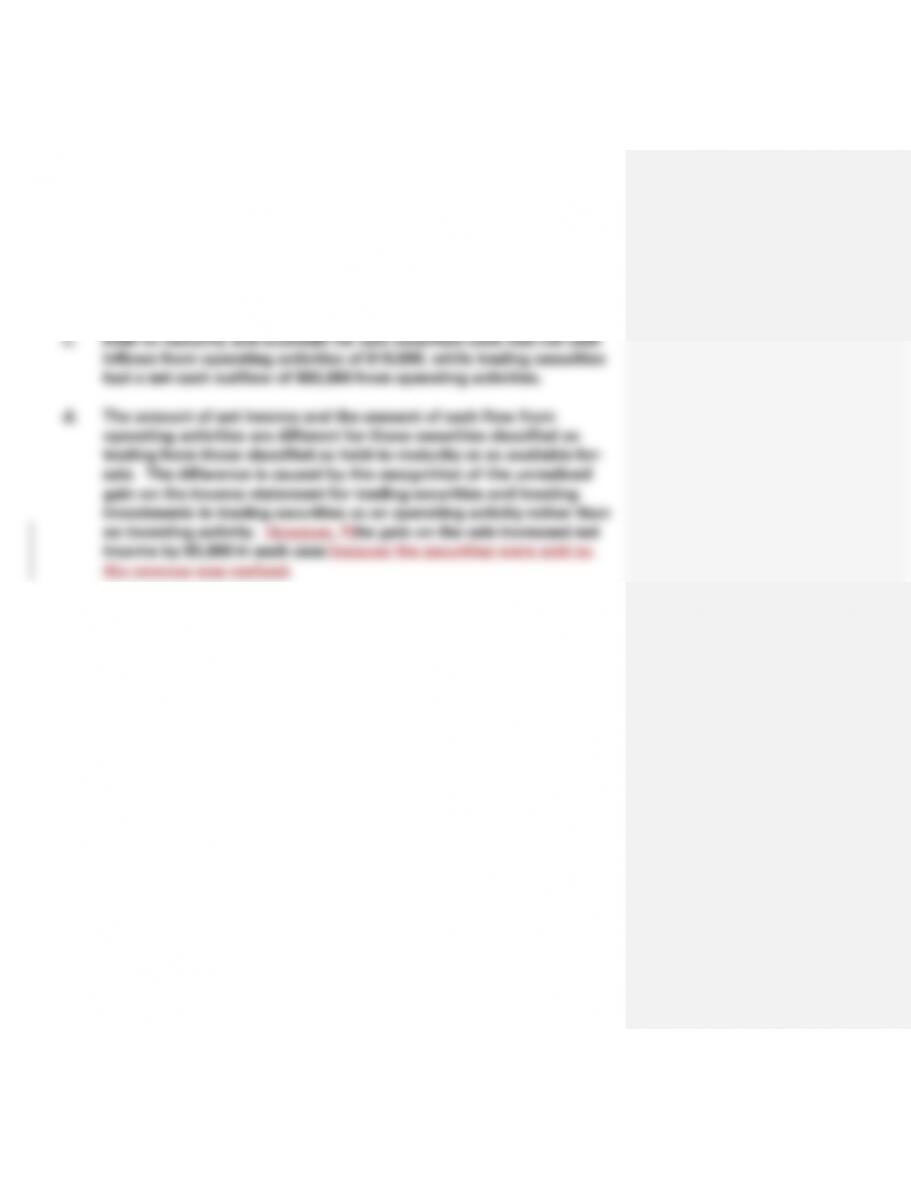
EXERCISE E4
Transactions are recorded in the accounting equation for the use of the
instructor.
Assets
=
Stockholders’ Equity
Event
Cash
+
Inv. Sec.
=
C. Stock
+
Ret. Earn.
+
Unreal.
Gain
Beg. Bal.
100,000
-0-
100,000
-0-
-0-
1. Purchase. Secs.
(20,000)
20,000
-0-
-0-
-0-
2. Inv. Revenue.
600
-0-
-0-
600
-0-
3. Sold Secs.
14,000
(10,000)
-0-
4,000
-0-
4. Pur.chase Secs.
(7,000)
7,000
-0-
-0-
-0-
Totals
87,600
17,000
100,000
4,600
-0-
5. Mkt. Val.Fair
Value if HM
-0-
-0-
-0-
-0-
-0-
5. Mkt. Val.Fair
Value if TR
-0-
5,000
-0-
5,000
-0-
5. Mkt. Val.Fair
Value if AS
-0-
5,000
-0-
-0-
5,000
E-7
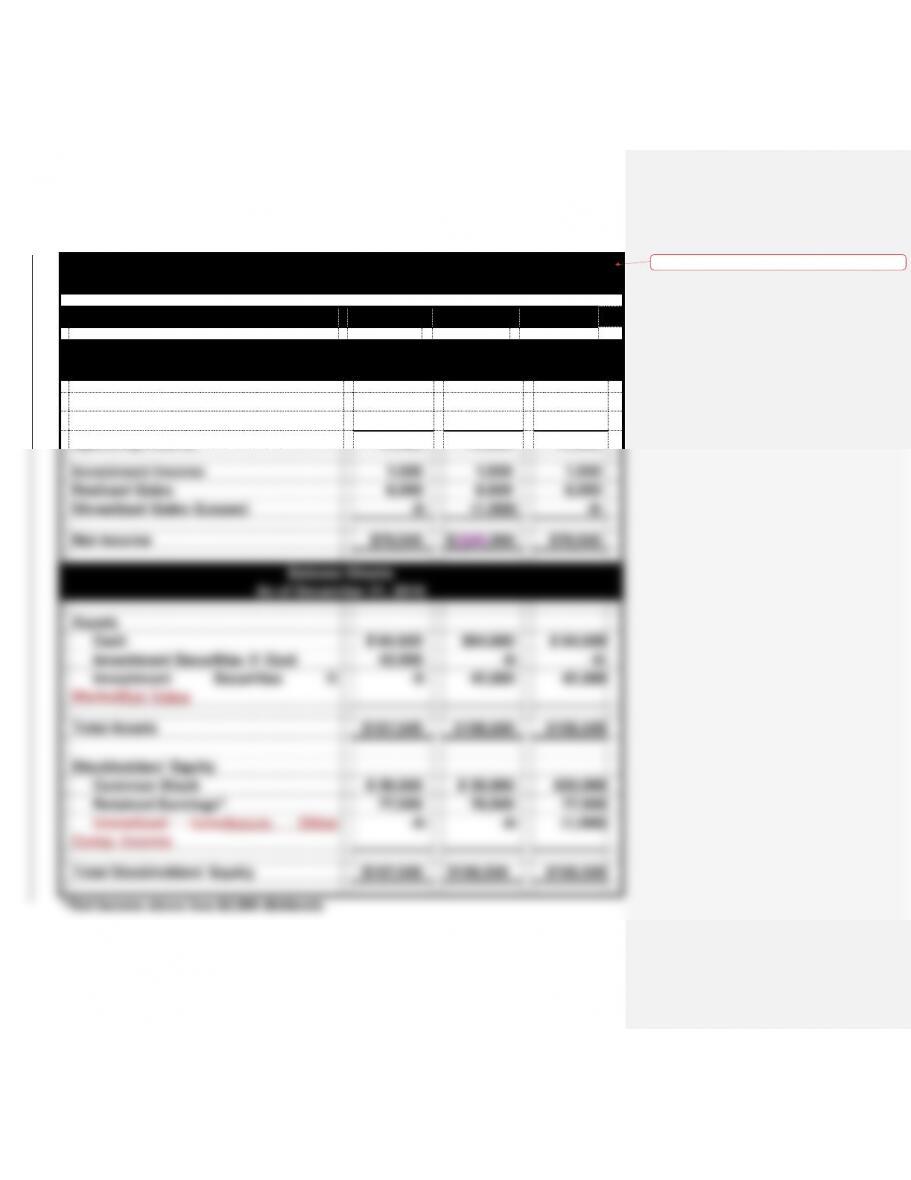
EXERCISE E4 (cont.)
MoltenMedia, Inc.
Financial Statements For Year Ending 2016
Classified as:
Held
Trading
Available
Income Statements
Investment Revenue
$ 600
$ 600
$ 600
Realized Gain
4,000
4,000
4,000
Unrealized Gain
-0-
5,000
-0-
Net Income
$4,600
$9,600
$4,600
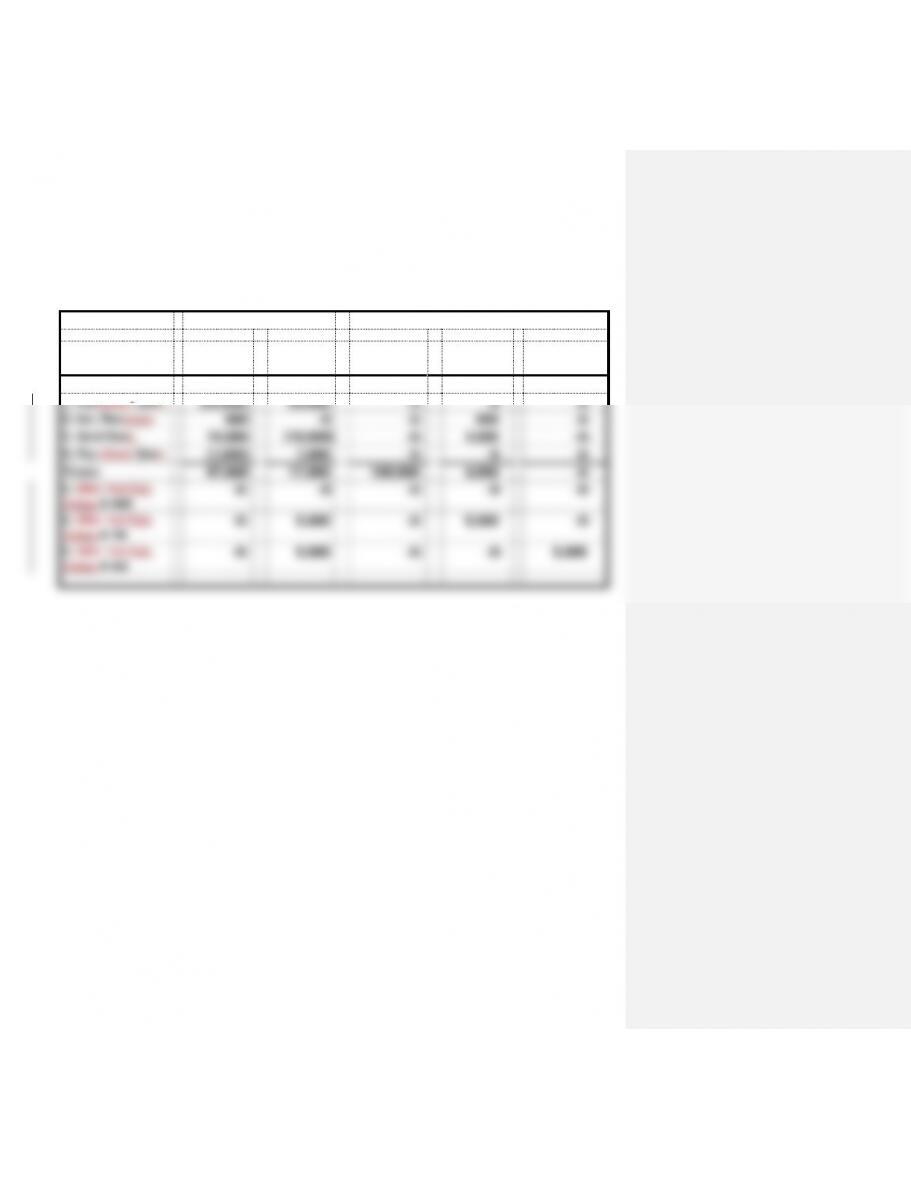
Balance Sheets
Assets
Cash
$ 87,600
$
8774,6200
$
8774,6200
Investment Securities
17,000
2241,000
2241,000
Total Assets
$104,600
$115,20010
9,600
$10915,62
00
Stockholders’ Equity
Common Stock
$100,000
$100,000
$100,000
Retained Earnings
4,600
9,600
4,600
Unrealized GainAccum. Other
Comp. Income
-0-
-0-
5,000
Total Stockholders’ Equity
$104,600
$109,600
$109,600
Statements of Cash Flows
Cash Flows From Operating Act.:
Inflow Receipts from Invest.
Revenue
$ 600
$ 600
$ 600
Paid to Outflow to Purchase
Securities
-0-
(27,000)
-0-
Receipts from Inflow from Sale of
Securities
-0-
14,000
-0-
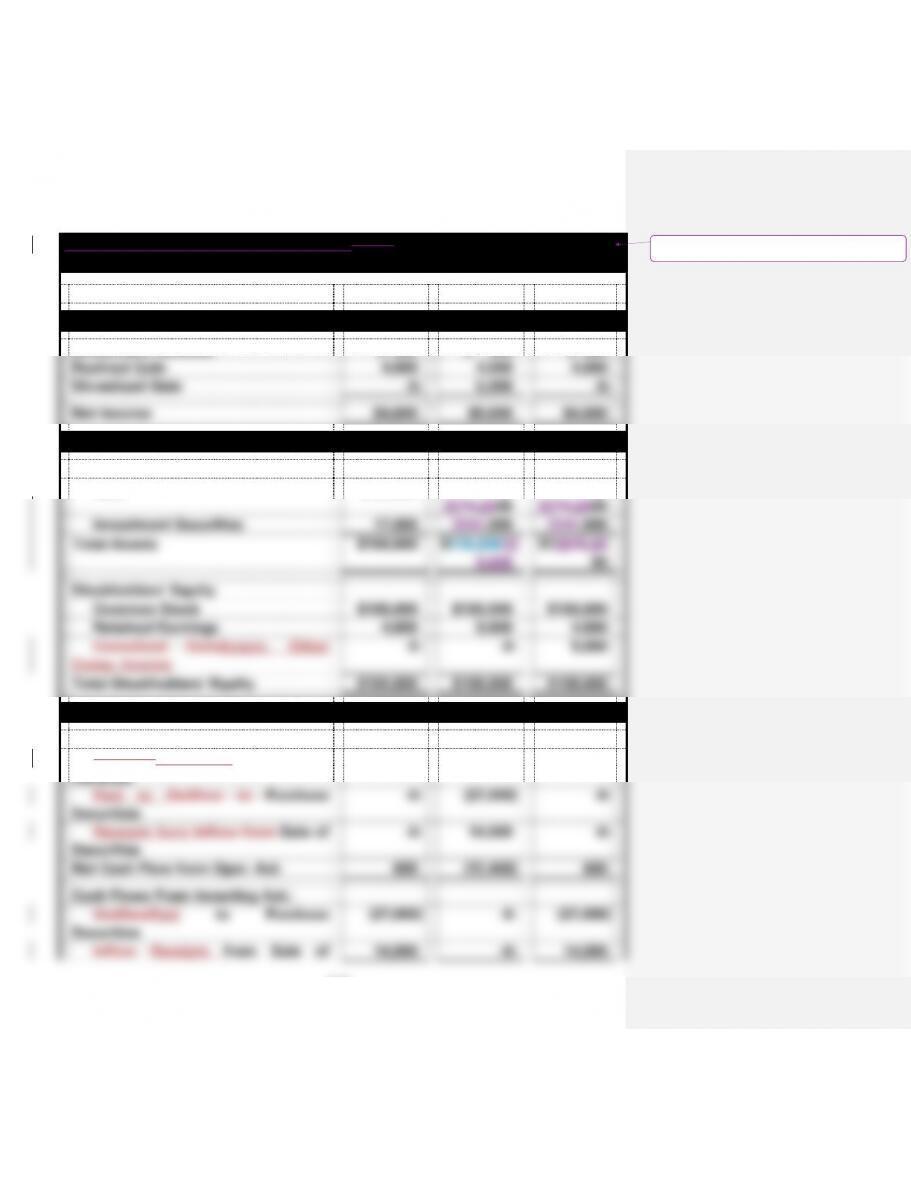
Net Cash Flow from Oper. Act.
600
(12,400)
600
Cash Flows From Investing Act.:
OutflowPaid to Purchase
Securities
(27,000)
-0-
(27,000)
Inflow Receipts from Sale of
14,000
-0-
14,000
Formatted: Left, Tab stops: 2.99″, Left + 3.5″,
Centered
E-8
Securities
Net Cash Flow from Investing Act.
(13,000)
-0-
(13,000)
Cash Flows From Financing Act.
-0-
-0-
-0-
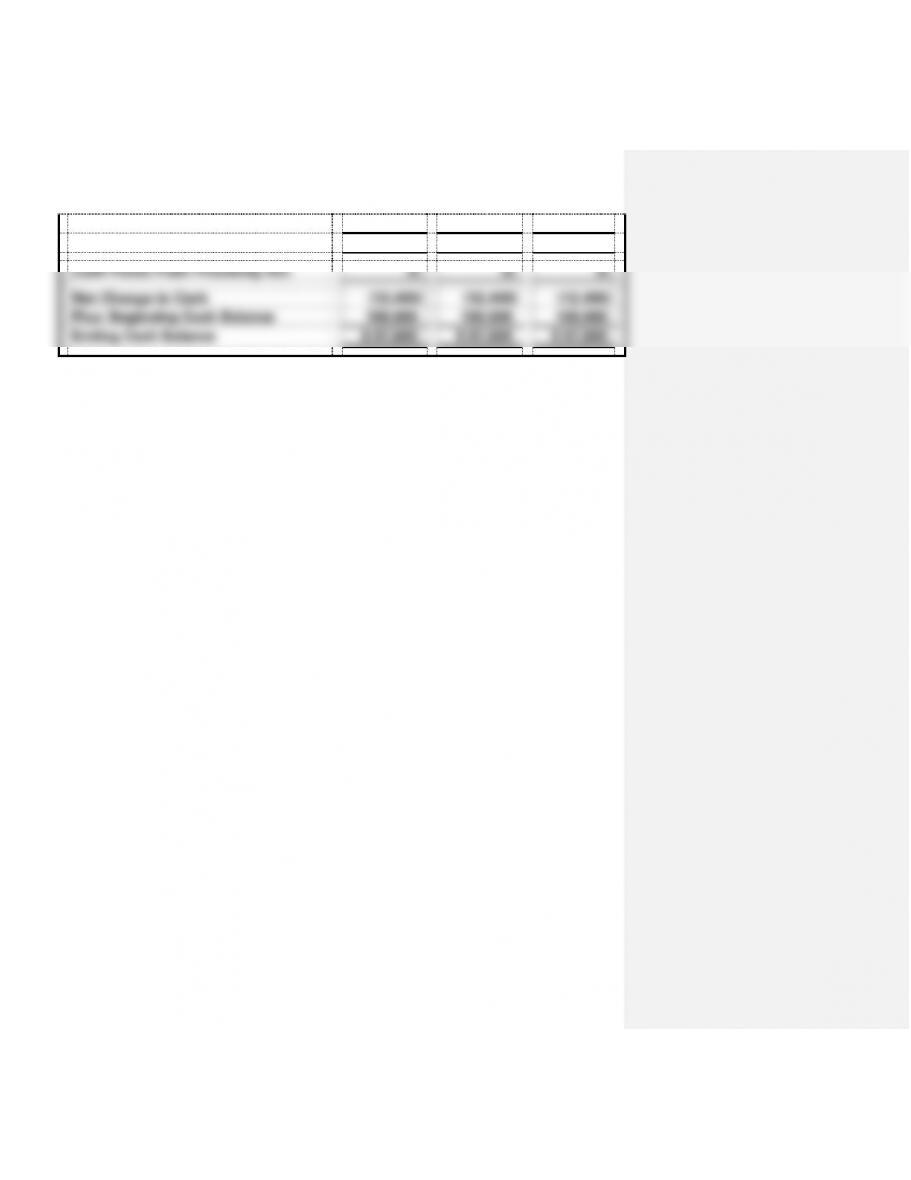
Net Change in Cash
(12,400)
(12,400)
(12,400)
Plus: Beginning Cash Balance
100,000
100,000
100,000
Ending Cash Balance
$ 87,600
$ 87,600
$ 87,600
E-9
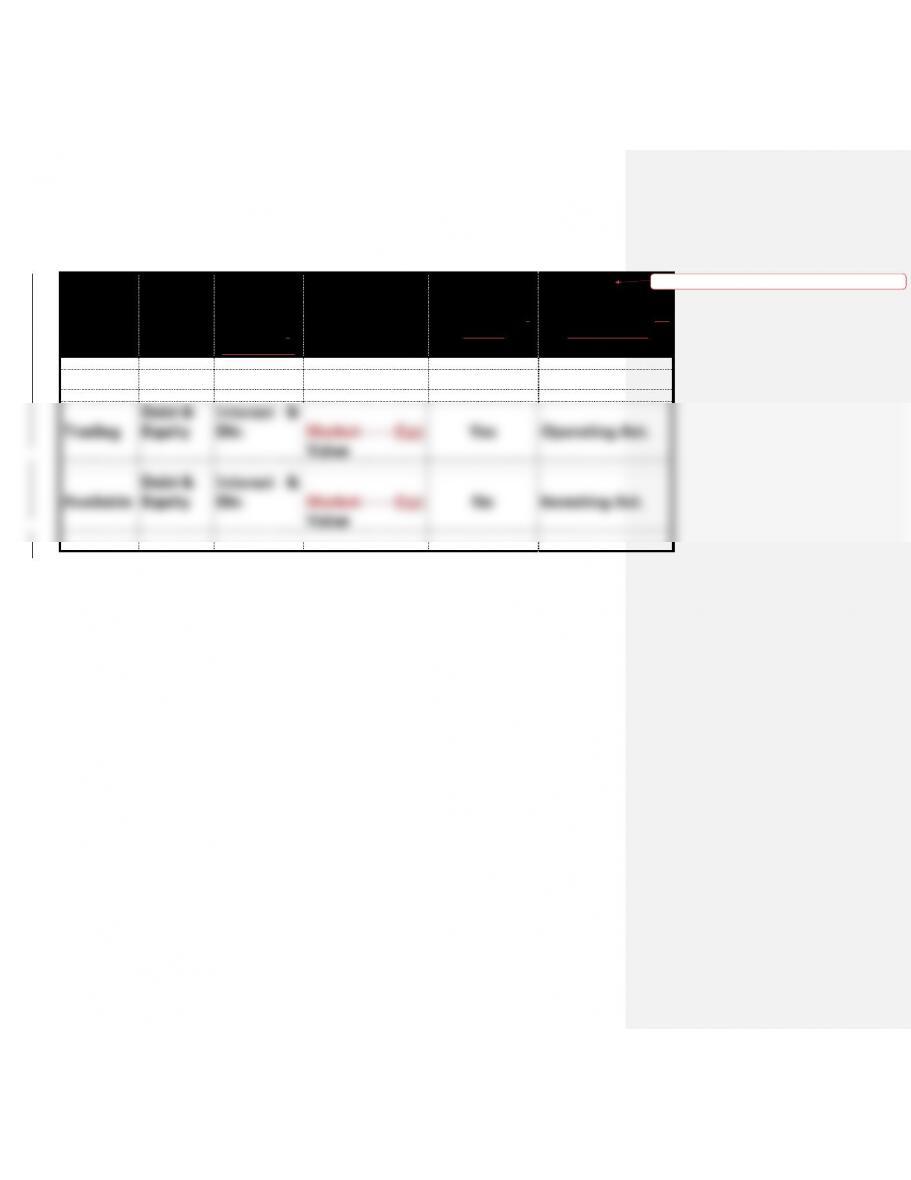
EXERCISE E5
Investmen
t Category
Types of
Securities
Types of
Revenue
Recognized
Value Reported
on Balance Sheet
Recognition of
Unrealized
Gains/Losses
on the
Income Stmt.
Cash Flow from
Purchase or Sale of
Securities is
Classified As
Held
Debt
Interest
Amortized Cost
No
Investing Act.
Trading
Debt &
Equity
Interest &
Div.
Market Fair
Value
Yes
Operating Act.
Available
Debt &
Equity
Interest &
Div.
Market Fair
Value
No
Investing Act.
Formatted Table
E-10
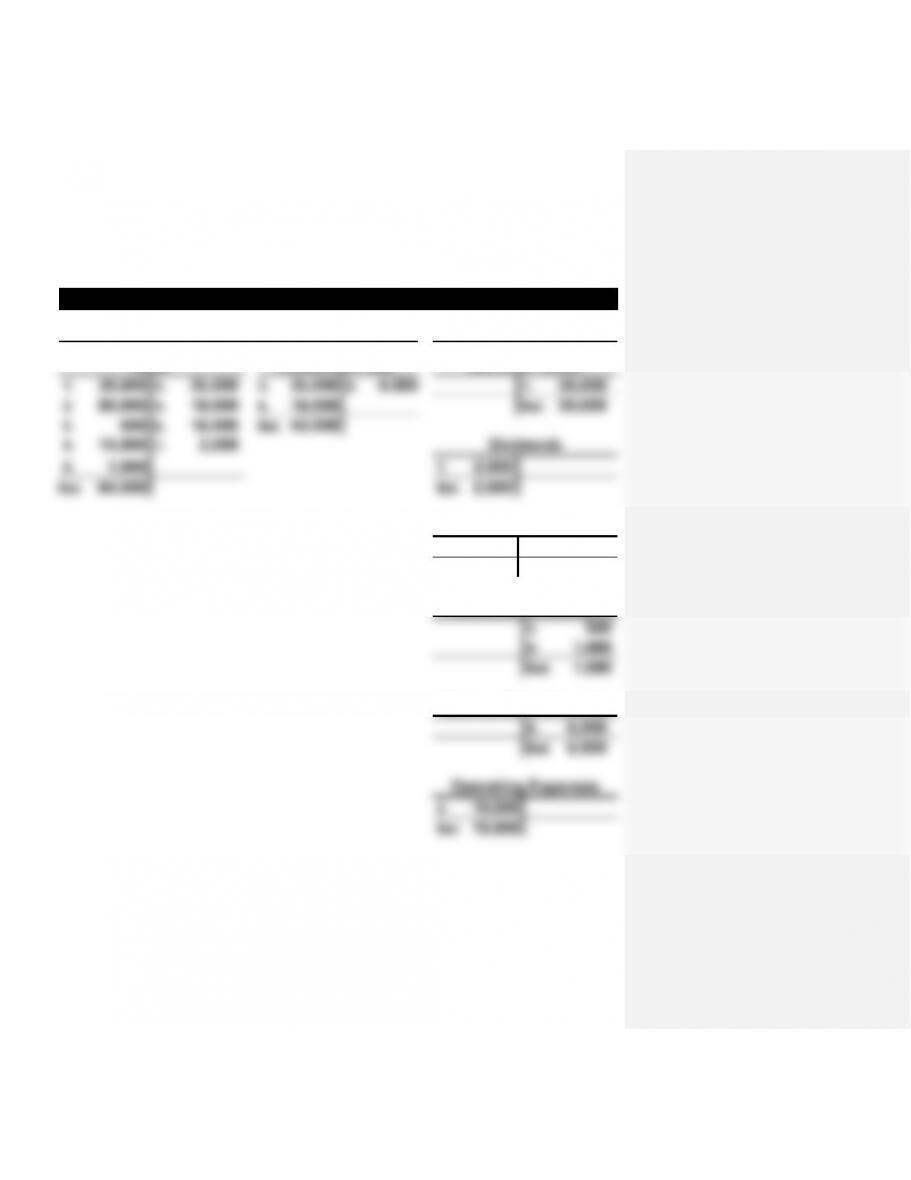
EXERCISE E6
(a) Held-to-Maturity
T-Accounts
Assets
=
Equity
Cash
Investment Sec.
Common Stock
1. 30,000
3. 35,000
3. 35,000
8. 8,000
1. 30,000
2. 90,000
4. 18,000
6. 16,000
Bal. 30,000
5. 500
6. 16,000
Bal. 43,000
8. 14,000
7. 2,000
Dividends
9. 1,000
7. 2,000
Bal. 64,500
Bal. 2,000
Service Revenue
2. 90,000
Bal. 90,000
Investment Income
5. 500
9. 1,000
Bal. 1,500
Gain on Sale of Invest.
8. 6,000
Bal. 6,000
Operating Expenses
4. 18,000
Bal. 18,000
E-11
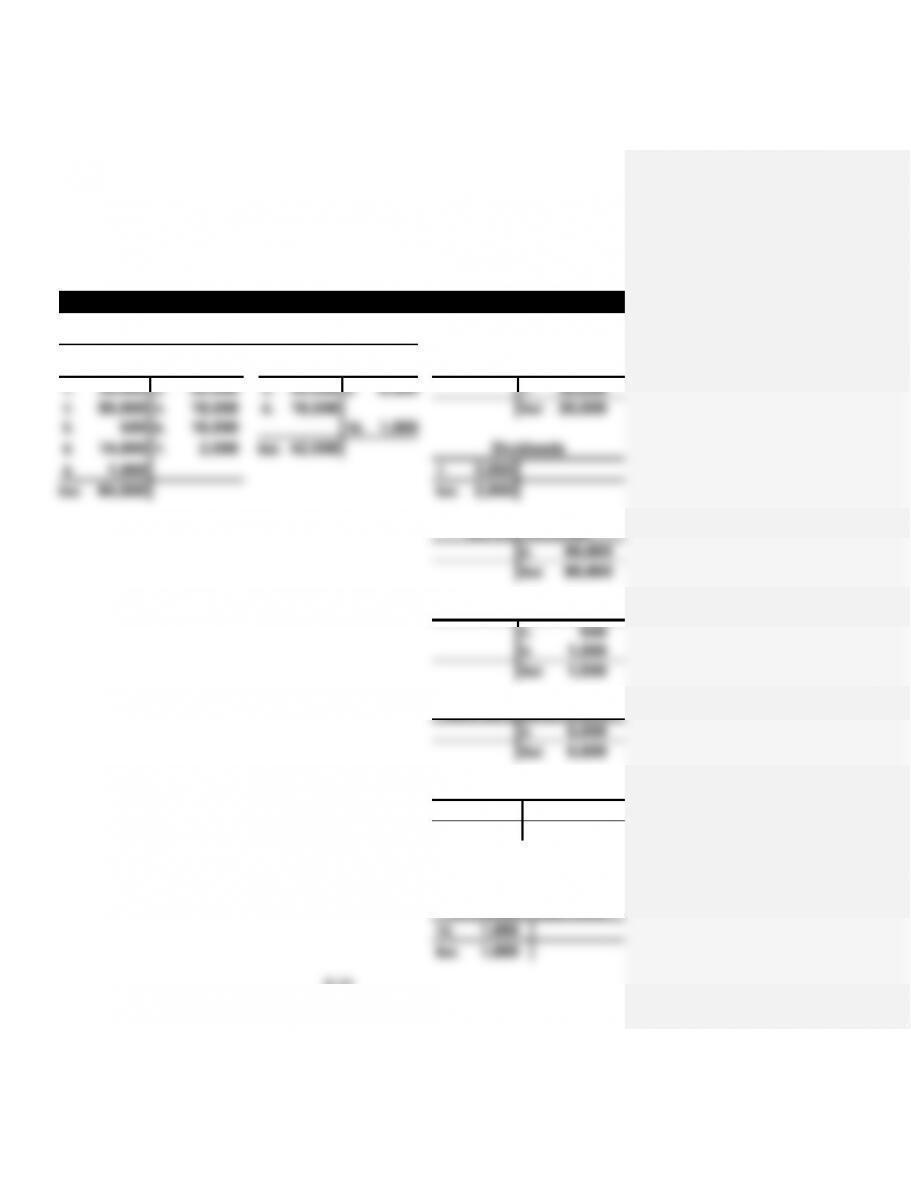
EXERCISE E6 (cont.)
(b) Trading
T-Accounts
Assets
=
Equity
Cash
Investment Sec.
Common Stock
1. 30,000
3. 35,000
3. 35,000
8. 8,000
1. 30,000
2. 90,000
4. 18,000
6. 16,000
Bal. 30,000
5. 500
6. 16,000
10. 1,000
8. 14,000
7. 2,000
Bal. 42,000
Dividends
9. 1,000
7. 2,000
Bal. 64,500
Bal. 2,000
Service Revenue
2. 90,000
Bal. 90,000
Investment Income
5. 500
9. 1,000
Bal. 1,500
Gain on Sale of Invest.
8. 6,000
Bal. 6,000
Operating Expenses
4. 18,000
Bal. 18,000
(Income Statement
Account)
Unrealized Gain/Loss
10. 1,000
Bal. 1,000

E-12
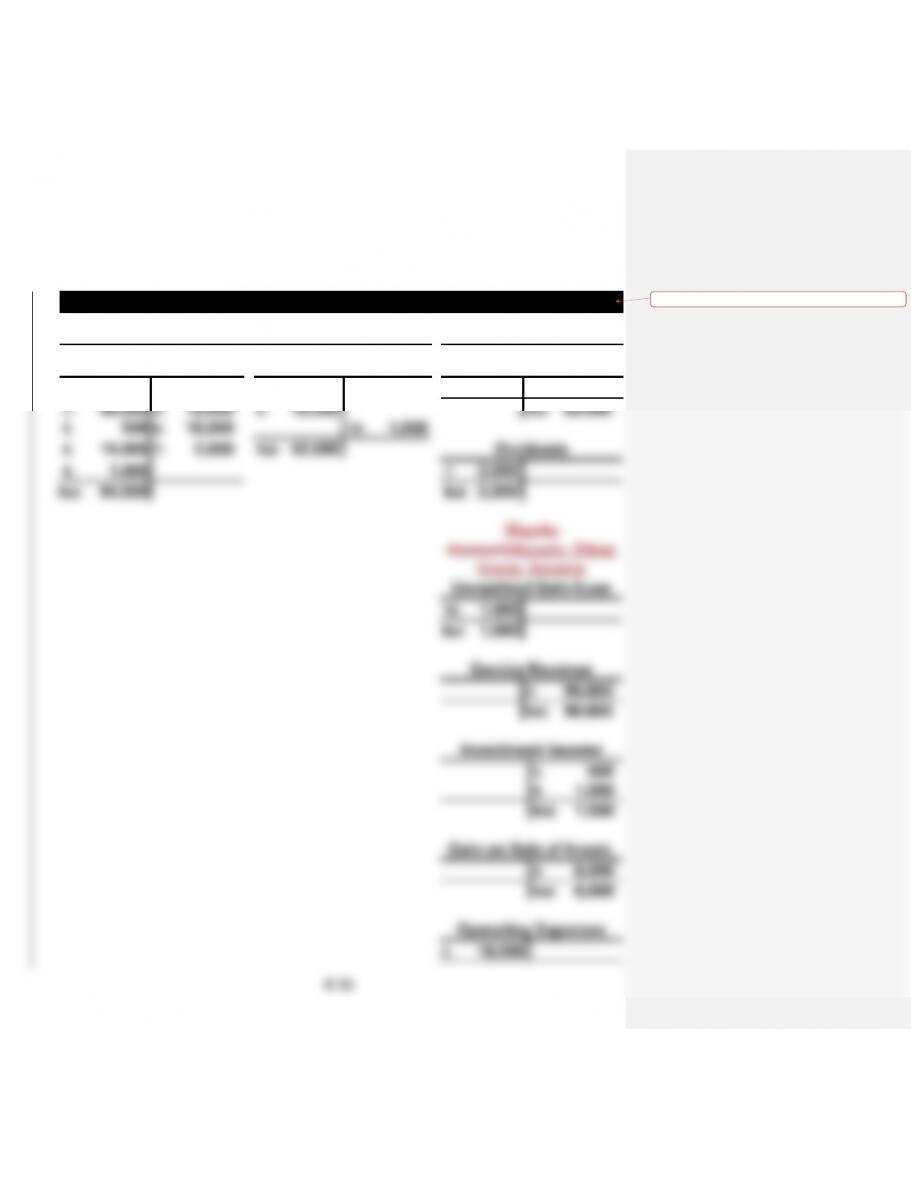
EXERCISE E6 (cont.)
(c) Available-for-Sale
T-Accounts
Assets
=
Equity
Cash
Investment Securities
Common Stock
1. 30,000
3. 35,000
3. 35,000
8. 8,000
1. 30,000
2. 90,000
4. 18,000
6. 16,000
Bal. 30,000
5. 500
6. 16,000
10. 1,000
8. 14,000
7. 2,000
Bal. 42,000
Dividends
9. 1,000
7. 2,000
Bal. 64,500
Bal. 2,000
(Equity
Account)Accum. Other
Comp. Income
Unrealized Gain/Loss
10. 1,000
Bal. 1,000
Service Revenue
2. 90,000
Bal. 90,000
Investment Income
5. 500
9. 1,000
Bal. 1,500
Gain on Sale of Invest.
8. 6,000
Bal. 6,000
Operating Expenses
4. 18,000
Formatted Table
E-14
Bal. 18,000
E-15
EXERCISE E6 a., b., & c. (cont.)
Harrison Imports
Comparative Financial Statements
Investment Securities Classified As
Held
Trading
Available
Income Statements
For the Year Ended 2013
Services Revenue
$90,000
$90,000
$90,000
Operating Expenses
(18,000)
(18,000)
(18,000)
Operating Income
72,000
72,000
72,000
Investment Income
1,500
1,500
1,500
Realized Gains
6,000
6,000
6,000
Unrealized Gains (Losses)
-0-
(1,000)
-0-
Net Income
$79,500
$7880,500
$79,500
Balance Sheets
As of December 31, 2016
Assets
Cash
$ 64,500
$64,500
$ 64,500
Investment Securities @ Cost
43,000
-0-
-0-
Investment Securities @
MarketFair Value
-0-
42,000
42,000
Total Assets
$107,500
$106,500
$106,500
Stockholders’ Equity
Common Stock
$ 30,000
$ 30,000
$30,000
Retained Earnings*
77,500
76,500
77,500
Unrealized LossAccum. Other
Comp. Income
-0-
-0-
(1,000)
Total Stockholders’ Equity
$107,500
$106,500
$106,500
Formatted Table
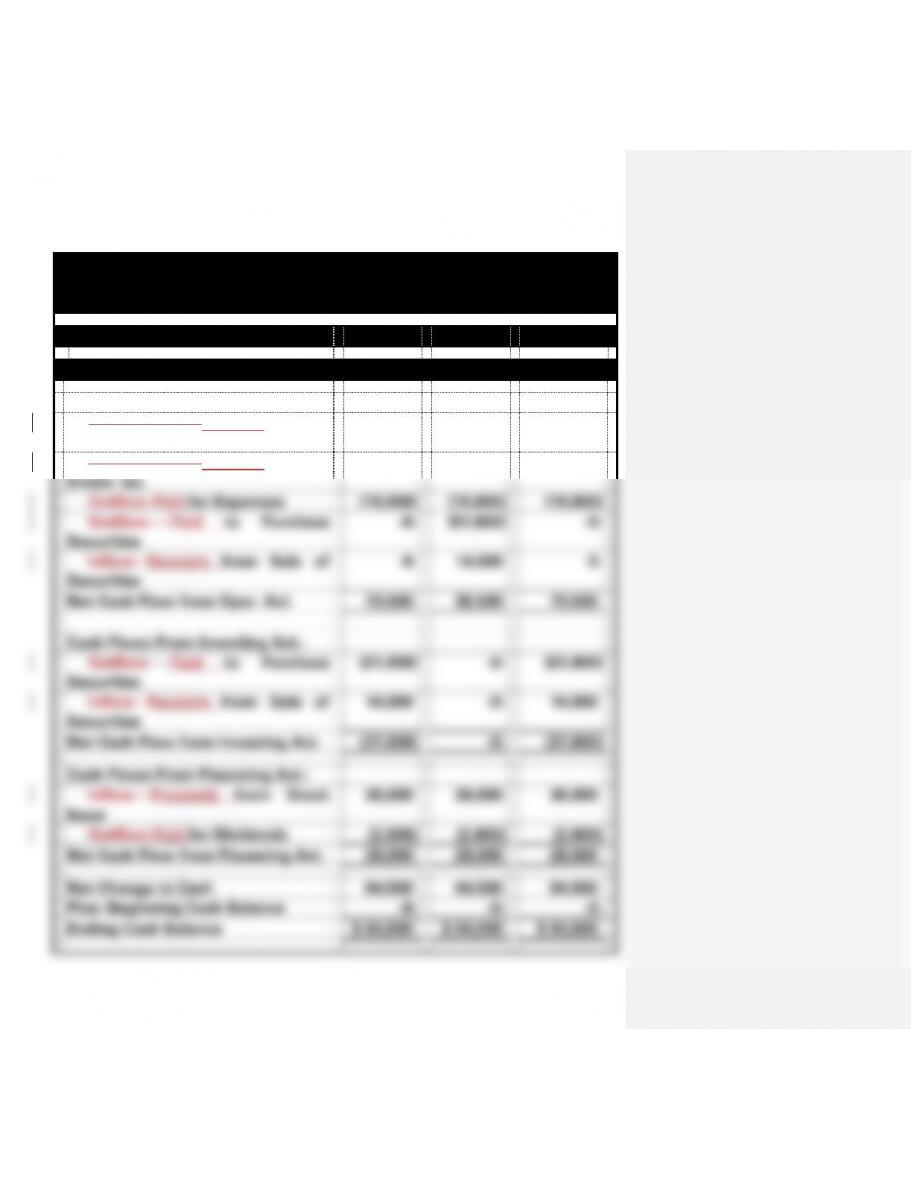
E-16
EXERCISE 6 a., b., & c. (cont.)
Harrison Imports
Comparative Financial Statements
For the Year Ended 2016
Investment Securities Classified as
Held
Trading
Available
Statements of Cash Flows
Cash Flows From Operating Act.:
Cash InflowReceipts from
Customers
$ 90,000
$ 90,000
$ 90,000
Cash InflowReceipts from
Invest. Inc.
1,500
1,500
1,500
Outflow Paid for Expenses
(18,000)
(18,000)
(18,000)
Outflow Paid to Purchase
Securities
-0-
(51,000)
-0-
Inflow Receipts from Sale of
Securities
-0-
14,000
-0-
Net Cash Flow from Oper. Act.
73,500
36,500
73,500
Cash Flows From Investing Act.:
Outflow Paid to Purchase
Securities
(51,000)
-0-
(51,000)
Inflow Receipts from Sale of
Securities
14,000
-0-
14,000
Net Cash Flow from Investing Act.
(37,000)
-0-
(37,000)
Cash Flows From Financing Act.:
Inflow Proceeds from Stock
Issue
30,000
30,000
30,000
Outflow Paid for Dividends
(2,000)
(2,000)
(2,000)
Net Cash Flow from Financing Act.
28,000
28,000
28,000
Net Change in Cash
64,500
64,500
64,500
Plus: Beginning Cash Balance
-0-
-0-
-0-
Ending Cash Balance
$ 64,500
$ 64,500
$ 64,500

E-17
E-18
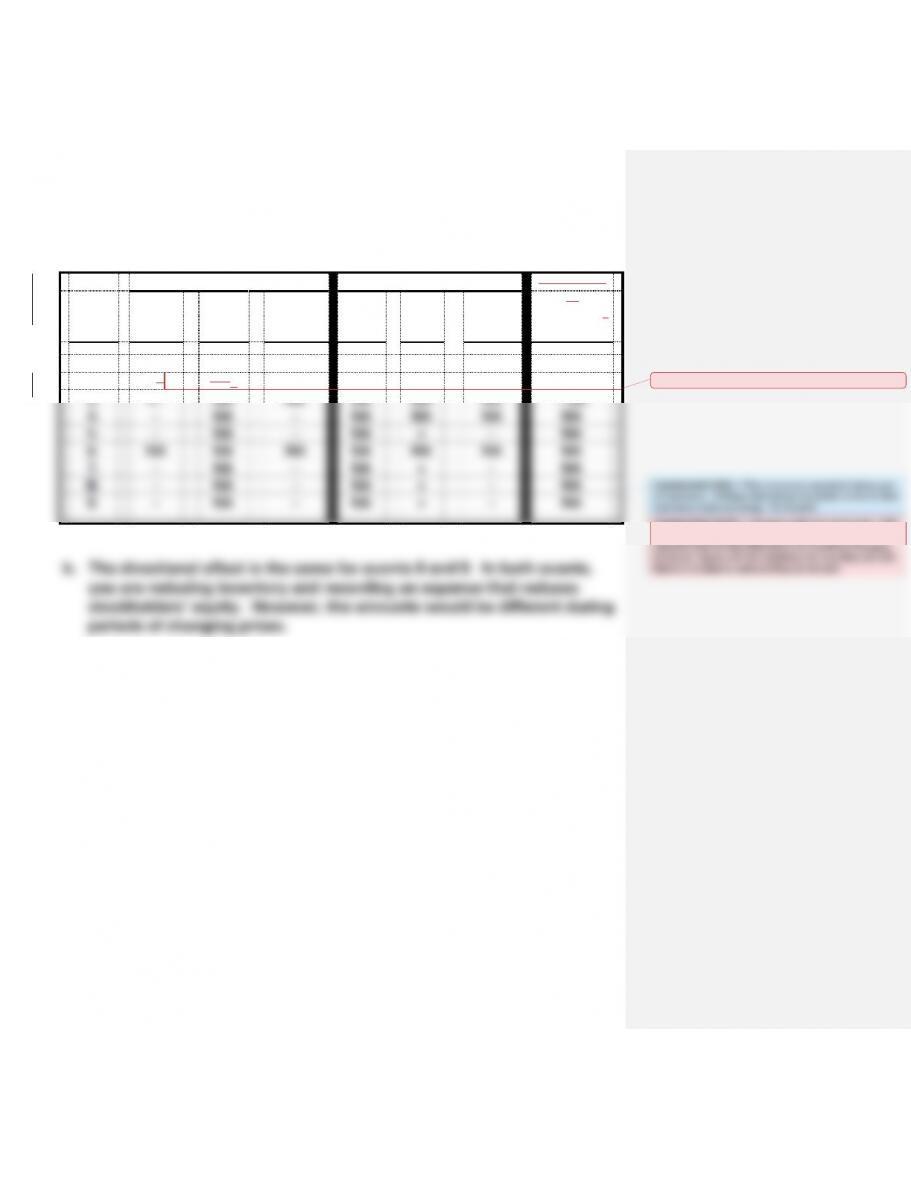
EXERCISE E7
a.
Balance Sheet
Income Statement
Statement
Event
Assets
=
Liab.
+
S.
Equity
Rev./
Gain
−
Exp./
Loss
=
Net Inc.
of
Cash Flows
1.
+
NA
+
NA
NA
NA
+ FA
2.
+−
NA+
NA
NA
NA
NA
NA
3.
+−
NA
NA
NA
NA
NA
− OA
4.
–
NA
–
NA
NA
NA
NA
5.
–
NA
–
NA
+
–
NA
6.
NA
NA
NA
NA
NA
NA
NA
7.
−
NA
−
NA
+
−
NA
8.
−
NA
−
NA
+
−
NA
9.
−
NA
−
NA
+
−
NA
there is no need to add anything to the text
Commented [ILP4]: Purch inventory on account
Commented [D5]: ? This is true in a period of rising cost
of inventory. Perhaps that should be stated in the ex that
inventory costs are rising. For 8 and 9
Commented [ILP6]: I disagree with that comment. CGS
will reduce net income no matter what. The next
question asks for the difference and mentions changing