Appendix D – Target Annual Report Solutions
1
Appendix D: 2013 Target Annual Report Solutions
Management’s Discussion and Analysis
1. U.S. and Canadian
2. Significant Risk Factors include:
a. If Target is unable to positively differentiate itself from other retailers, its results of
operations could be adversely affected.
b. Target’s continued success is substantially dependent on positive perceptions of Target,
including its owned and exclusive brands.
could be adversely affected.
h. Interruptions with its vendors and within its supply chain could adversely affect its
results.
i. Failure to address product safety concerns could adversely affect its sales and results of
operations.
j. Interruptions in its supply chain or increased commodity prices and supply chain costs
2
p. If Target fails to differentiate the Target experience and appeal to its new Canadian
guests, its financial results could be adversely affected.
q. A disruption in relationships with 3rd parties who provide services in connections with
certain aspects of its business could adversely affect operations.
r. The impact and cost of the 2013 4th quarter data security breach has not been fully
3. New York Stock Exchange and TGT.
4. Target experienced a data breach in which an intruder stole certain payment card and other
guest information from its network from approximately 40 million credit and debit card
accounts between the period November 27 and December 15. Once aware of the breach,
5. The decline in U.S. Sales in 2013 reflects the impact of an additional week in 2012 (53 weeks
instead of 52) and a decline in comparable sales. (Comparable –store sales is a measure that
6. The $6,520 million of Cash Flow provided by Operations allowed Target to pay current debt
maturities, invest in the business, pay dividends and repurchase shares under its repurchase
program.
7. Ernst and Young, LLP
4
16. Net Earnings/Sales: 2013: 2.7% ($1,971/$72,956) 2012: 4.2% ($2,999/$71,960) 2011: 4.3%
34.3% in 2013. (See horizontal analysis required for item #17.)
17. See Excel file.
18. Between 2013 and 2012: Change in Sales: $636 increase ($72,596 – $71,960)
19. The trend in revenue is an overall solid increase – with only a modest increase from 2012 to
2013. The reduced growth in sales in 2013 can be attributed to the drop in 4th quarter sales due
20. Between 2013 and 2012: Change in Cost of Sales: $592 increase ($51,160 – $50,568))
21. The trend in cost of sales if fairly consistent with revenue: an overall solid increase – with only a
22. Between 2013 and 2012: Change in SG&A Exp: $461 ($15,375 – $14,914)
23. Selling, general and administrative expenses markedly increased in 2012 by 5.7% (close to the
(3.1%) although sales only grew by .9%. Target was not as efficient controlling its SGA expense
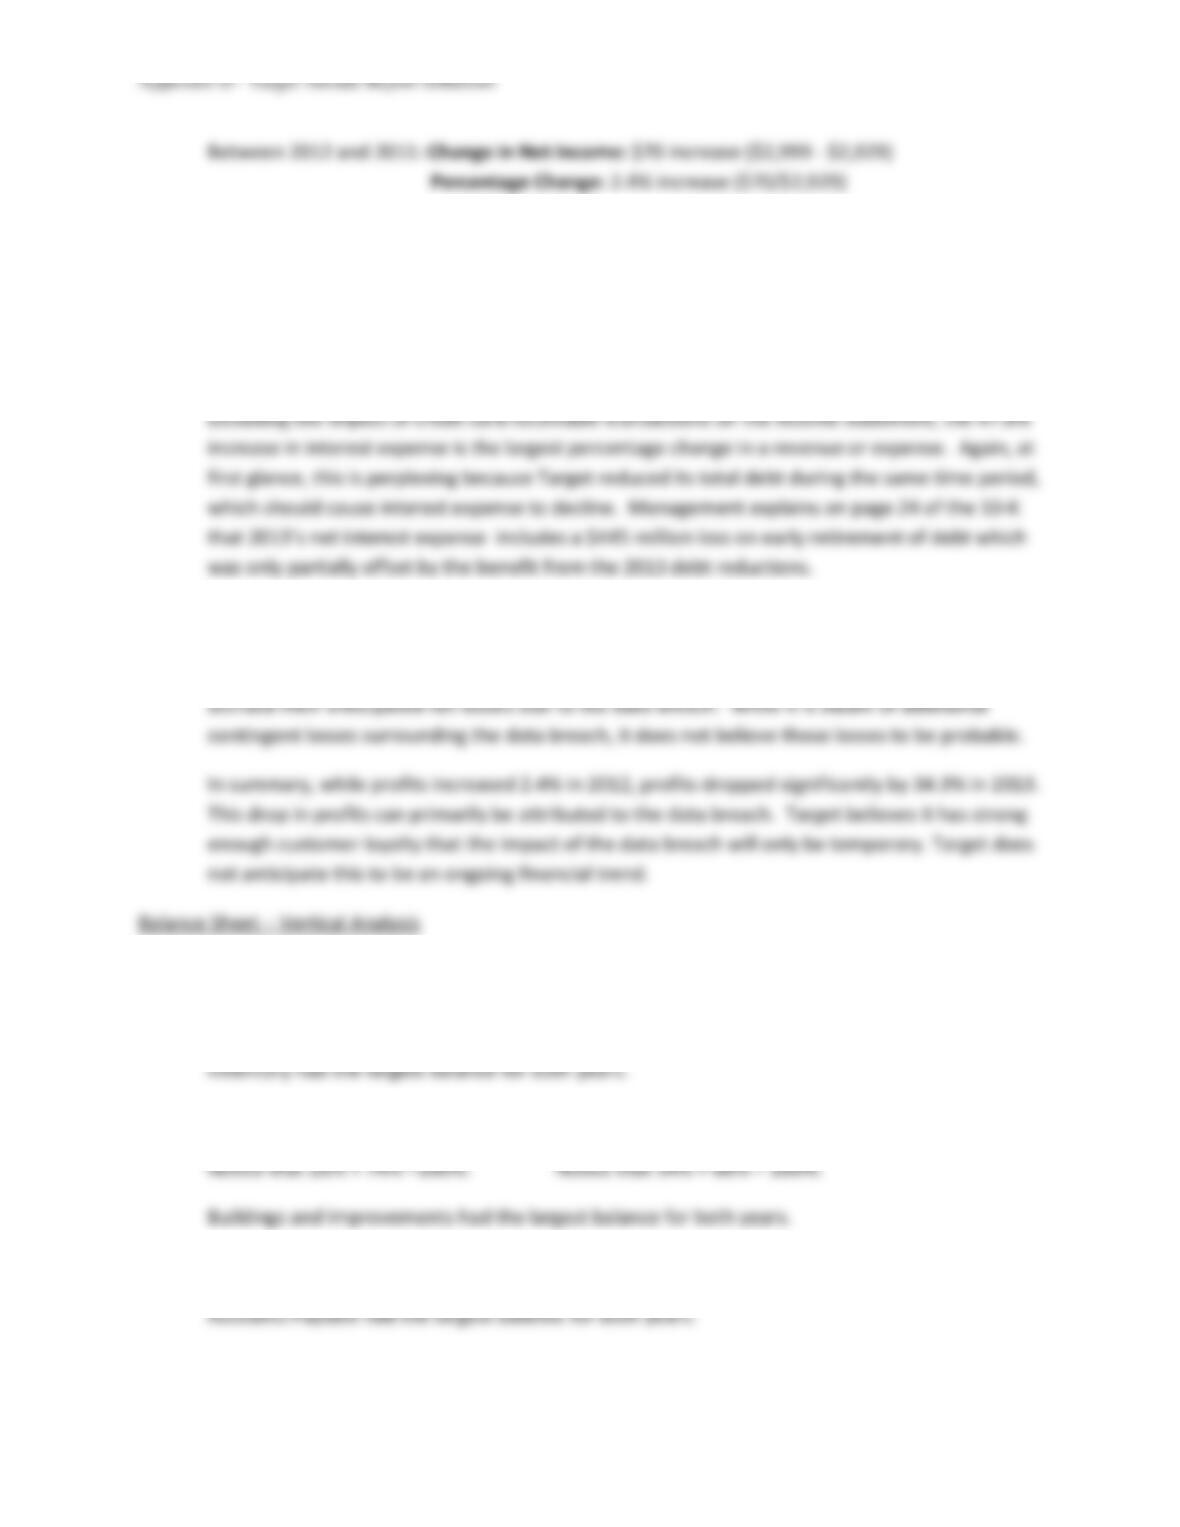
24. Between 2013 and 2012: Change in Net Income: $1,028 decrease ($1,971 – $2, 999)
Percentage Change: 34.3% decrease ($1,028/$2,999)
5
25. Net income moderately increased from 2011 to 2012 (2.4%), but dropped drastically in 2013 (–
34.3%).
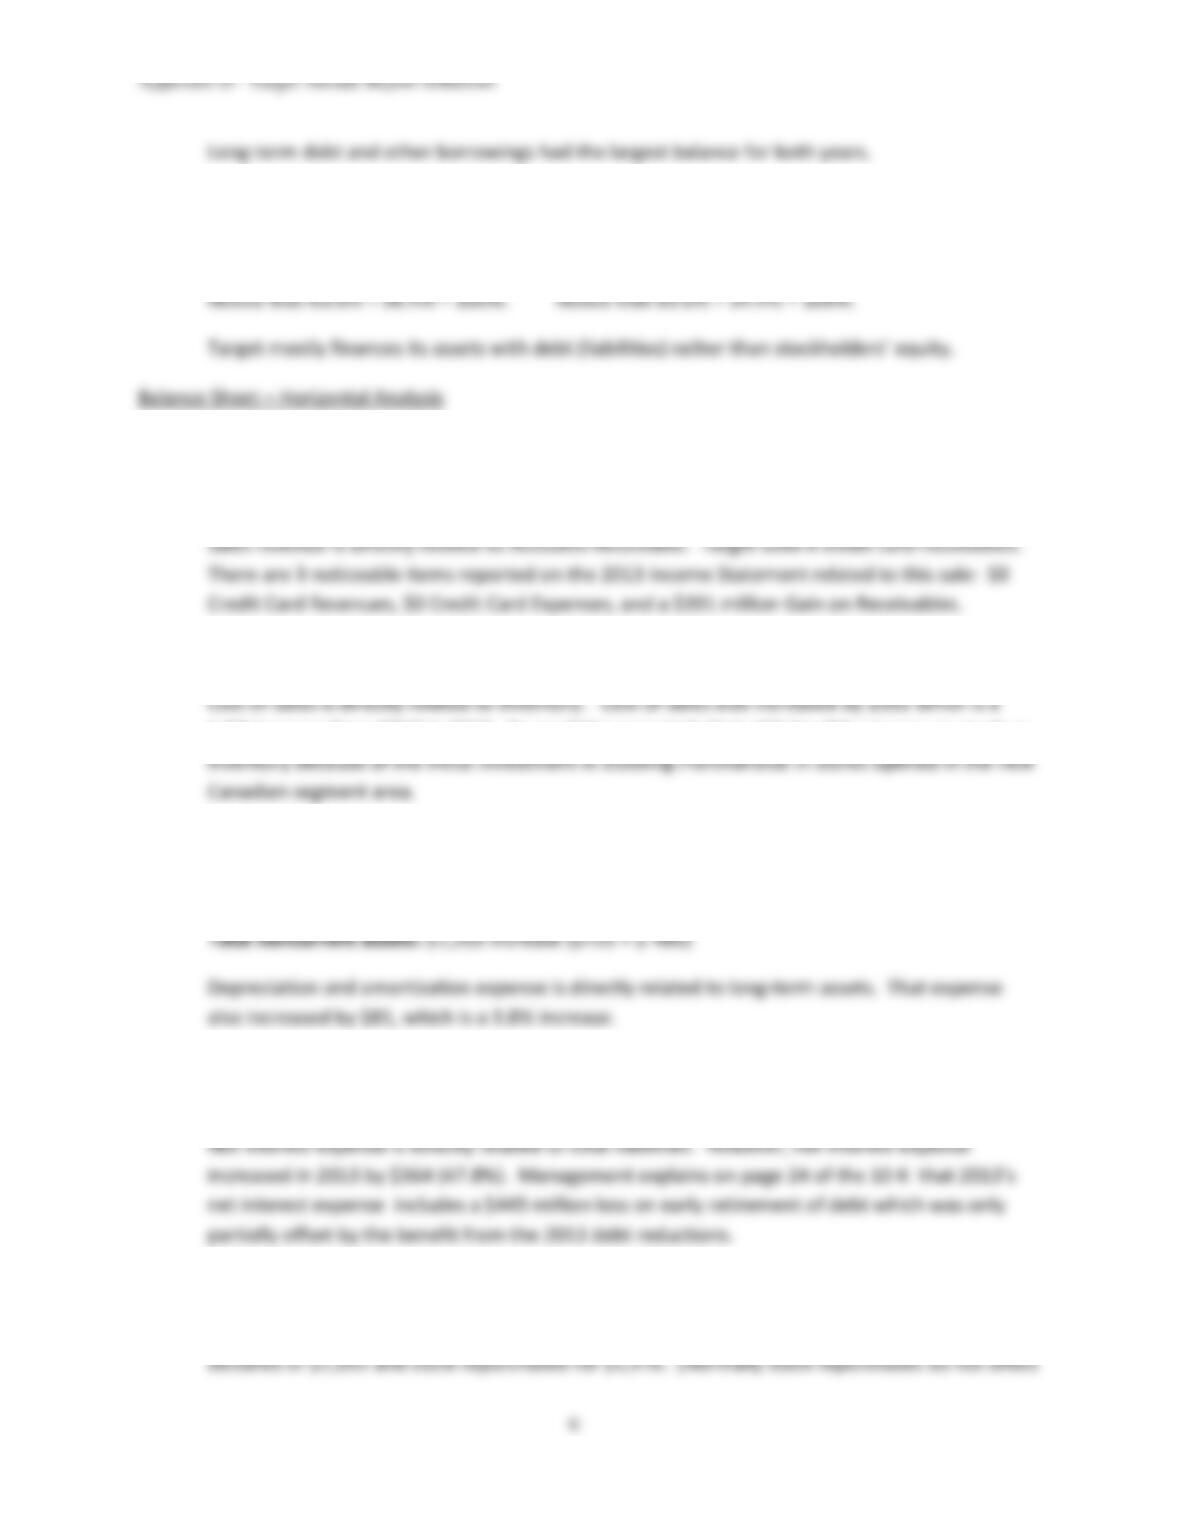
26. Because Target solid its credit card receivables the largest “percentage” changes on the income
statement are connected to that: credit card expenses, credit card revenues, and gain on
receivables transaction.
27. Target had a challenging financial position in 2013 because of the data breach that occurred
during the 4th quarter. The data breach had double negative impact: Sales declined because of
customer fear of privacy exposure coupled with an increase in SGA expenses. Target has
28. See Excel.
29. 2013: 26% ($11,573/$44,553) 2012: 34% ($16,388/$48,163)
30. 2013: 74% ($31,378+1,602)/$44,553 2012: 66% ($30,653+1,122)/$48,163)
31. 2013: 28.7% ($12,777/$44,553) 2012: 29.1% ($14,031/$48,163)
32. 2013: 34.9% ($15,545/$44,553) 2012: 36.5% ($17,574/$48,163)
6
33. 2013: 63.6% ($28,322/$44,553) 2012: 65.6% ($31,605/$48,163)
34. 2013: 36.4% ($16,231/$44,553) 2012: 34.4% (16,558/$48,163)
35. See Excel.
36. Change in Credit Card Receivables: $5,841 decrease ($5,841-$0); 100% decrease
37. Change in Inventories: $863 increase ($8,766-$7,903); 10.9% increase ($863/$7,903)
1.2% increase from 2012 to 2013. As would be expected, Cost of Sales did not grow as much as
38. PPE: $725 increase ($31,378 – $30,653) which is a 2.4% increase
Other noncurrent assets: $480 increase ($1,602-$1,122) which is a 42.8% increase
39. Change in total liabilities: $3,283 decrease ($28,322 – $31,605); 10.4% decrease
($3,283/$31,605)
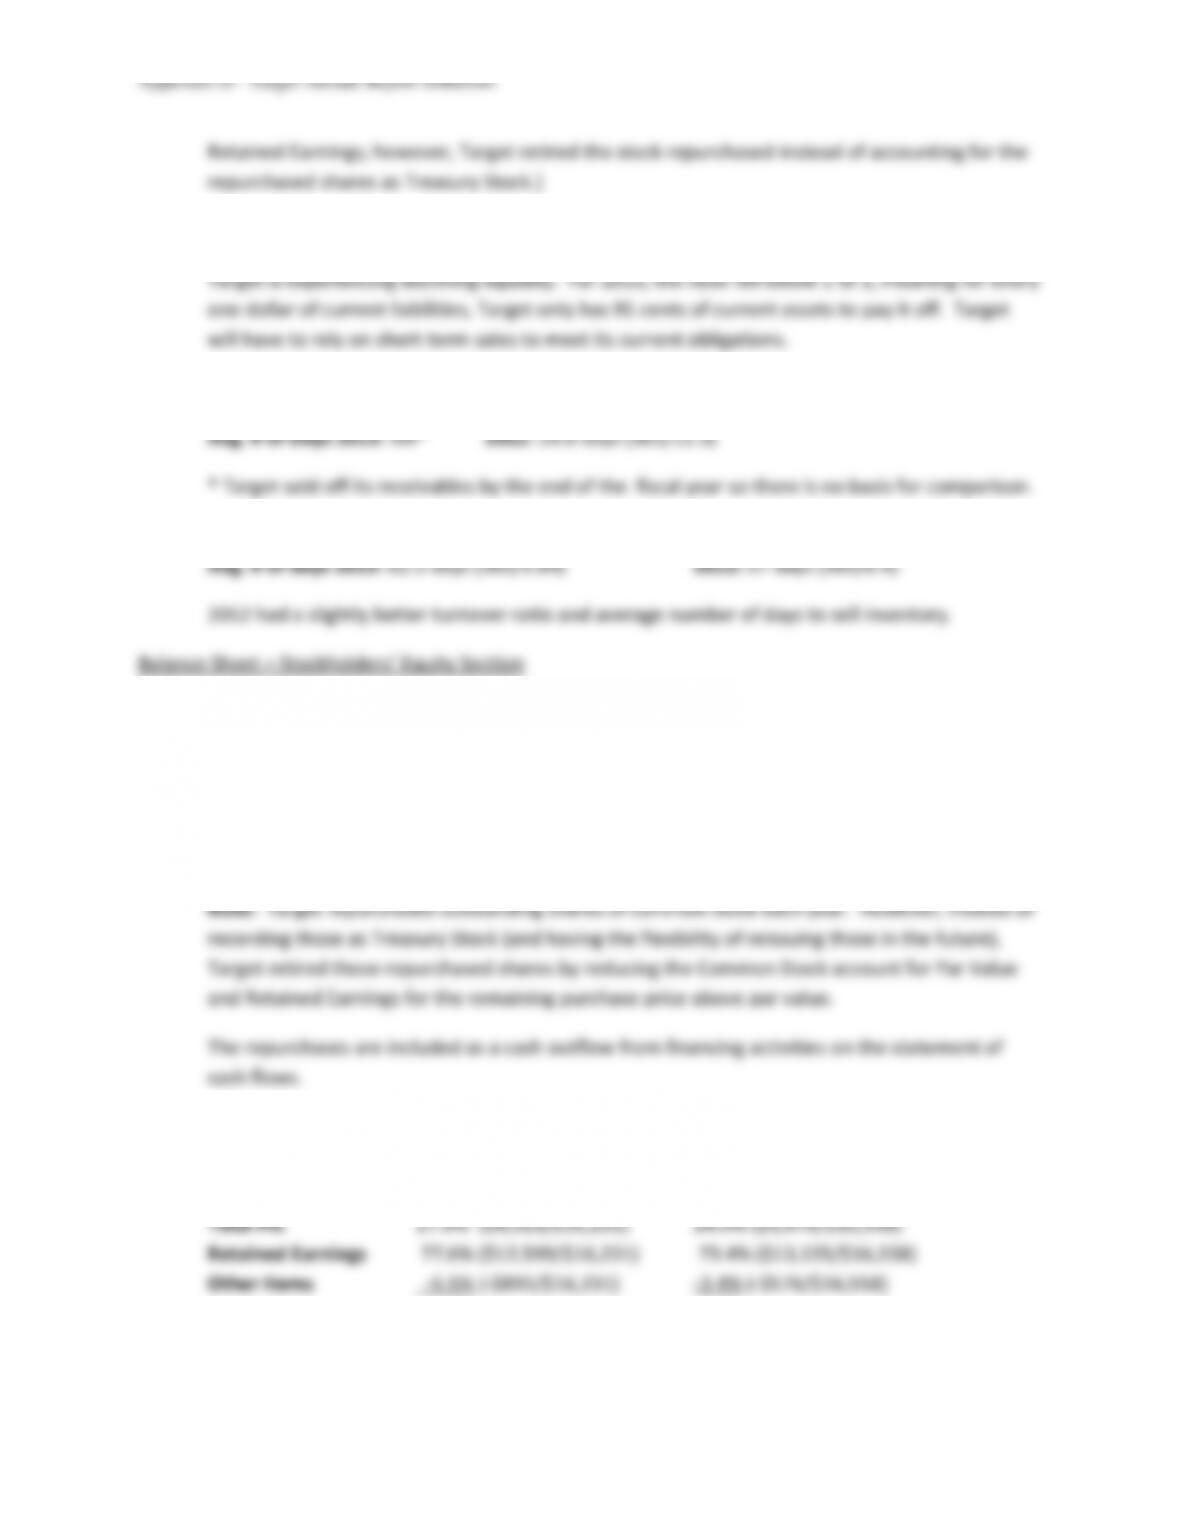
40. Change in Retained Earnings: $556 decrease ($12,599-$13,155); 4.2% decrease ($556/$13,155)
Beginning Retained Earnings balance of $13,155 plus Net income of $1,971 less dividends
7
41. 2013: .91 ($11,573/$12,777) 2012: 1.17 ($16,388/$14,031)
42. A/R Turnover 2013: Not applicable * 2012: 12.3 ($71,960/$5,841)
43. Inventory Turnover 2013: 5.84 ($51,160/$8,766) 2012: 6.4 ($50,568/$7,903)
44. Yes – $0.0833 par value per share
45. 2-1-2014: 632,930,740 shares 2-2-2013: 645,294,423
46. 2-1-2014: 0 treasury shares held 2-2-2013: 0 treasury shares held
2013: 21,900,000 shares repurchased 2012: 32,300,000 shares repurchased
47. Percentage of Stockholder’s Equity
2-1-2014 2-2-2013
Total 100.0% 100.0%
8
48. Indirect method – They begin with Net earnings and make adjustments for noncash items to
49. 2013: $89 decrease 2012: $10 decrease 2011: $918 decrease
50. Yes, a cash balance of $695 is shown on both 2013 statements and $784 is shown on both 2011
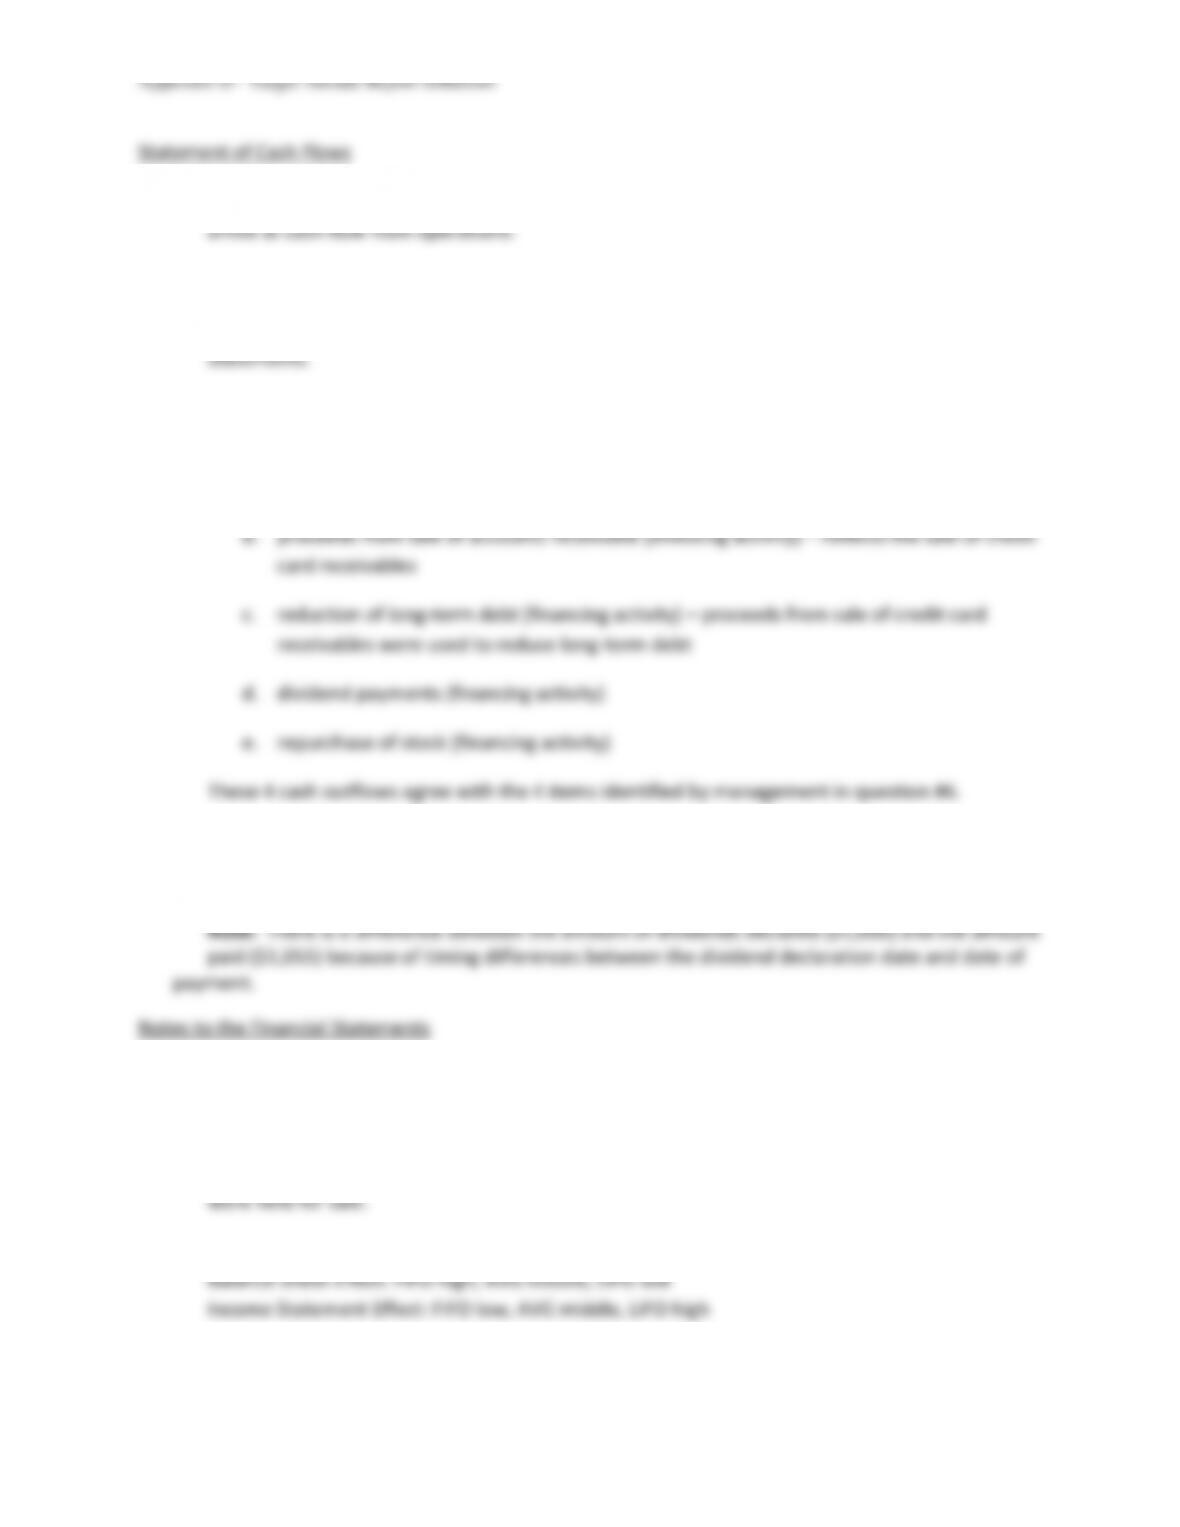
51. Five largest cash flows:
a. expenditures for property and equipment (investing activity) – reflects the store
expansion in Canada
52. Statement of Cash Flows – Target paid $1,006 in dividends during 2013, and
Statement of Stockholders Equity – Target declared $1,051 in dividends during 2013.
53. NOTE 1 – Organization, Consolidation, Use of estimates, and Fiscal year
54. NOTE 6 – Zero
55. Note 6 – Credit card receivables were reported at the lower of cost or fair value because they
56. Balance Sheet – Inventory; Income Statement – Cost of Sales
57. NOTE 10 – LIFO inventory cost method, stated at lower of LIFO cost or market
9
58. NOTE 12 – Buildings and improvements: 8-39 years; Fixtures and equipment: 2-15 years;
59. Balance Sheet – Accumulated Depreciation; Income Statement – Depreciation Expense
60. NOTE 12 – Straight-line depreciation method
61. NOTE 14 – Goodwill increased to $151 on 2-1-2014 from $59 on 2-2-2013. Target would
62. NOTE 14 – In addition to Goodwill, Target has Leasehold Acquisition Costs and Other Costs as a
63. NOTE 16 – Wages and benefits, Taxes payable, Gift card liability, Dividends payable, Project
64. NOTE 17 – Data breach, Purchase obligation, trade letters of credit, and claims and litigation
65. NOTE 18 – $2.5 billion which originated in 2011, amended in 2013, and expires in 2018. No
66. NOTE 18 – Total long-term debt at Feb. 1, 2014 (less amounts due within one year) was $12,622
million. These obligations are substantially are senior, unsecured obligations.
67. 2013: 4.4% ($1,971/$44,553) 2012: 6.2% ($2,999/$48,163)
68. 2013: 12.1% ($1,971/$16,231) 2012: 18.1% ($2,999/$16,558)
69. Yes, the ROE for 2013 was greater than ROA. Assets are larger than equity because most of the
assets are financed through debt agreements. This, in turn, causes the denominator in ROA to
70. 2013: $3.10 per share 2012: $4.57 per share
10