Exercise 9-11 (30 minutes)
1.
Net operating income
Margin = Sales
$70,000
= = 5%
$1,400,000
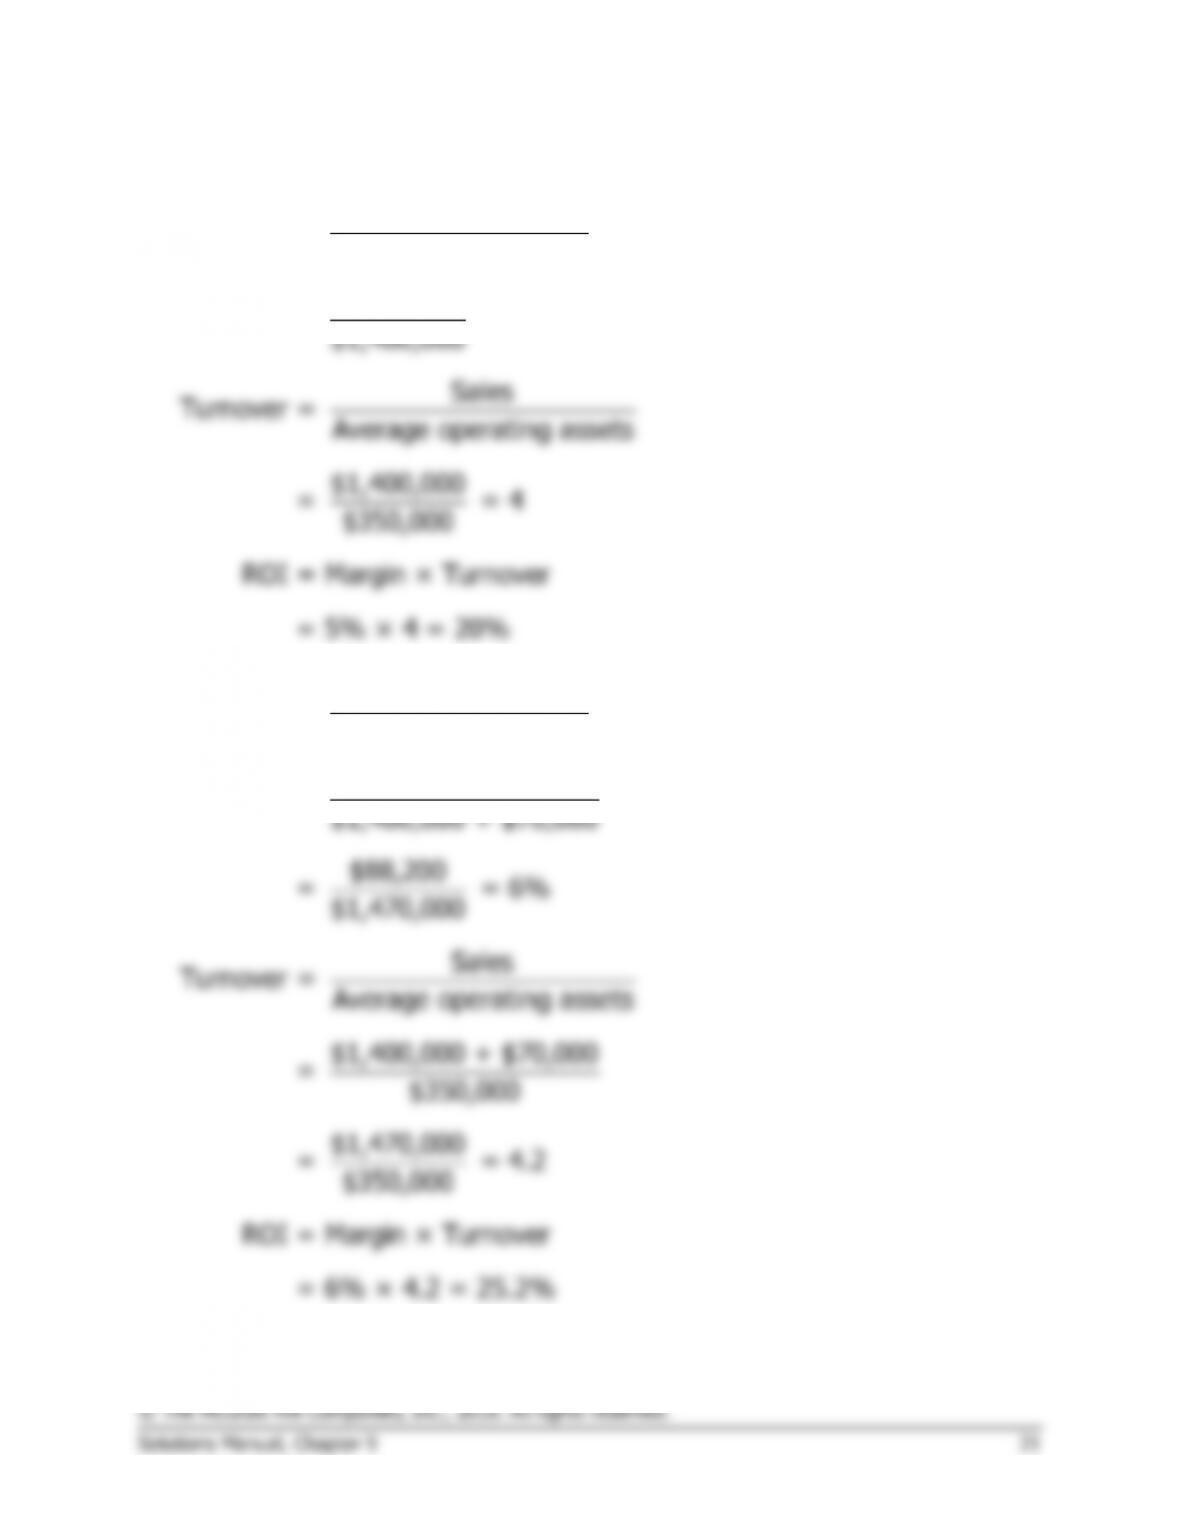
Sales
Turnover = Average operating assets
$1,400,000
= = 4
$350,000
ROI = Margin × Turnover
= 5% × 4 = 20%
2.
Net operating income
Margin = Sales
$70,000 + $18,200
=
$1,400,000 + $70,000
$88,200
= = 6%
$1,470,000
Sales
Turnover = Average operating assets
Exercise 9-11 (continued)
3.
Net operating income
Margin = Sales
$70,000 + $14,000
=
$1,400,000
$84,000
= = 6%
$1,400,000
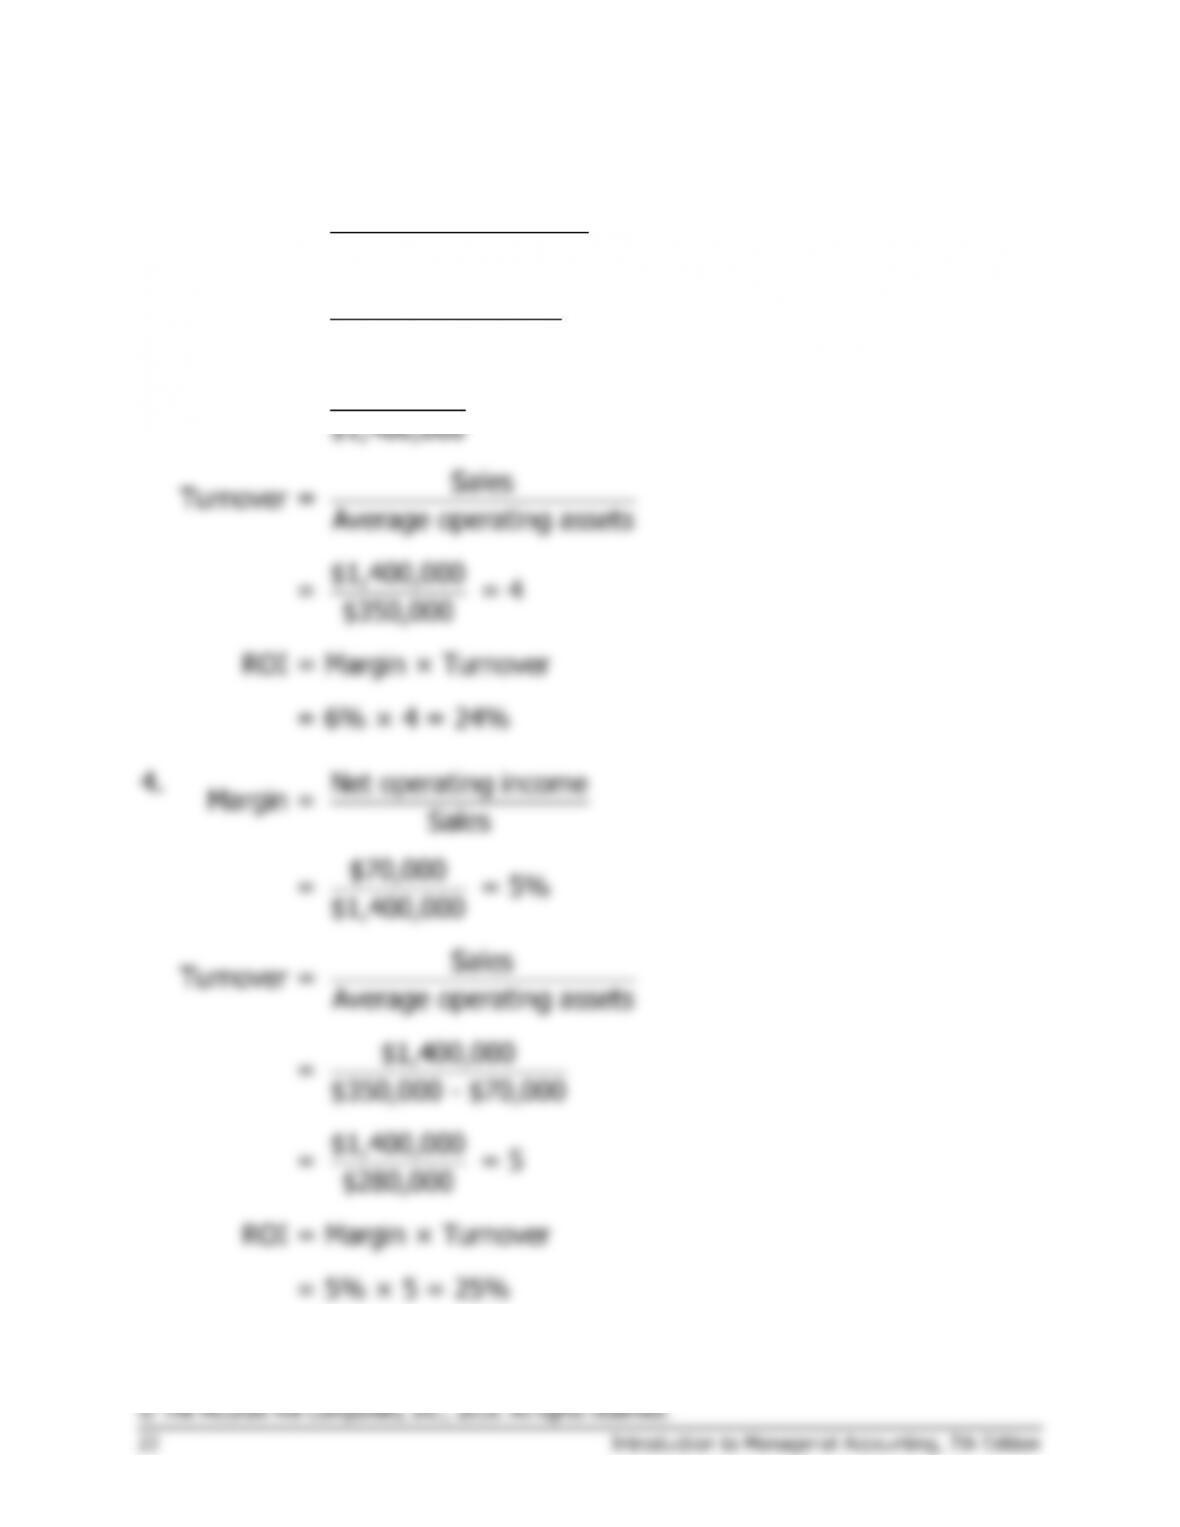
Sales
Turnover = Average operating assets
$1,400,000
= = 4
$350,000
ROI = Margin × Turnover
= 6% × 4 = 24%
4.
Net operating income
Margin =
Sales
$70,000
= = 5%
$1,400,000
Sales
Turnover = Average operating assets
$1,400,000
= $350,000 – $70,000
$1,400,000
= = 5
$280,000
Exercise 9-12 (30 minutes)
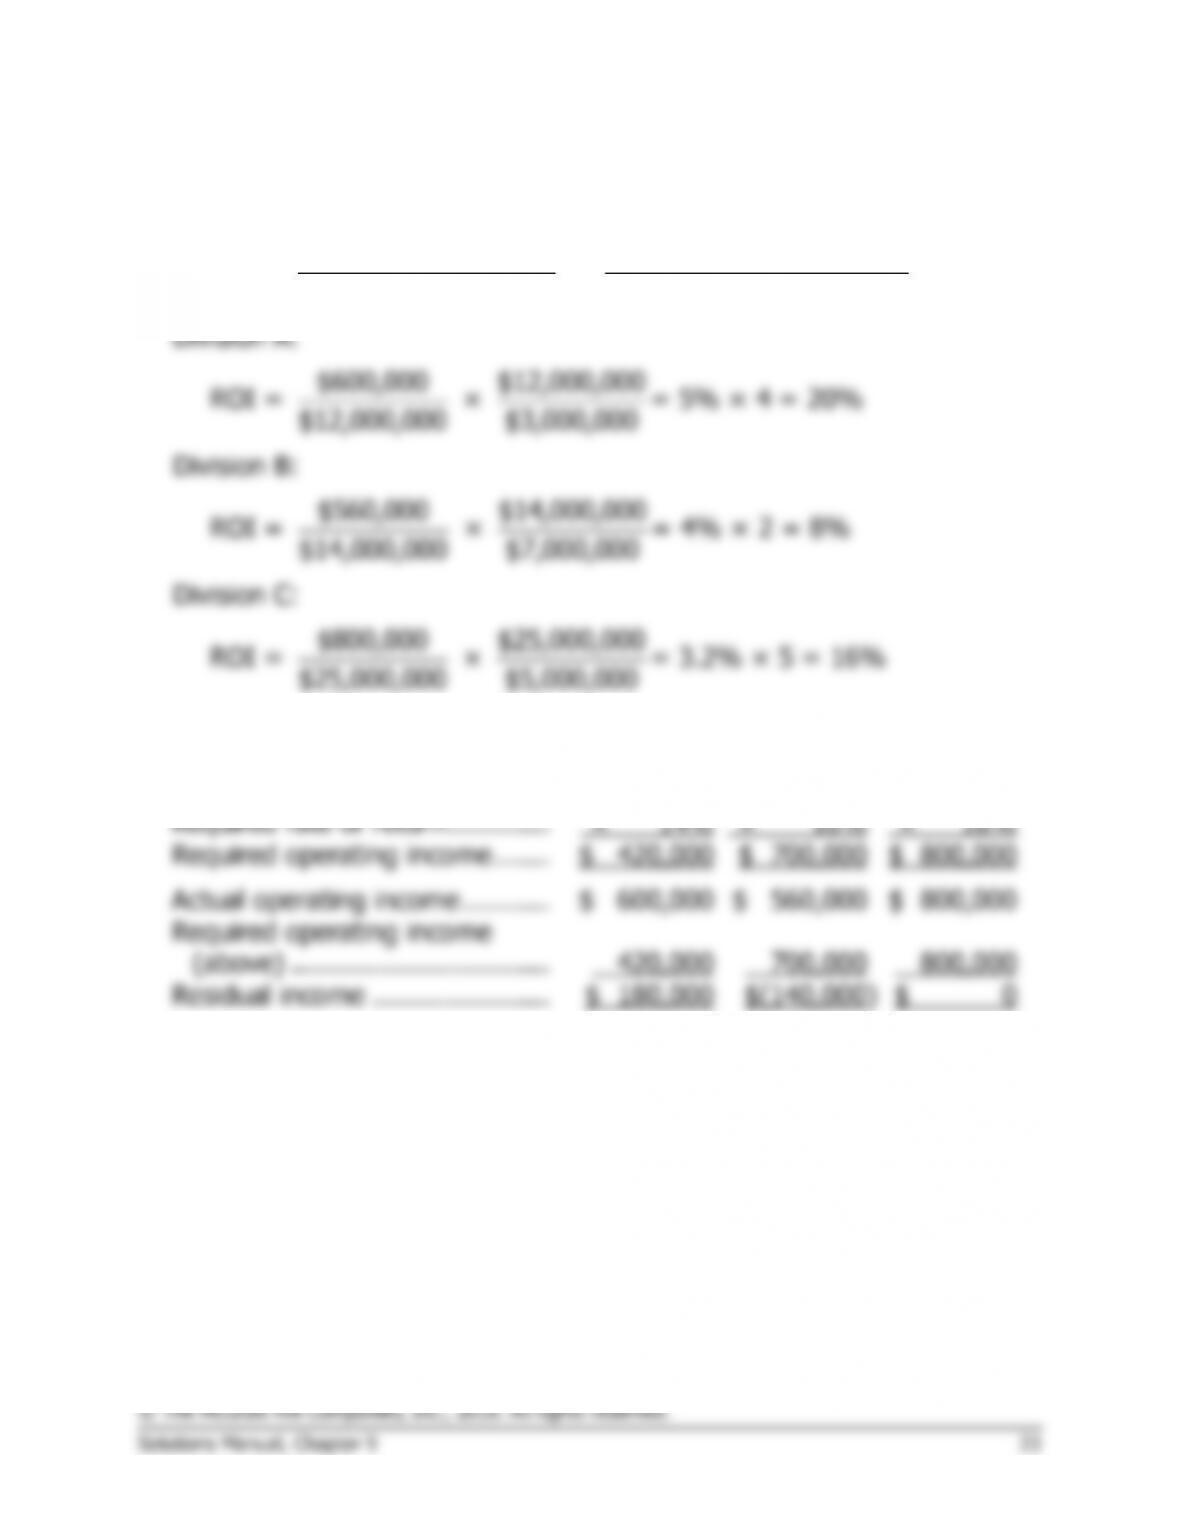
1. ROI computations:
Net operating income Sales
ROI = ×
Sales Average operating assets
$25,000,000 $5,000,000
2.
Division A
Division B
Division C
Average operating assets ………
$3,000,000
$7,000,000
$5,000,000
Required rate of return………….
× 14%
× 10%
× 16%
Required operating income …….
$ 420,000
$ 700,000
$ 800,000
Actual operating income ………..
$ 600,000
$ 560,000
$ 800,000
Required operating income
(above) …………………………..
420,000
700,000
800,000
Residual income ………………….
$ 180,000
$(140,000)
$ 0
Exercise 9-12 (continued)
3. a. and b.
Division A
Division B
Division C
Return on investment (ROI) ………..
20%
8%
16%
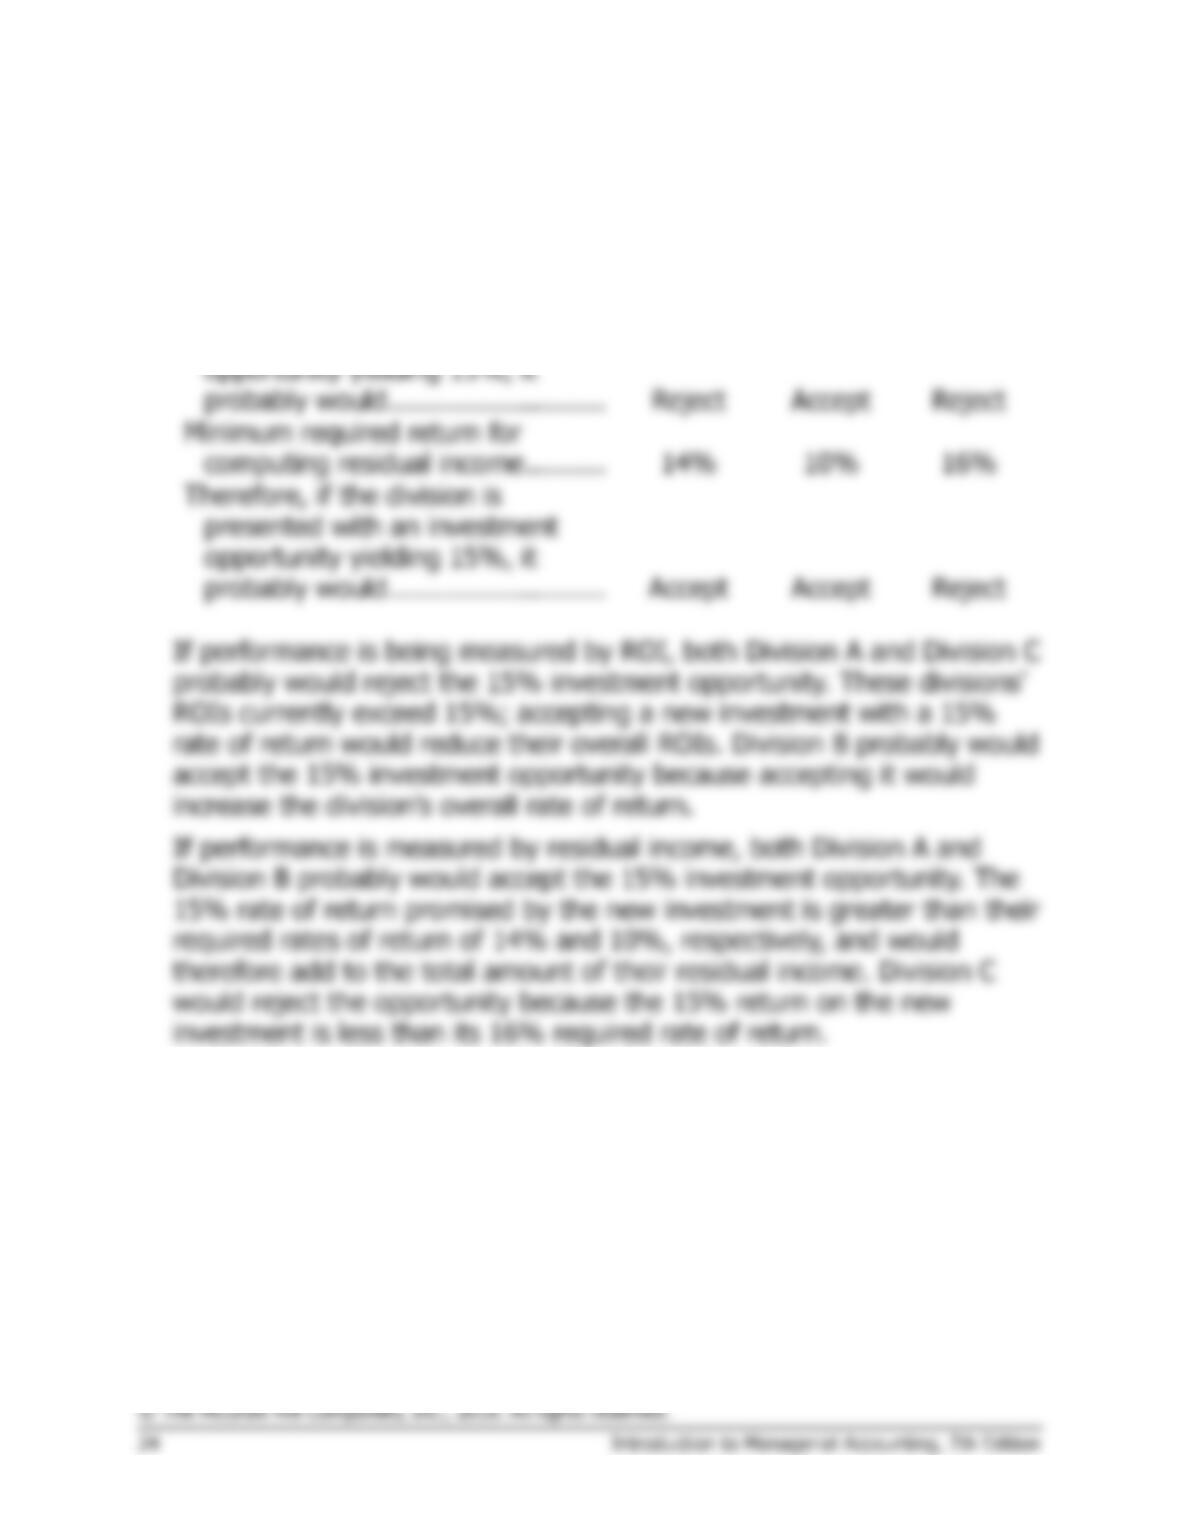
Therefore, if the division is
presented with an investment
opportunity yielding 15%, it
probably would ………………………
Reject
Accept
Reject
Minimum required return for
computing residual income ……….
14%
10%
16%
Therefore, if the division is
presented with an investment
opportunity yielding 15%, it
probably would ………………………
Accept
Accept
Reject
If performance is being measured by ROI, both Division A and Division C
probably would reject the 15% investment opportunity. These divisions’
ROIs currently exceed 15%; accepting a new investment with a 15%
rate of return would reduce their overall ROIs. Division B probably would
accept the 15% investment opportunity because accepting it would
increase the division’s overall rate of return.
If performance is measured by residual income, both Division A and
Division B probably would accept the 15% investment opportunity. The
15% rate of return promised by the new investment is greater than their
required rates of return of 14% and 10%, respectively, and would
therefore add to the total amount of their residual income. Division C
would reject the opportunity because the 15% return on the new
investment is less than its 16% required rate of return.
Exercise 9-13 (15 minutes)
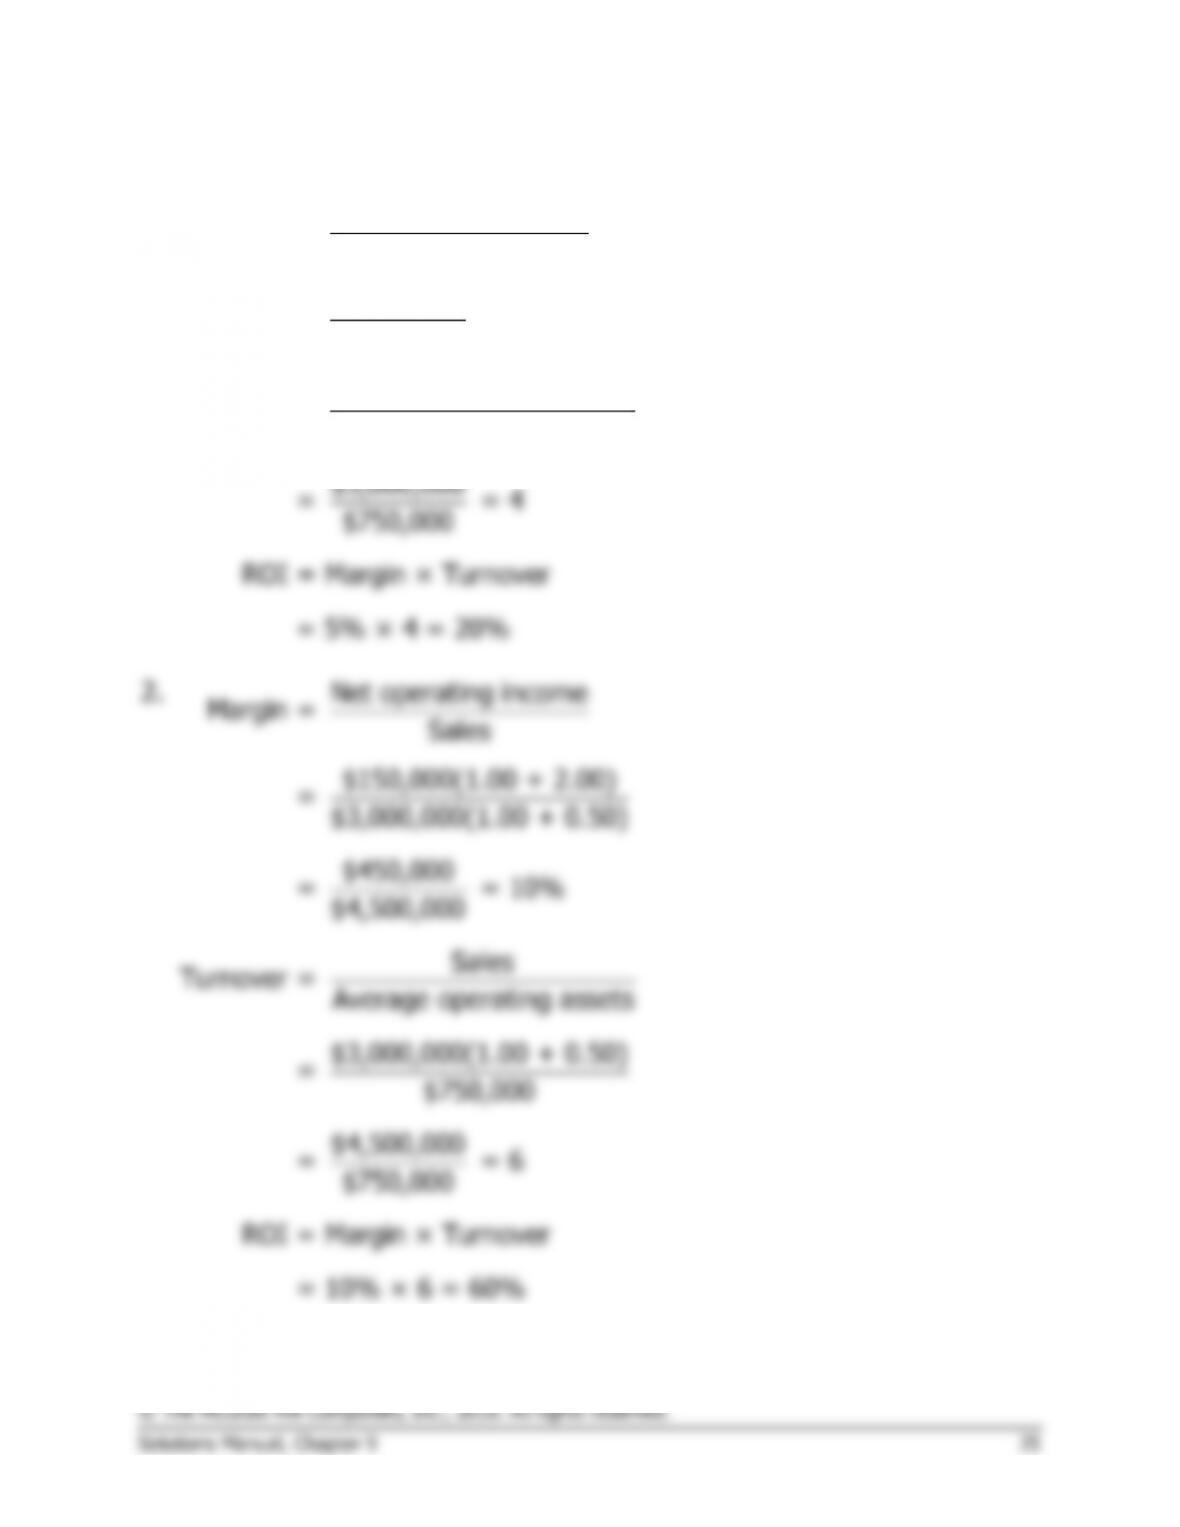
1.
Net operating income
Margin = Sales
$150,000
= = 5%
$3,000,000
Sales
Turnover = Average operating assets
$3,000,000
= = 4
$750,000
ROI = Margin × Turnover
= 5% × 4 = 20%
Exercise 9-13 (continued)
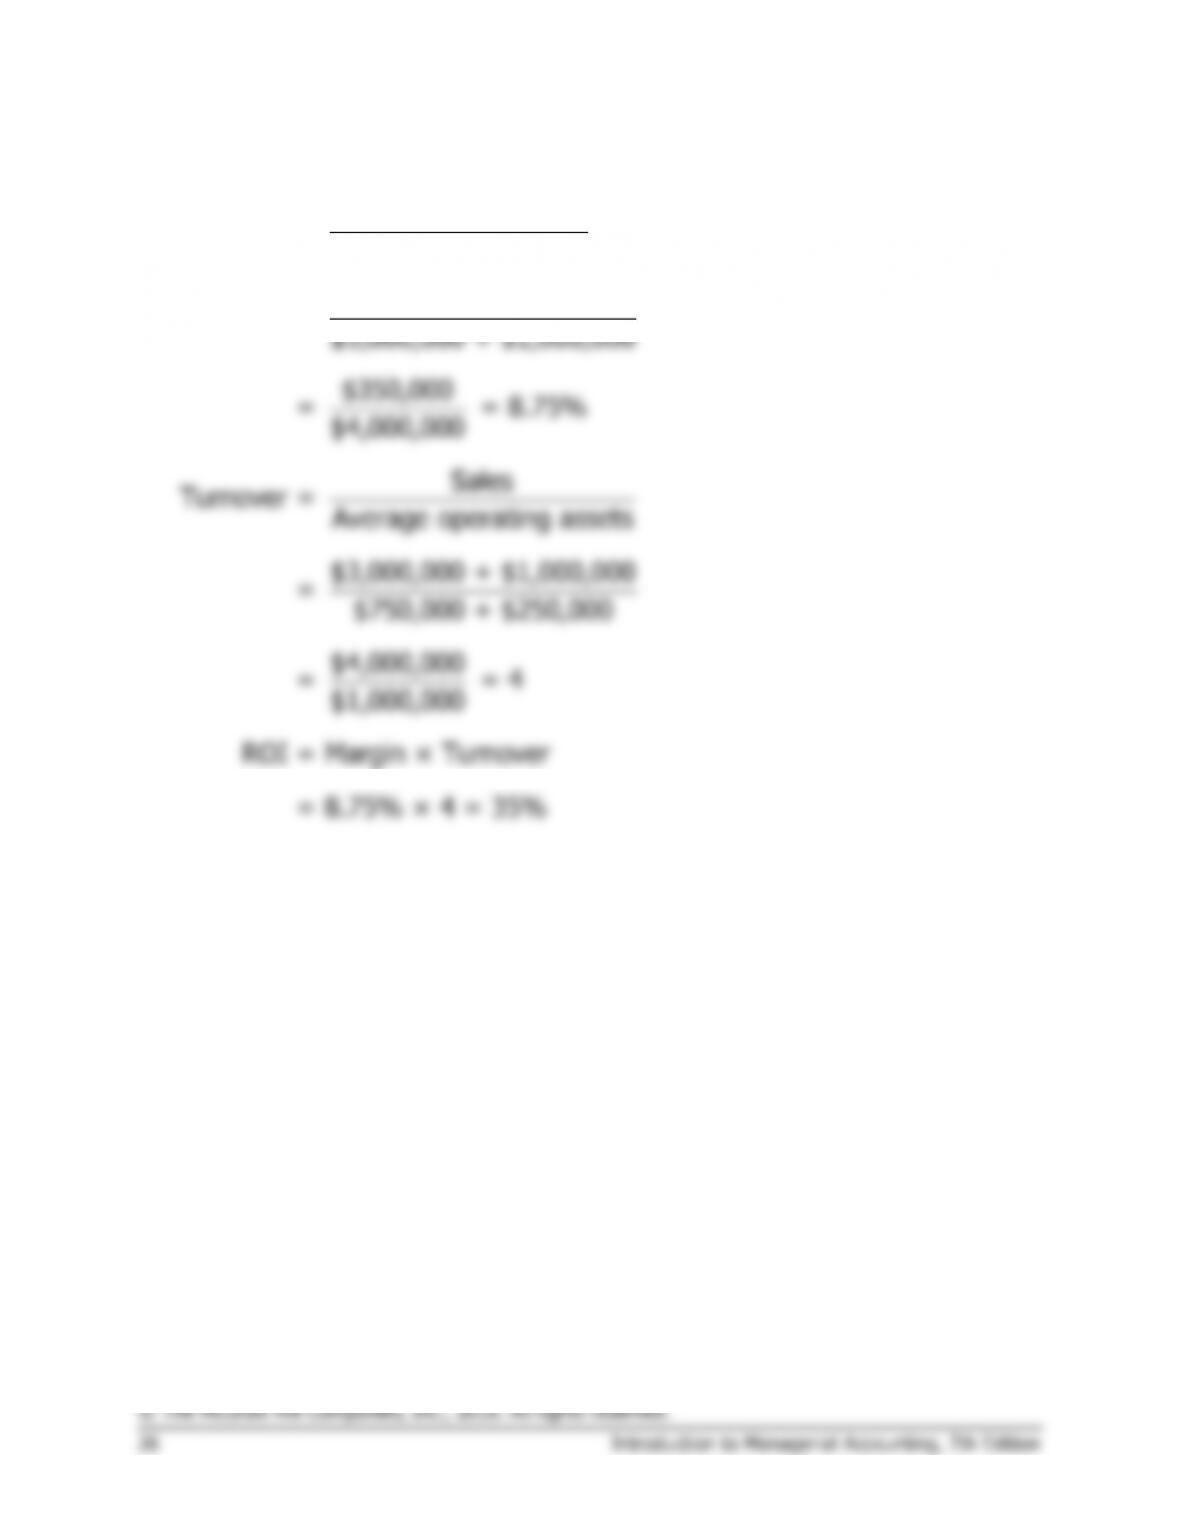
3.
Net operating income
Margin = Sales
$150,000 + $200,000
=
$3,000,000 + $1,000,000
$350,000
= = 8.75%
$4,000,000
Sales
Turnover = Average operating assets
$3,000,000 + $1,000,000
= $750,000 + $250,000
$4,000,
= 000 = 4
$1,000,000
ROI = Margin × Turnover
= 8.75% × 4 = 35%
Problem 9-14A (30 minutes)
1. a., b., and c.
Month
1
2
3
4
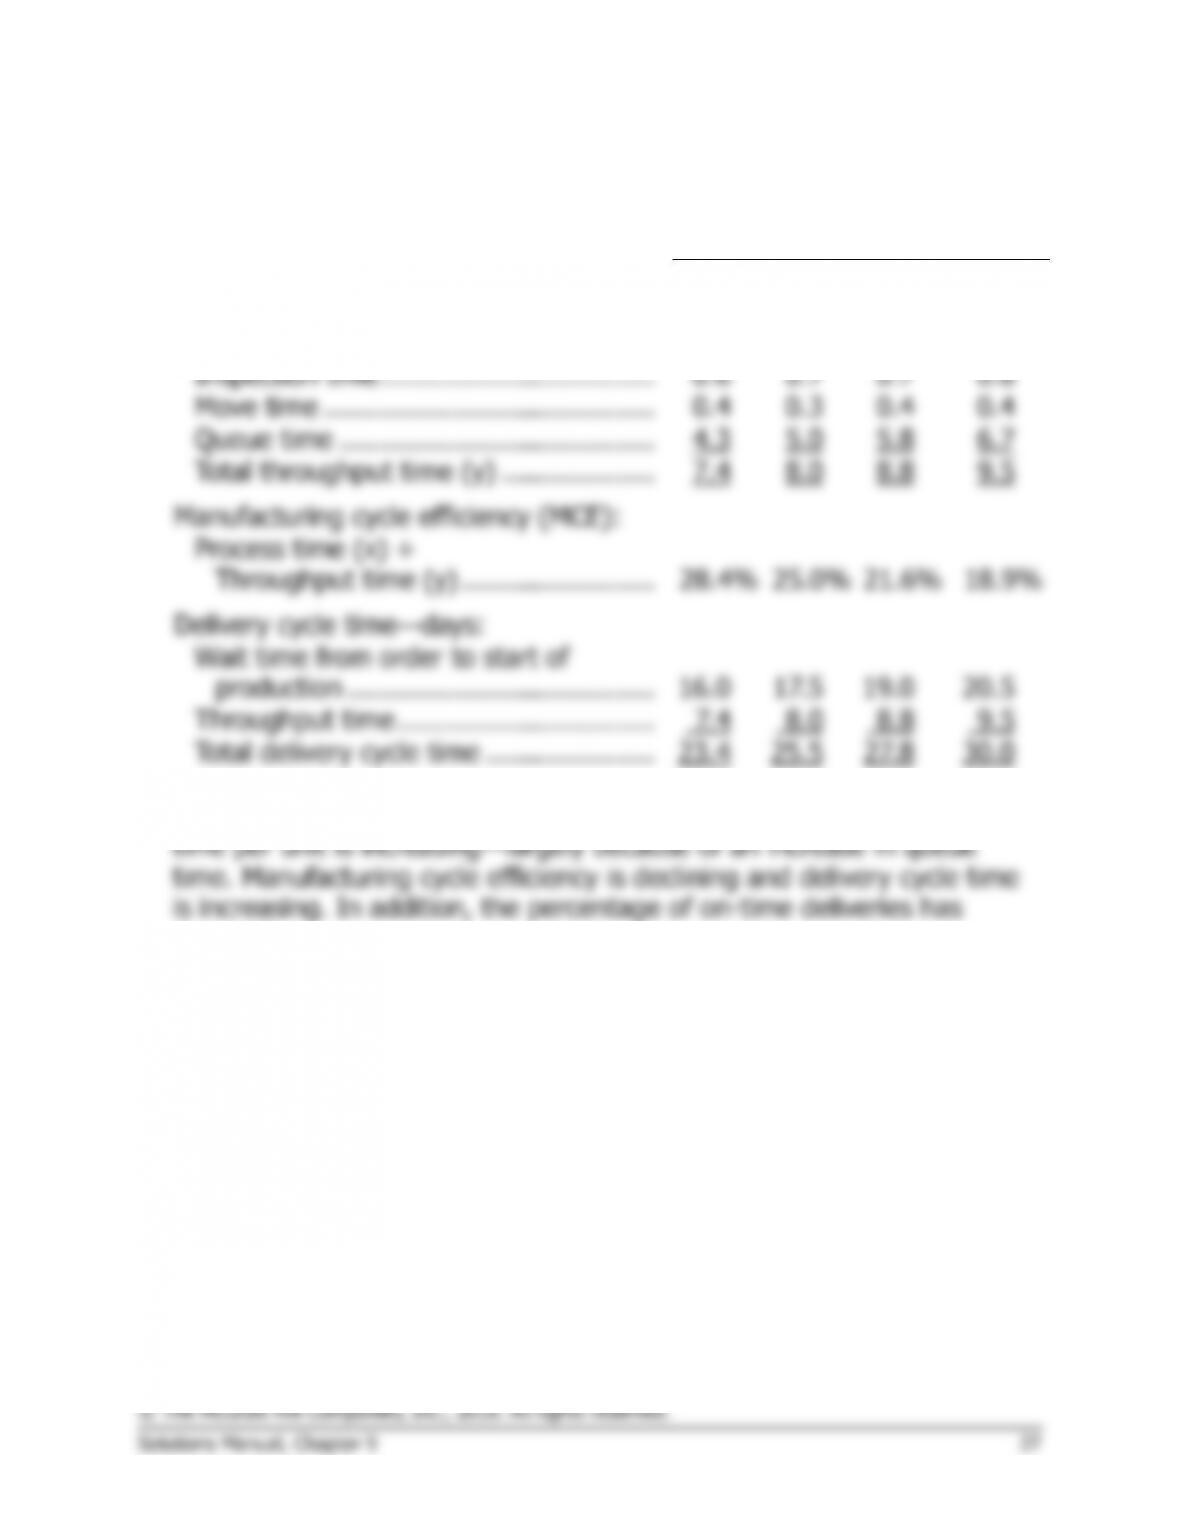
Throughput time—days:
Process time (x) …………………………...
2.1
2.0
1.9
1.8
Inspection time …………………………….
0.6
0.7
0.7
0.6
Move time …………………………………..
0.4
0.3
0.4
0.4
Queue time …………………………………
4.3
5.0
5.8
6.7
Total throughput time (y) ……………….
7.4
8.0
8.8
9.5
Manufacturing cycle efficiency (MCE):
Process time (x) ÷
Throughput time (y) ……………………
28.4%
25.0%
21.6%
18.9%
Delivery cycle time—days:
Wait time from order to start of
production ………………………………..
16.0
17.5
19.0
20.5
Throughput time …………………………..
7.4
8.0
8.8
9.5
Total delivery cycle time …………………
23.4
25.5
27.8
30.0
2. All of the performance measures display unfavorable trends. Throughput
dropped.
Problem 9-14A (continued)
3. a. and b.
Month
5
6
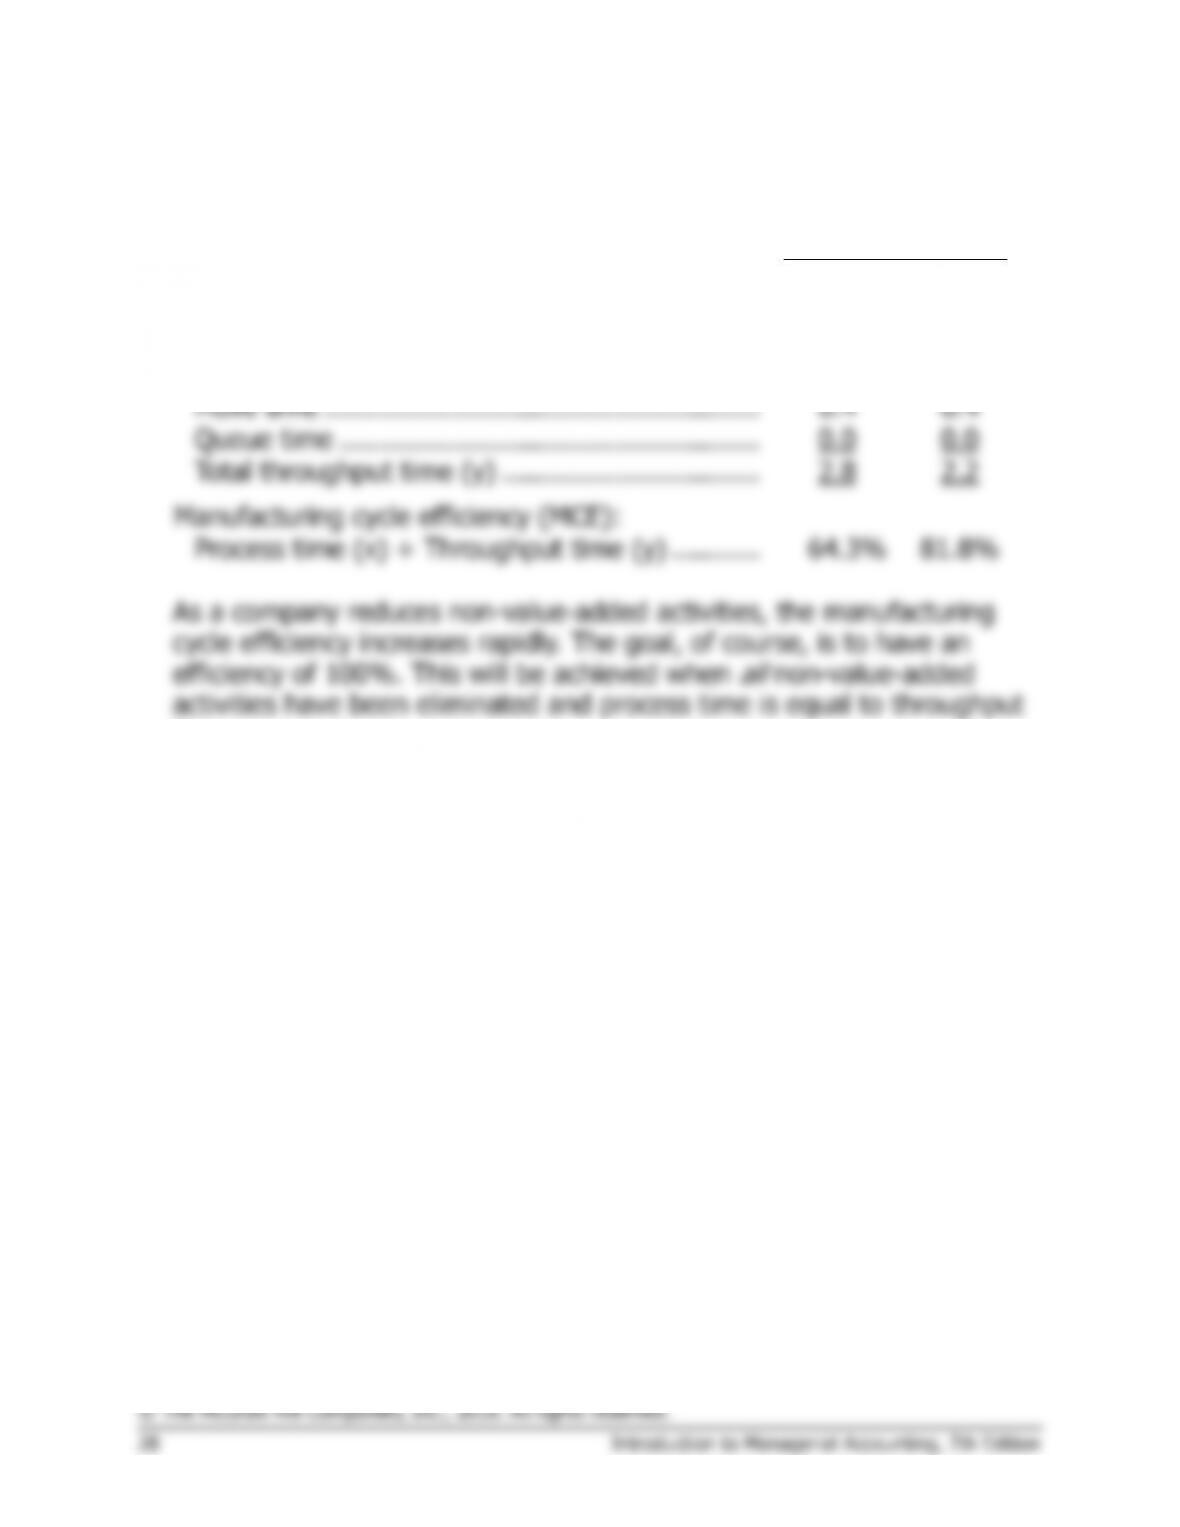
Throughput time—days:
Process time (x) ……………………………………….
1.8
1.8
Inspection time ………………………………………..
0.6
0.0
Move time ………………………………………………
0.4
0.4
Queue time …………………………………………….
0.0
0.0
Total throughput time (y) …………………………..
2.8
2.2
Manufacturing cycle efficiency (MCE):
Process time (x) ÷ Throughput time (y) ………..
64.3%
81.8%
As a company reduces non-value-added activities, the manufacturing
cycle efficiency increases rapidly. The goal, of course, is to have an
efficiency of 100%. This will be achieved when
all
non-value-added
activities have been eliminated and process time is equal to throughput
time.
Problem 9-15A (20 minutes)
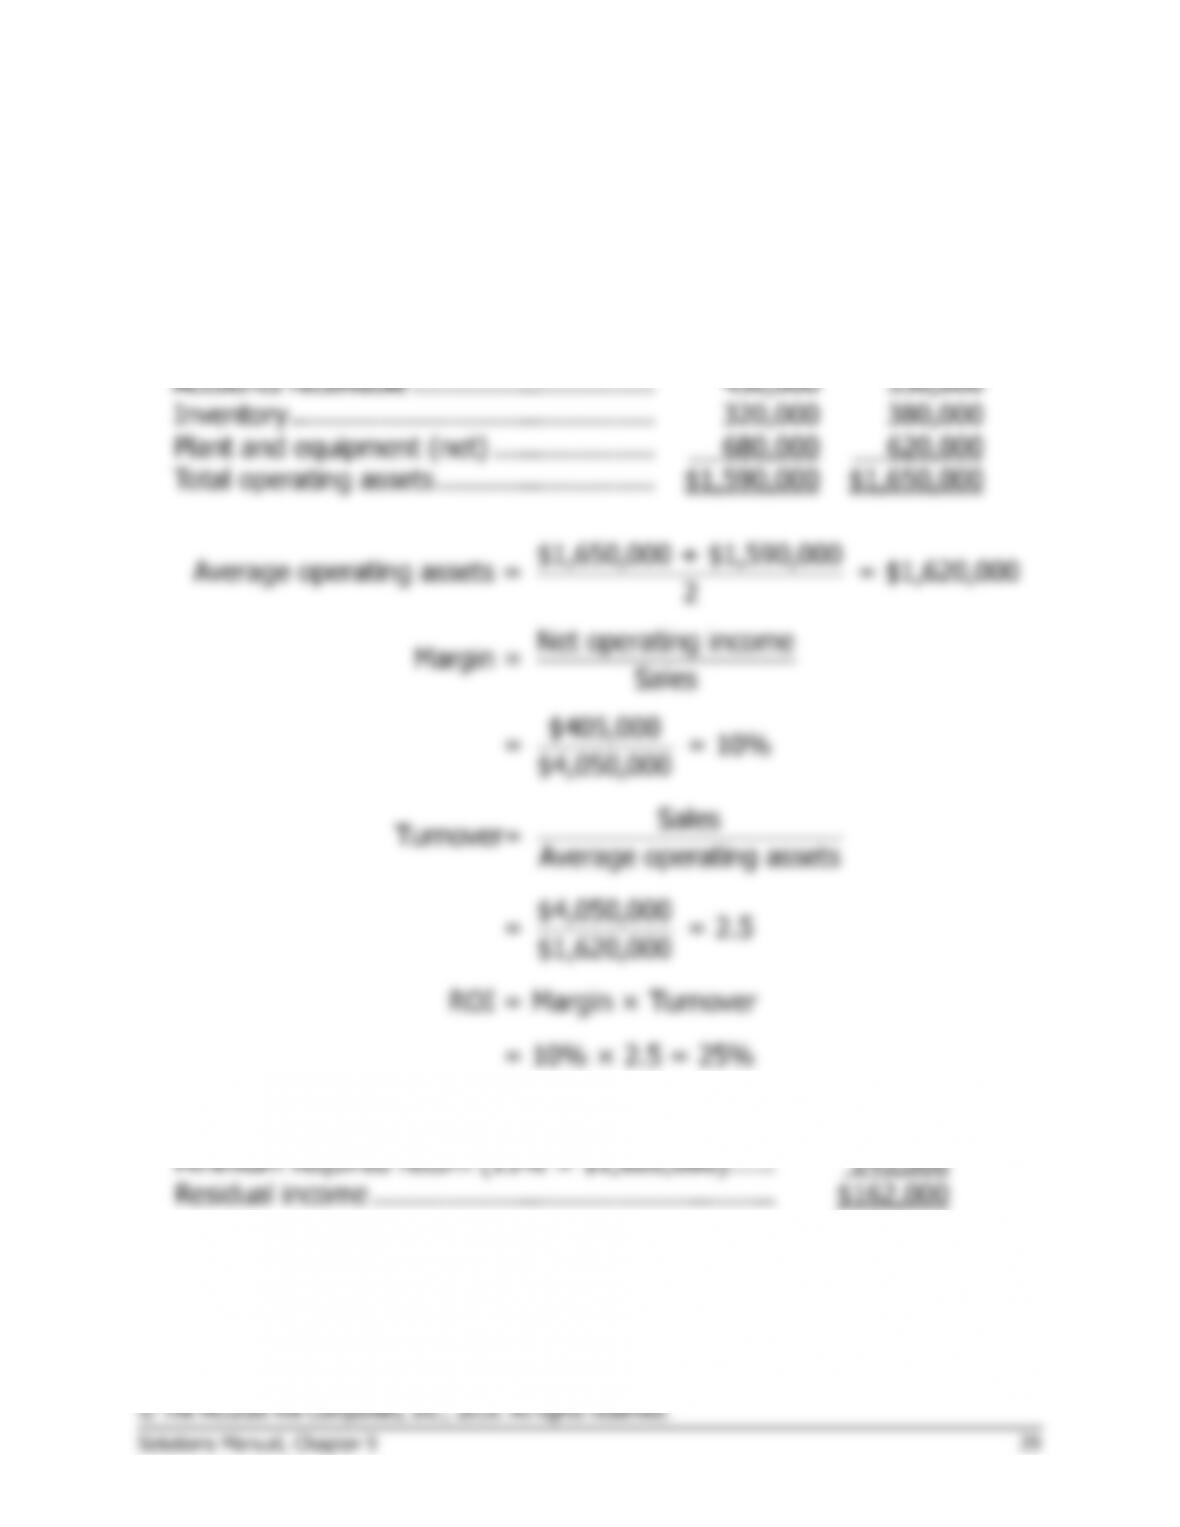
1. Operating assets do not include investments in other companies or in
undeveloped land.
Beginning
Balances
Ending
Balances
Cash …………………………………………….
$ 140,000
$ 120,000
Accounts receivable …………………………
450,000
530,000
Inventory ………………………………………
320,000
380,000
Plant and equipment (net) ………………..
680,000
620,000
Total operating assets ………………………
$1,590,000
$1,650,000
$1,650,000 + $1,590,000
Average operating assets = = $1,620,000
2
Net operating income
Margin = Sales
$405,000
= = 10%
$4,050,000
Sales
Turnover= Average operating assets
$4,050,000
= = 2.5
$1,620,000
ROI = Margin × Turnover
= 10% × 2.5 = 25%
2.
Net operating income ……………………………………
$405,000
Minimum required return (15% × $1,620,000) ……
243,000
Residual income …………………………..………………
$162,000
Problem 9-16A (45 minutes)
1. MPC’s previous manufacturing strategy was focused on high–volume
production of a limited range of paper grades. The goal of this strategy
was to keep the machines running constantly to maximize the number
of tons produced. Changeovers were avoided because they lowered
2. Employees focus on improving those measures that are used to evaluate
their performance. Therefore, strategically-aligned performance
measures will channel employee effort towards improving those aspects
of performance that are most important to obtaining strategic
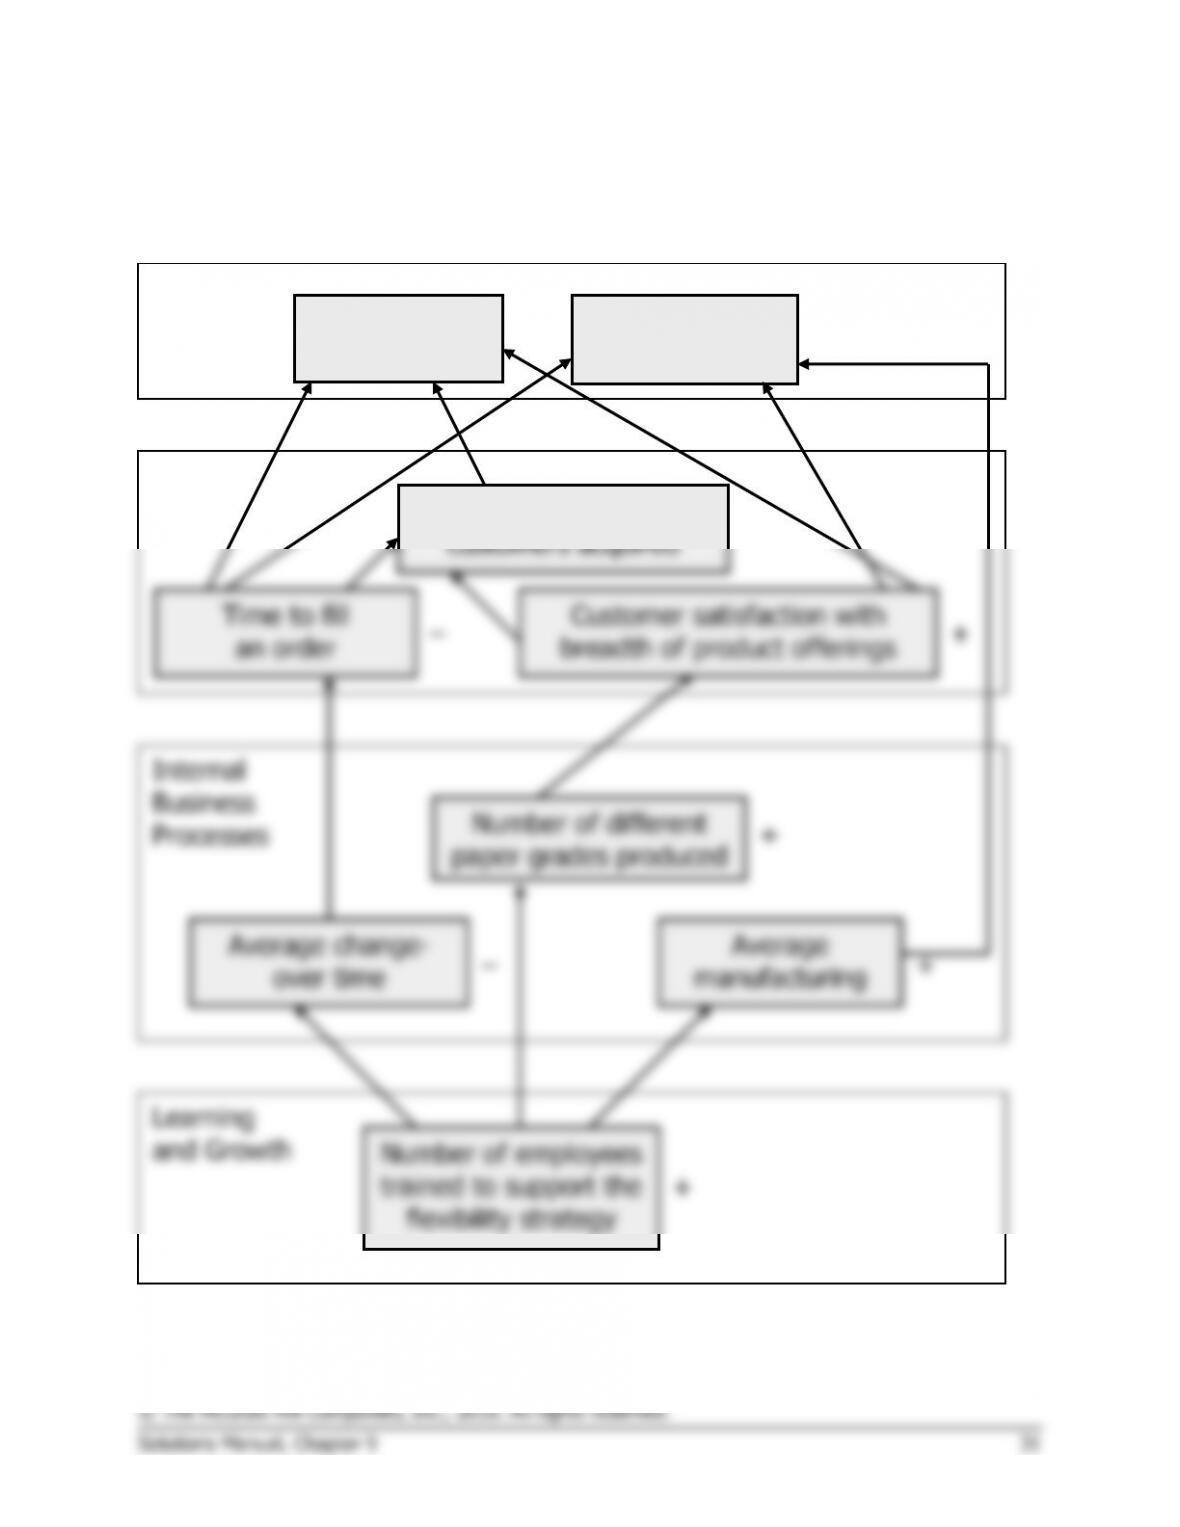
Problem 9-16A (continued)
3. Students’ answers may differ in some details from this solution.
Average
+
+
Sales
Contribution
margin per ton
Financial
Number of new
customers acquired
Customer
+
+
+
Problem 9-16A (continued)
4. The hypotheses underlying the balanced scorecard are indicated by the
arrows in the diagram. Reading from the bottom of the balanced
scorecard, the hypotheses are:
° If the number of employees trained to support the flexibility strategy
increases, then the average changeover time will decrease and the
increase.
° If the customer satisfaction with breadth of product offerings
increases, then the number of new customers acquired, sales, and
the contribution margin per ton will increase.
° If the number of new customers acquired increases, then sales will
increase.
Each of these hypotheses can be questioned. For example, the time to
Problem 9-17A (30 minutes)
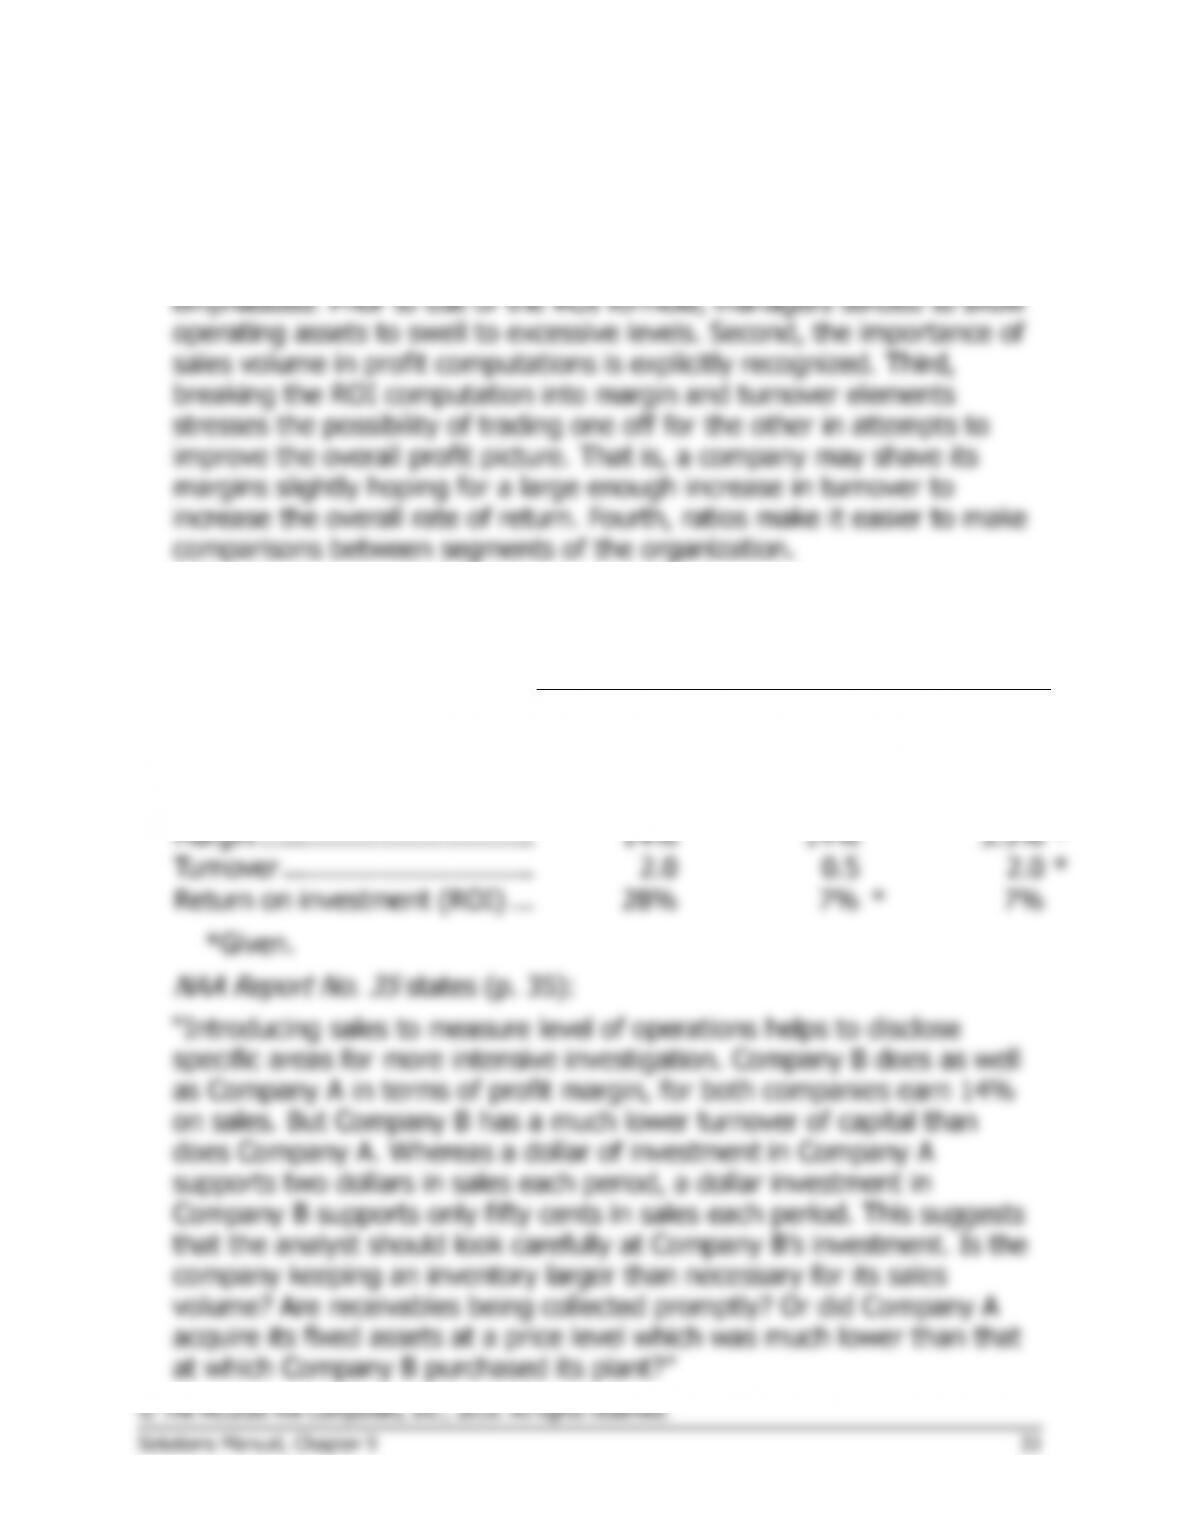
1. Breaking the ROI computation into two separate elements reveals
important relationships that otherwise might remain hidden. First, the
importance of asset turnover as a key element to overall profitability is
2. The missing information is as follows:
Companies in the Same Industry
A
B
C
Sales ………………………………
$600,000
*
$500,000
*
$2,000,000
Net operating income …………
$84,000
*
$70,000
*
$70,000
Average operating assets …….
$300,000
*
$1,000,000
$1,000,000
*
Margin …………………………….
14%
14%
3.5%
*
Turnover ………………………….
2.0
0.5
2.0
*
Return on investment (ROI) …
28%
7%
*
7%
Problem 9-17A (continued)
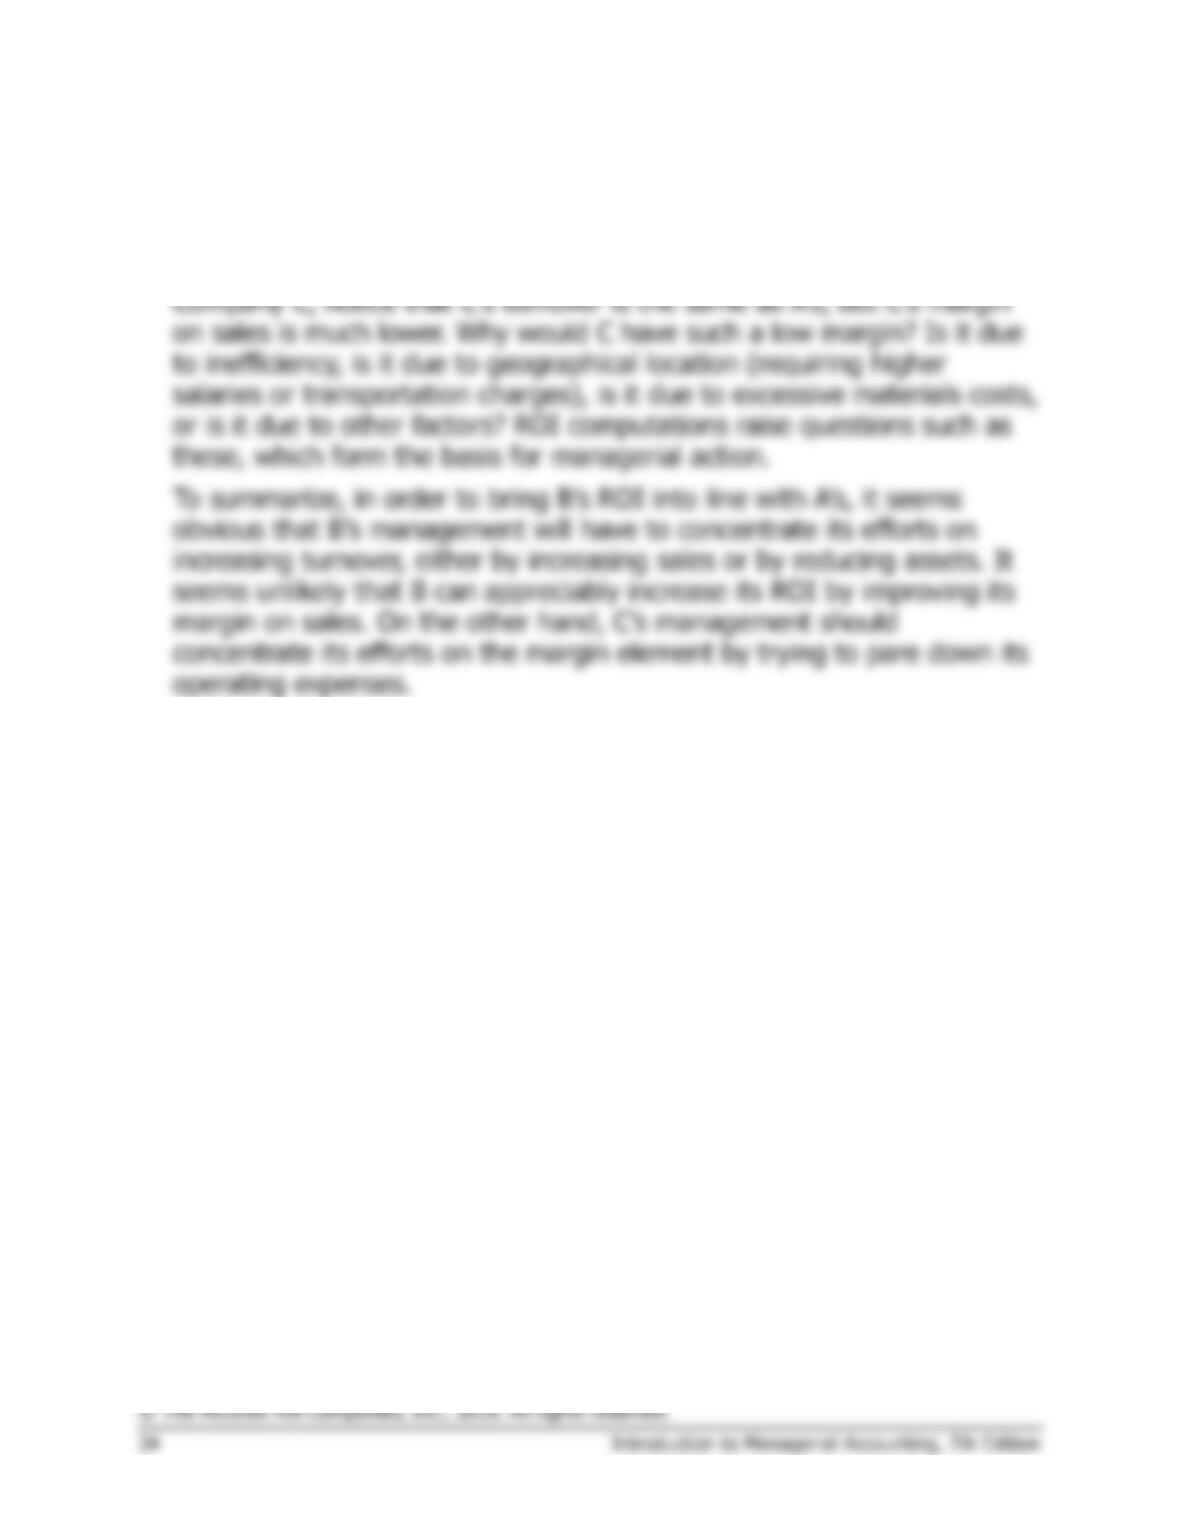
Thus, by including sales specifically in ROI computations the manager is
able to discover possible problems, as well as reasons underlying a
strong or a weak performance. Looking at Company A compared to
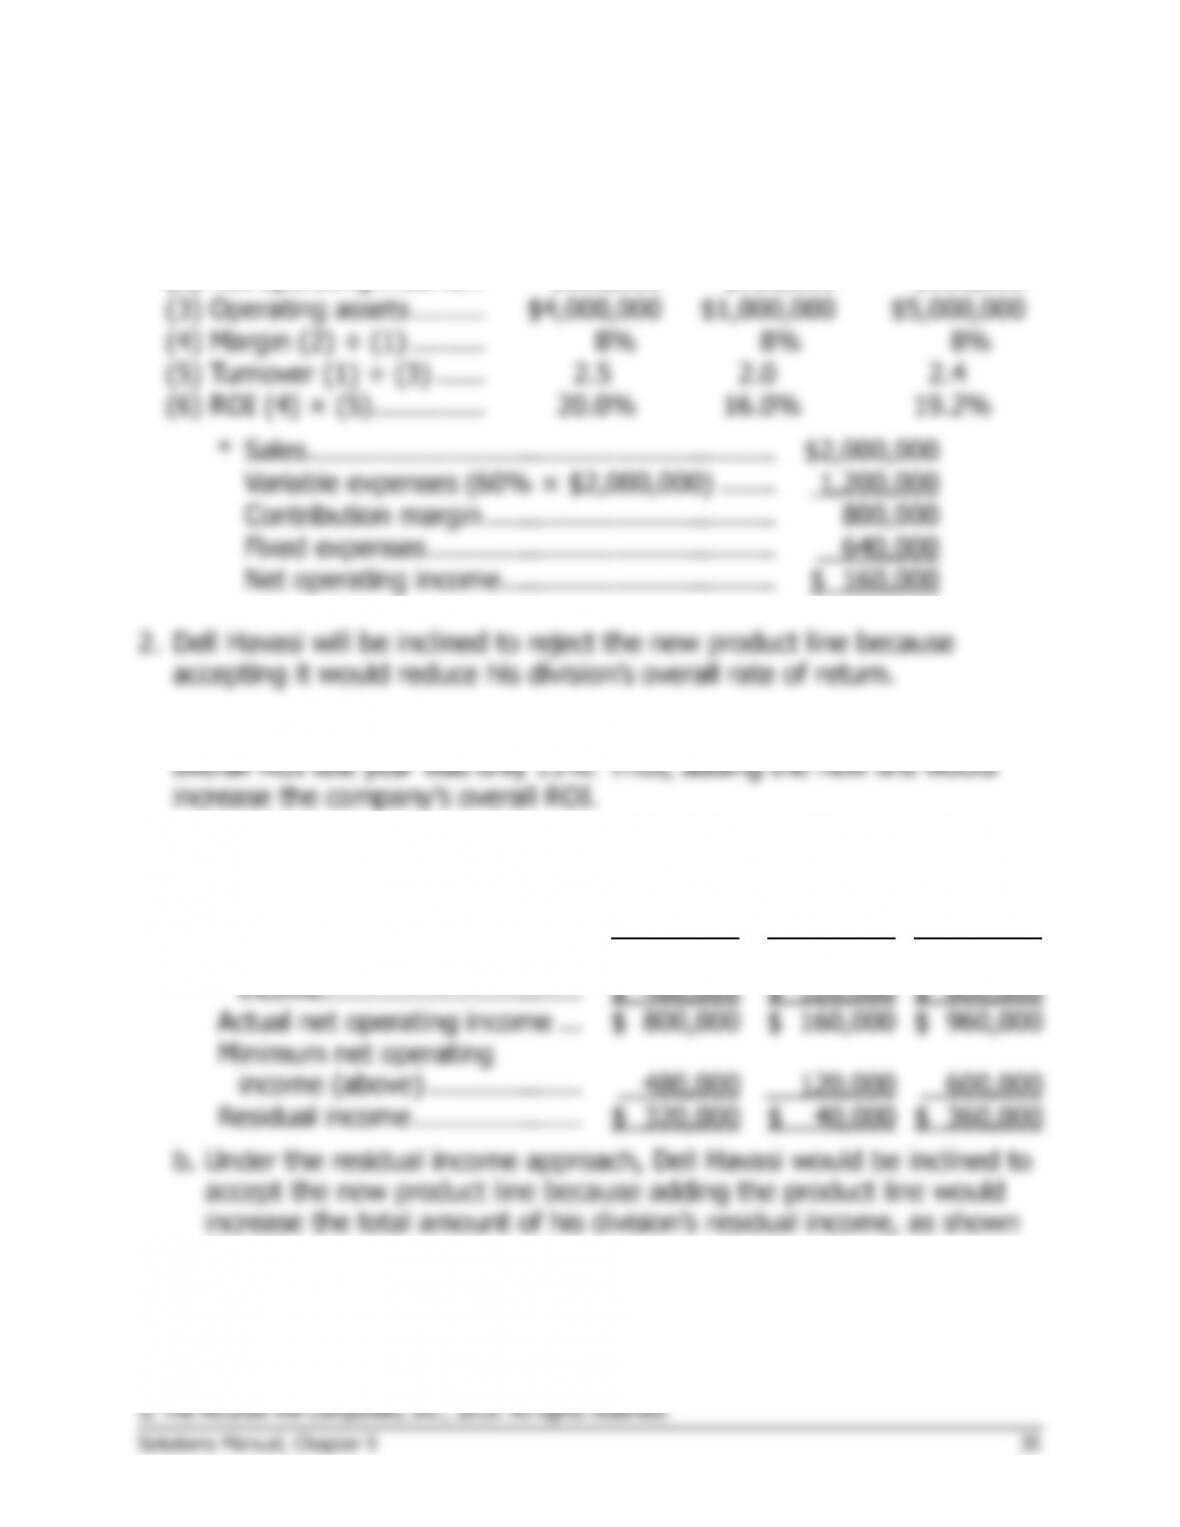
Problem 9-18A (30 minutes)
1.
Present
New Line
Total
(1)
Sales ……………………..
$10,000,000
$2,000,000
$12,000,000
(2)
Net operating income ..
$800,000
$160,000
*
$960,000
(3)
Operating assets ………
$4,000,000
$1,000,000
$5,000,000
(4)
Margin (2) ÷ (1) ………
8%
8%
8%
(5)
Turnover (1) ÷ (3) ……
2.5
2.0
2.4
(6)
ROI (4) × (5) …………..
20.0%
16.0%
19.2%
*
Sales ………………………………………………….
$2,000,000
Variable expenses (60% × $2,000,000) …….
1,200,000
Contribution margin ………………………………
800,000
Fixed expenses …………………………………….
640,000
Net operating income …………………………….
$ 160,000
3. The new product line promises an ROI of 16%, whereas the company’s
4.
a.
Present
New Line
Total
Operating assets ………………..
$4,000,000
$1,000,000
$5,000,000
Minimum return required ……..
× 12%
× 12%
× 12%
Minimum net operating
income…………………………..
$ 480,000
$ 120,000
$ 600,000
Actual net operating income …
$ 800,000
$ 160,000
$ 960,000
Minimum net operating
income (above) ……………….
480,000
120,000
600,000
Residual income …………………
$ 320,000
$ 40,000
$ 360,000
b. Under the residual income approach, Dell Havasi would be inclined to
accept the new product line because adding the product line would
increase the total amount of his division’s residual income, as shown
above.
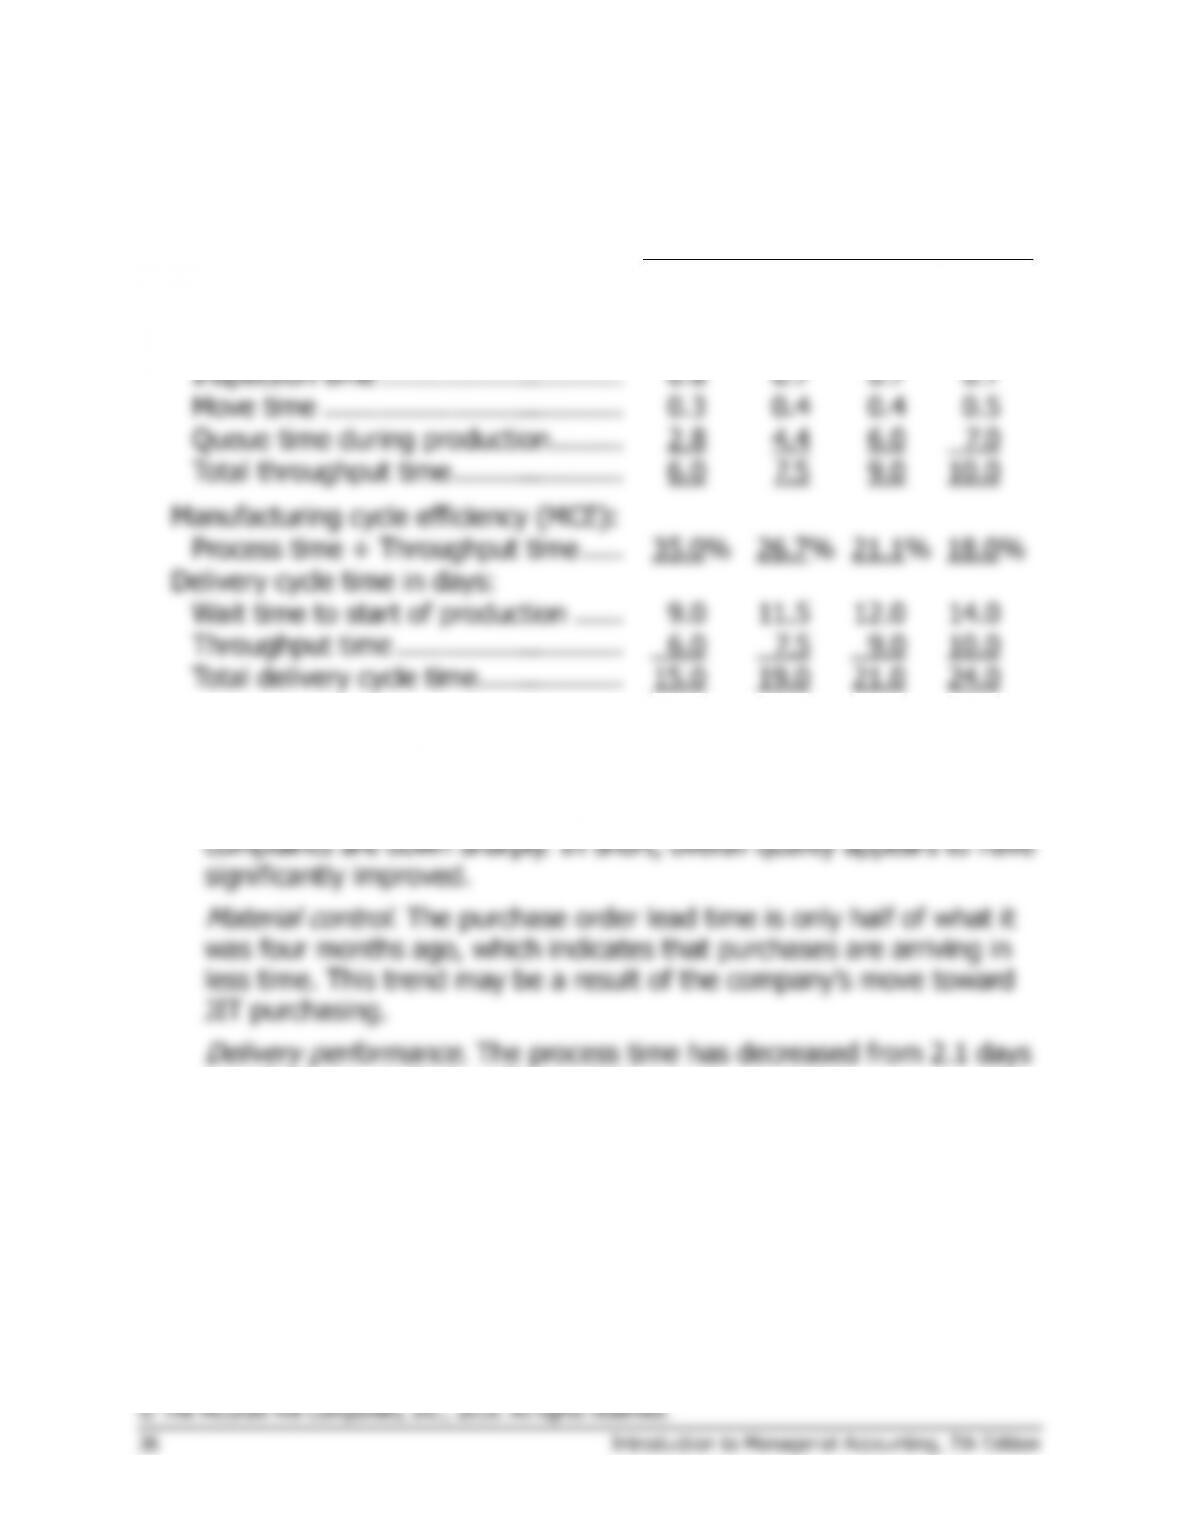
Problem 9-19A (30 minutes)
1. a., b., and c.
Month
1
2
3
4
Throughput time in days:
Process time …………………………….
2.1
2.0
1.9
1.8
Inspection time …………………………
0.8
0.7
0.7
0.7
Move time ……………………………….
0.3
0.4
0.4
0.5
Queue time during production ………
2.8
4.4
6.0
7.0
Total throughput time …………………
6.0
7.5
9.0
10.0
Manufacturing cycle efficiency (MCE):
Process time ÷ Throughput time …..
35.0%
26.7%
21.1%
18.0%
Delivery cycle time in days:
Wait time to start of production ……
9.0
11.5
12.0
14.0
Throughput time ……………………….
6.0
7.5
9.0
10.0
Total delivery cycle time………………
15.0
19.0
21.0
24.0
2. a. Areas where the company is improving:
Quality control.
The number of defects has decreased by over 50% in
the last four months. Moreover, both warranty claims and customer
to 1.8 days over the last four months.
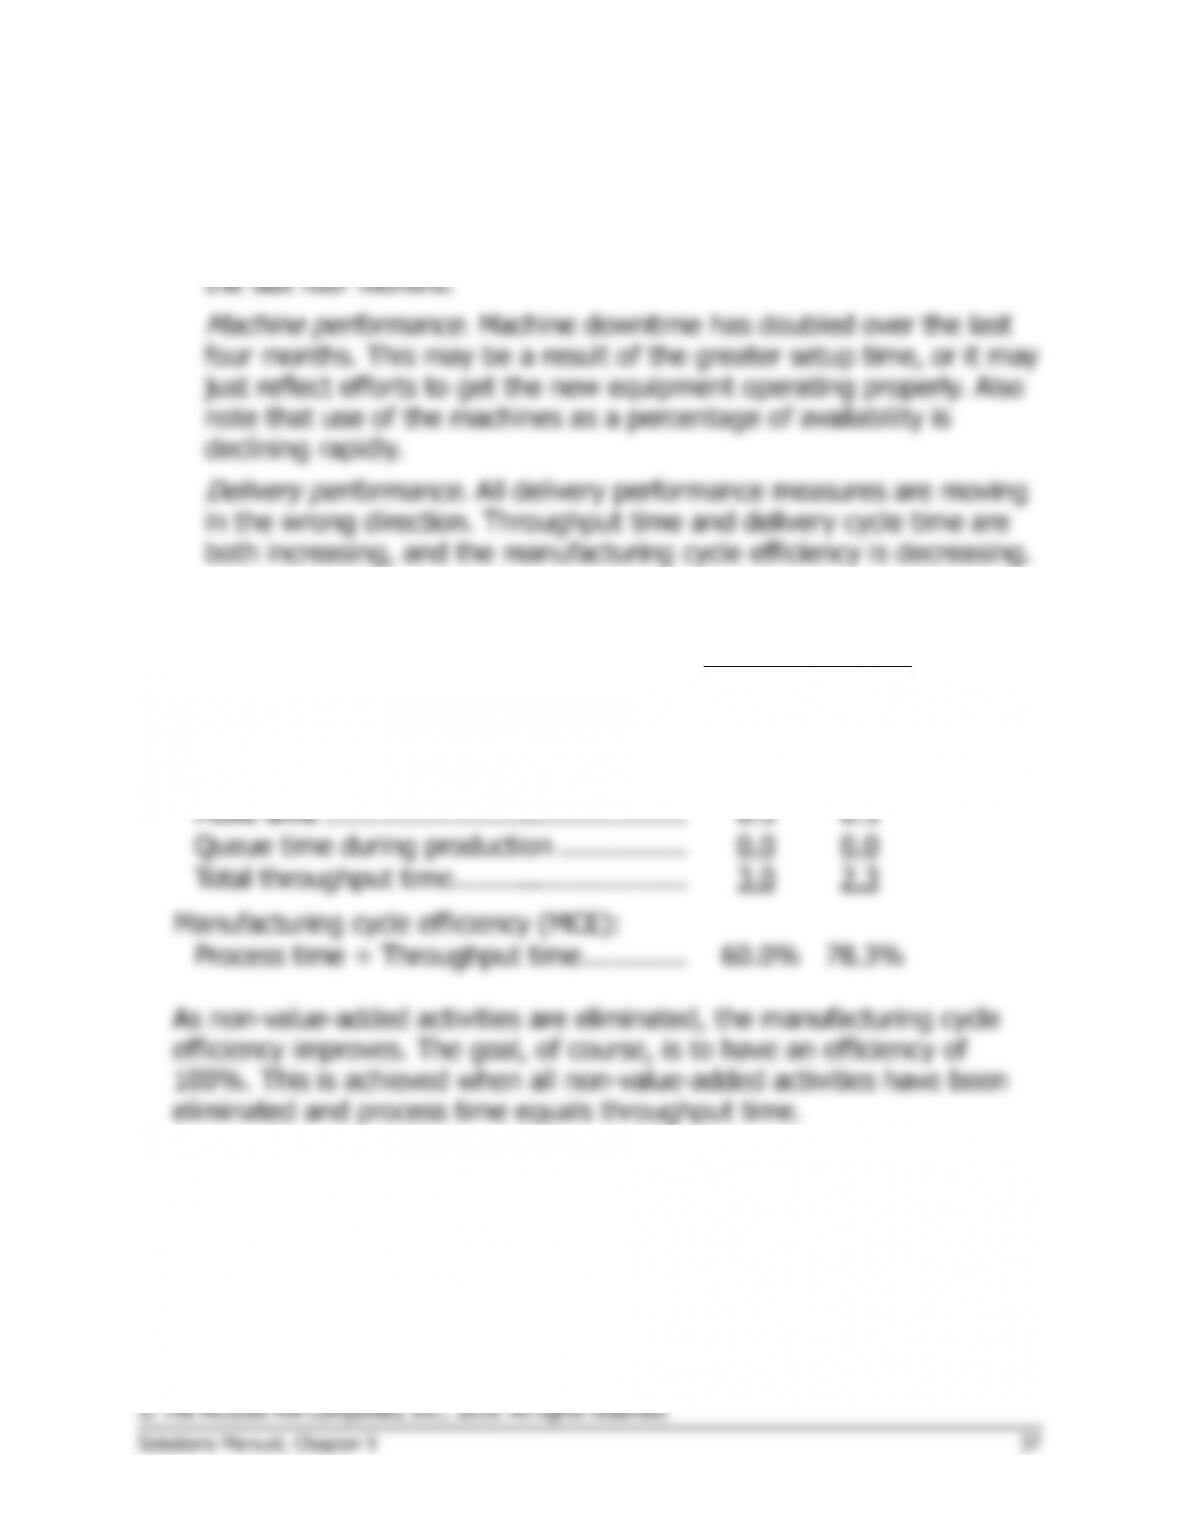
Problem 9-19A (continued)
b. Areas of deterioration:
Material control.
Scrap as a percentage of total cost has tripled over
3. a. and b.
Month
5
6
Throughput time in days:
Process time ……………………………………
1.8
1.8
Inspection time ………………………………..
0.7
0.0
Move time ………………………………………
0.5
0.5
Queue time during production …………….
0.0
0.0
Total throughput time ………………………..
3.0
2.3
Manufacturing cycle efficiency (MCE):
Process time ÷ Throughput time ………….
60.0%
78.3%
As non-value-added activities are eliminated, the manufacturing cycle
efficiency improves. The goal, of course, is to have an efficiency of
100%. This is achieved when all non-value-added activities have been
eliminated and process time equals throughput time.
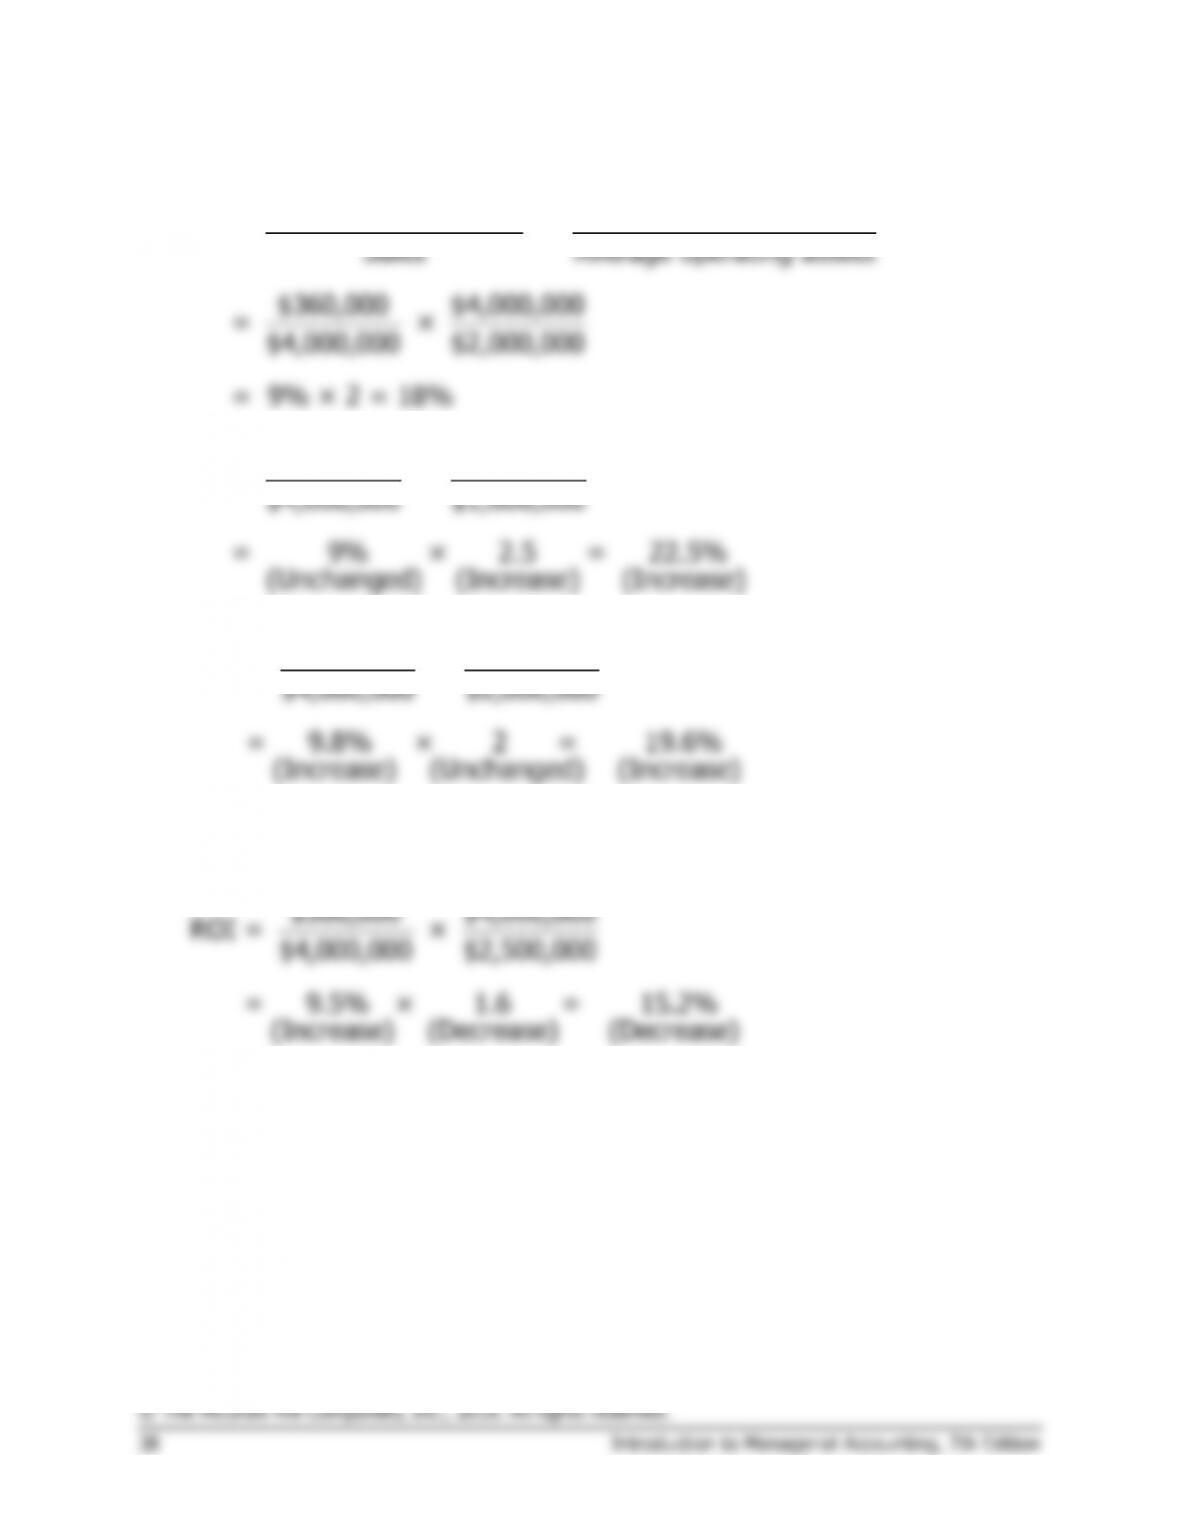
Problem 9-20A (30 minutes)
1.
Net operating income Sales
ROI = ×
Sales Average operating assets
$360,000 $4,000,000
= ×
$4,000,000 $2,000,000
= 9% × 2 = 18%
2.
$360,000 $4,000,000
ROI = ×
$4,000,000 $1,600,000
= 9% × 2.5 = 22.5%
(Unchanged) (Increase) (Increase)
3.
$392,000 $4,000,000
ROI = ×
$4,000,000 $2,000,000
= 9.8% × 2 = 19.6%
(Increase) (Unchanged) (Increase)
4. Interest is a financing expense and thus it is not used to compute net
operating income.
$380,000 $4,000,000
ROI = ×
$4,000,000 $2,500,000
= 9.5% × 1.6 = 15.2%
(Increase) (Decrease) (Decrease)
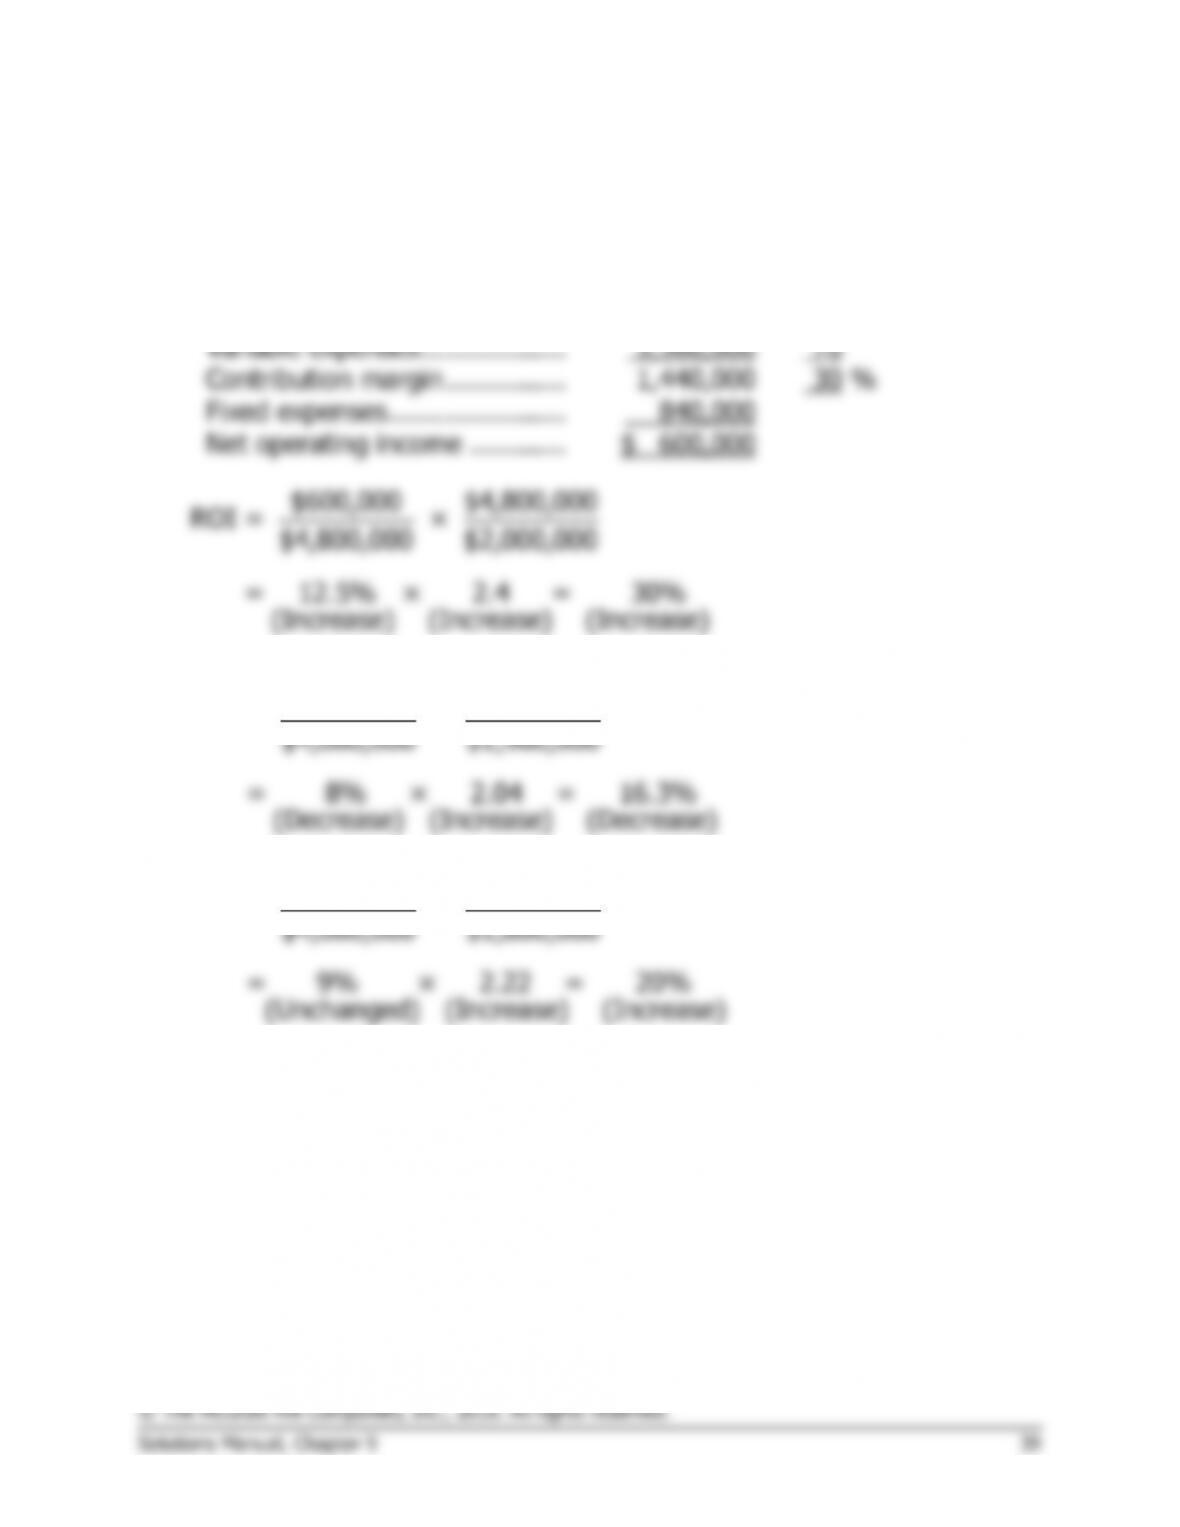
Problem 9-20A (continued)
5. The company has a contribution margin ratio of 30% ($24 CM per unit,
divided by the $80 selling price per unit). Therefore, a 20% increase in
sales would result in a new net operating income of:
Sales (1.20 × $4,000,000) …..
$4,800,000
100
%
Variable expenses ………………
3,360,000
70
Contribution margin ……………
1,440,000
30
%
Fixed expenses ………………….
840,000
Net operating income …………
$ 600,000
$600,000 $4,800,000
ROI = ×
$4,800,000 $2,000,000
= 12.5% × 2.4 = 30%
(Increase) (Increase) (Increase)
6.
$320,000 $4,000,000
ROI = ×
$4,000,000 $1,960,000
= 8% × 2.04 = 16.3%
(Decrease) (Increase) (Decrease)
7.
$360,000 $4,000,000
ROI = ×
$4,000,000 $1,800,000
= 9% × 2.22 = 20%
(Unchanged) (Increase) (Increase)
Problem 9-21A (90 minutes)
1. Both companies view training as important; both companies need to
leverage technology to succeed in the marketplace; and both companies
are concerned with minimizing defects. There are numerous differences
between the two companies. For example, Applied Pharmaceuticals is a