Chapter 9
Performance Measurement in Decentralized
Organizations
Solutions to Questions
9-1 In a decentralized organization,
decision-making authority isn’t confined to a few
9-2 The benefits of decentralization include:
(1) by delegating day-to–day problem solving to
lower-level managers, top management can
concentrate on bigger issues such as overall
strategy; (2) empowering lower-level managers
9-3 The manager of a cost center has
control over cost, but not revenue or the use of
9-4 Margin is the ratio of net operating
income to total sales. Turnover is the ratio of
9-5 Residual income is the net operating
income an investment center earns above the
company’s minimum required rate of return on
operating assets.
profitable investment opportunity whose rate of
return exceeds the company’s required rate of
return but whose rate of return is less than the
investment center’s current ROI. The residual
income approach overcomes this problem
9-8 An MCE of less than 1 means that the
production process includes non-value-added
9-9 A company’s balanced scorecard should
be derived from and support its strategy.
9-10 The balanced scorecard is constructed
to support the company’s strategy, which is a

© The McGraw-Hill Companies, Inc., 2016. All rights reserved.
2 Introduction to Managerial Accounting, 7th Edition
theory about what actions will further the
company’s goals. Assuming that the company
has financial goals, measures of financial
performance must be included in the balanced
scorecard as a check on the reality of the theory.
If the internal business processes improve, but
the financial outcomes do not improve, the
theory may be flawed and the strategy should
be changed.
The Foundational 15
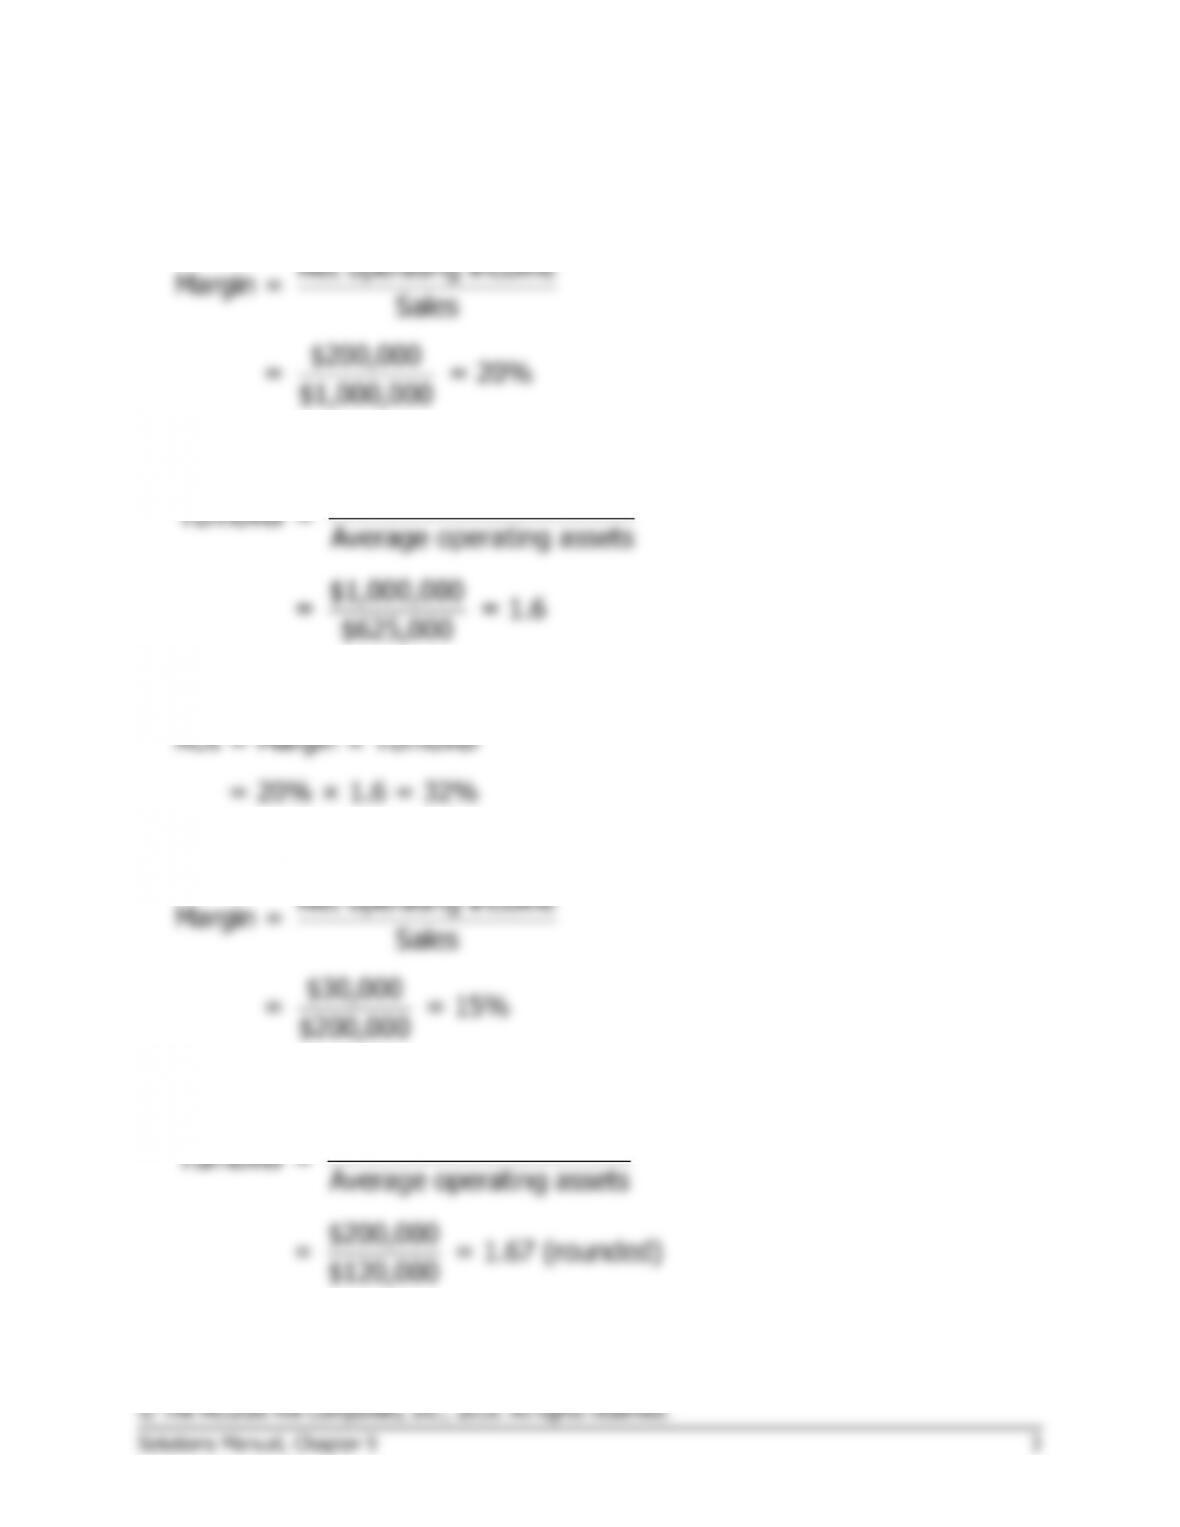
1. Last year’s margin is:
Net operating income
Margin = Sales
$200,000
= = 20%
$1,000,000
2. Last year’s turnover is:
Sales
Turnover = Average operating assets
$1,000,000
= = 1.6
$625,000
3. Last year’s return on investment (ROI) is:
ROI = Margin × Turnover
= 20% × 1.6 = 32%
4. The margin for this year’s investment opportunity is:
Net operating income
Margin = Sales
$30,000
= = 15%
$200,000
5. The turnover for this year’s investment opportunity is:
Sales
Turnover = Average operating assets
$200,000
= = 1.67 (rounded)
$120,000
The Foundational 15 (continued)
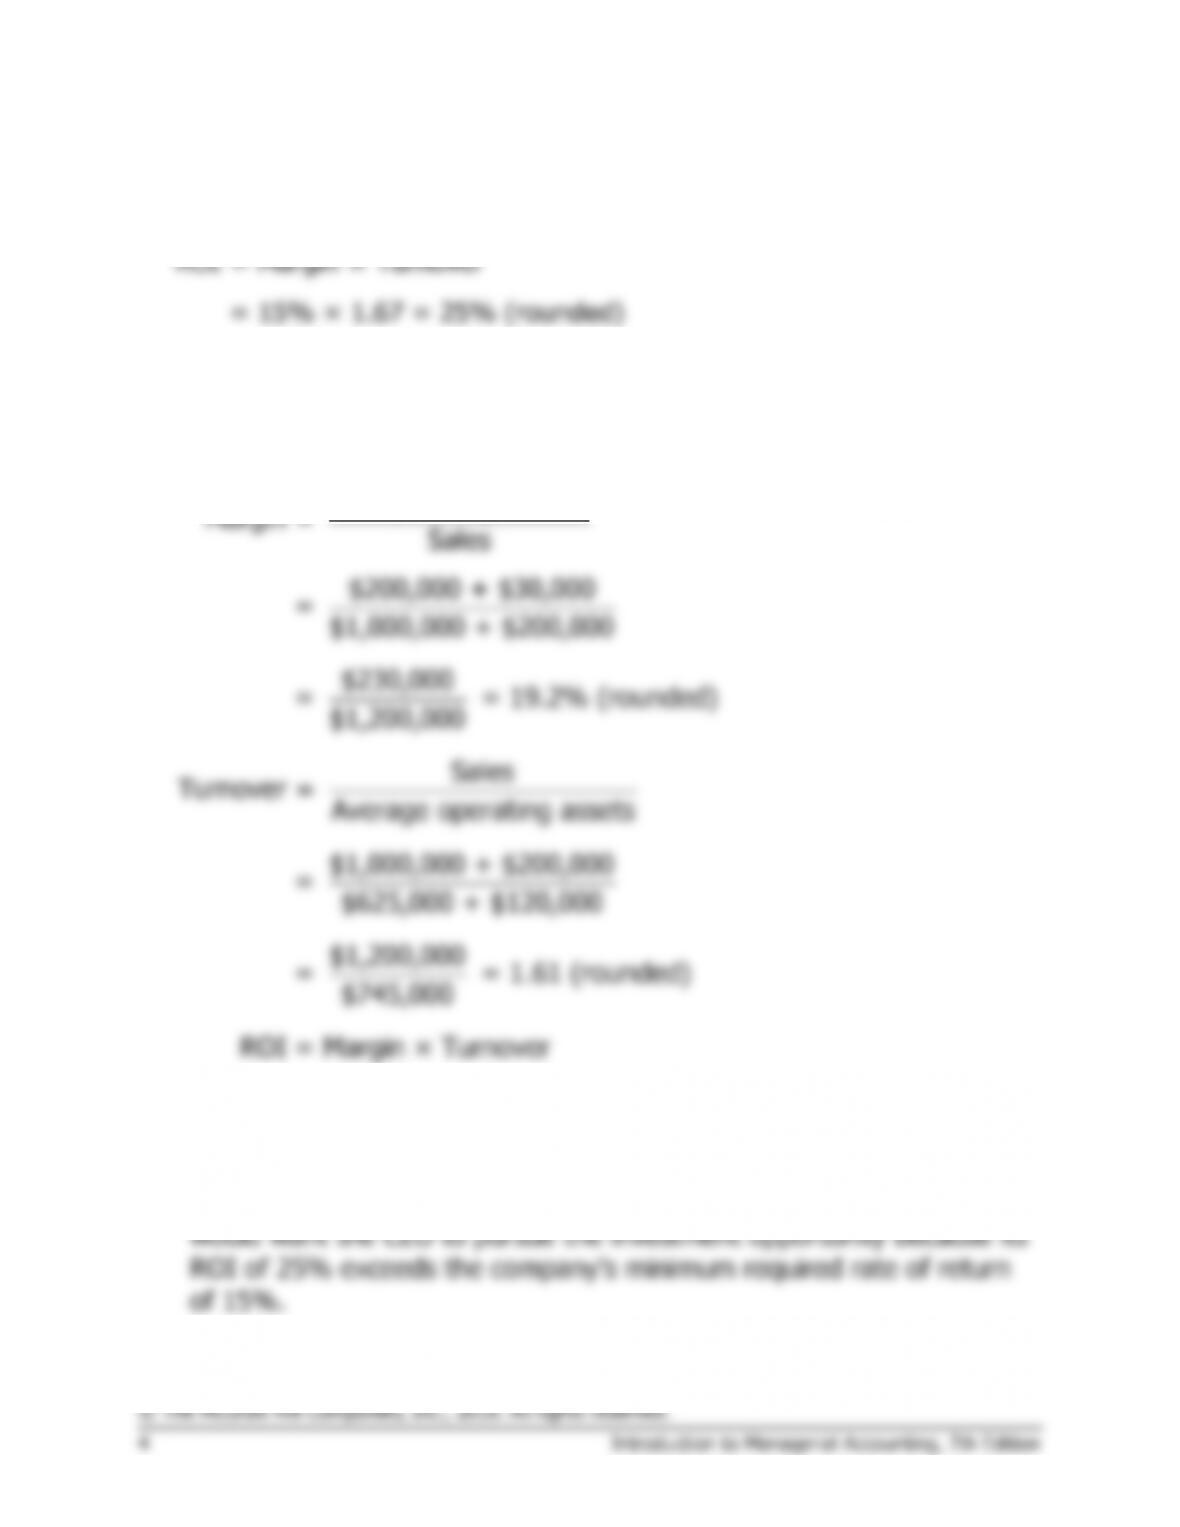
6. The ROI for this year’s investment opportunity is:
ROI = Margin × Turnover
= 15% × 1.67 = 25% (rounded)
7., 8., and 9.
If the company pursues the investment opportunity, this year’s margin,
turnover, and ROI would be:
Net operating income
Margin = Sales
$200,000 + $30,000
=
$1,000,000 + $200,000
$230,000
= = 19.2% (rounded)
$1,200,000
Sales
Turnover = Average operating assets
$1,000,000 + $200,000
= $625,000 + $120,000
The Foundational 15 (continued)
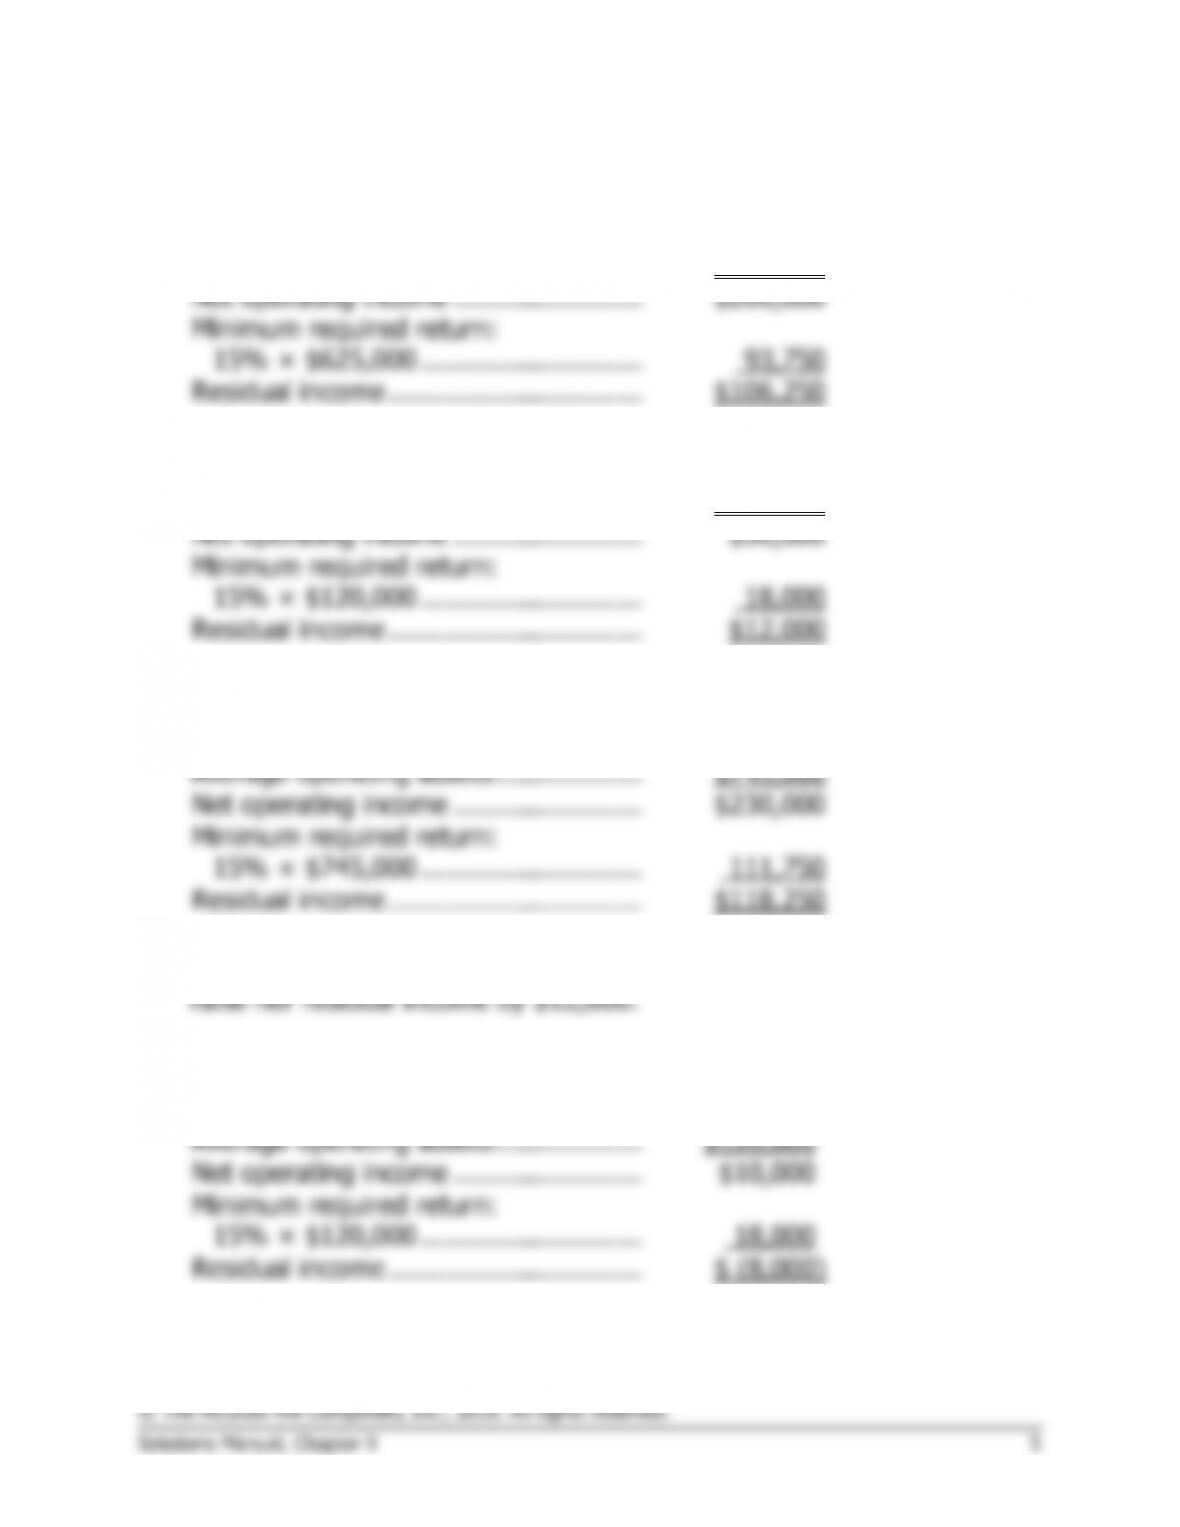
11. Last year’s residual income is:
Average operating assets ………………….
$625,000
Net operating income ………………………
$200,000
Minimum required return:
15% × $625,000 ………………………….
93,750
Residual income …………………………..
$106,250
12. The residual income for this year’s investment opportunity is:
Average operating assets ………………….
$120,000
Net operating income ………………………
$30,000
Minimum required return:
15% × $120,000 ………………………….
18,000
Residual income …………………………..
$12,000
13. If the company pursues the investment opportunity, this year’s
residual income will be:
Average operating assets ………………….
$745,000
Net operating income ………………………
$230,000
Minimum required return:
15% × $745,000 ………………………….
111,750
Residual income …………………………..
$118,250
14. The CEO would pursue the investment opportunity because it would
15. The CEO and the company would not want to pursue this investment
opportunity because it does not exceed the minimum required return:
Average operating assets ………………….
$120,000
Net operating income ………………………
$10,000
Minimum required return:
15% × $120,000 ………………………….
18,000
Residual income …………………………..
$ (8,000)
Exercise 9-1 (10 minutes)
1.
Net operating income
Margin = Sales
$600,000
= = 8%
$7,500,000
2.
Sales
Turnover = Average operating assets
$7,500,000
= = 1.5
$5,000,000
3.
ROI = Margin × Turnover
= 8% × 1.5 = 12%
Exercise 9-2 (10 minutes)
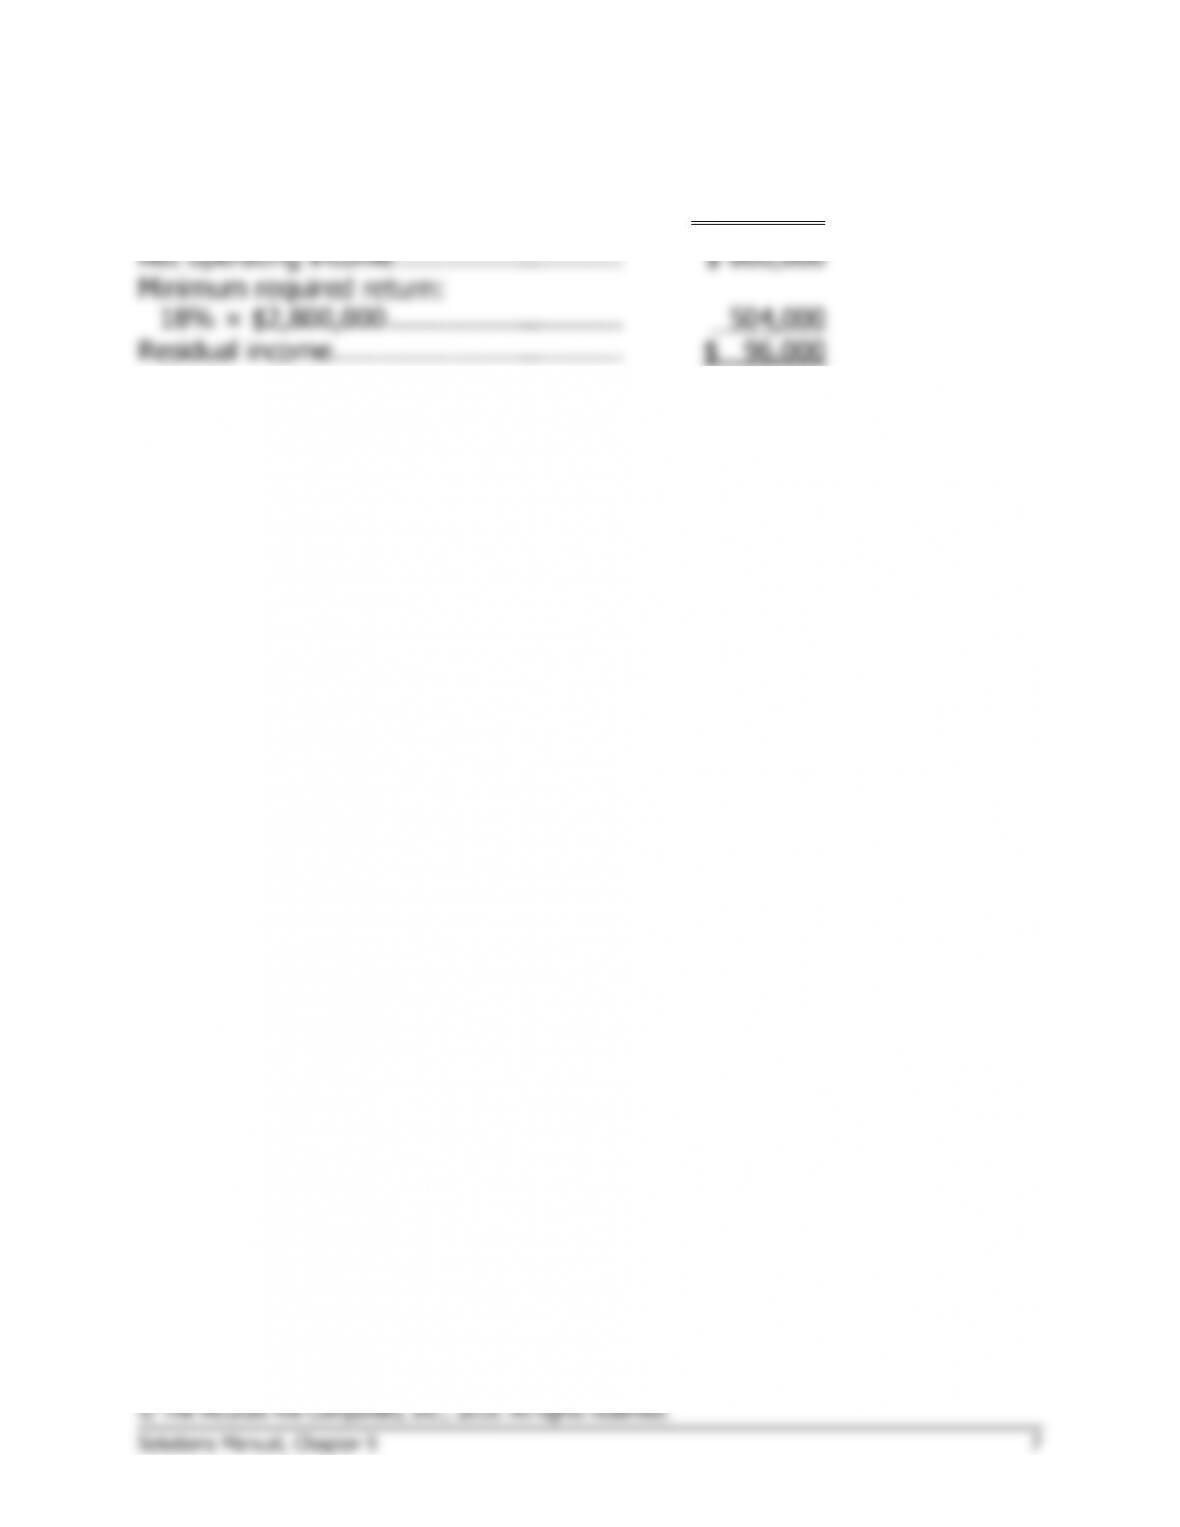
Average operating assets ………………….
$2,800,000
Net operating income ……………………….
$ 600,000
Minimum required return:
18% × $2,800,000 ………………………..
504,000
Residual income………………………………
$ 96,000
Exercise 9-3 (20 minutes)
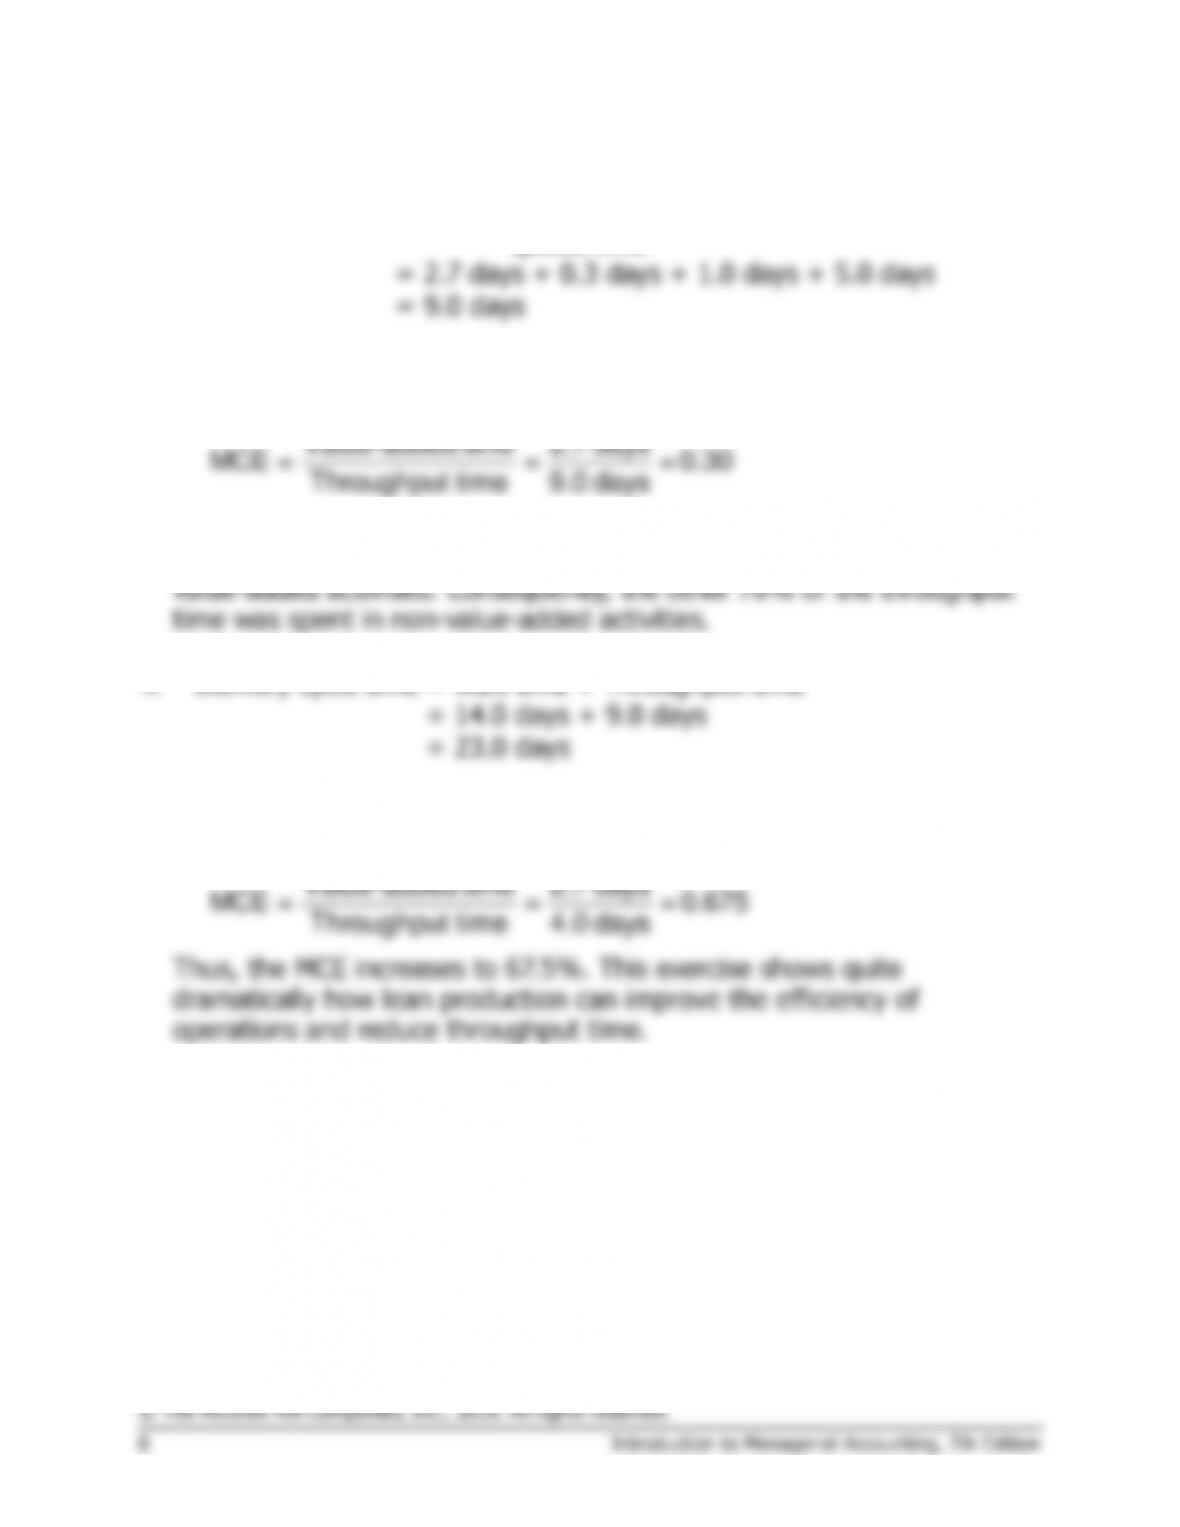
1.
Throughput time =
Process time + Inspection time + Move time +
Queue time
=
2.7 days + 0.3 days + 1.0 days + 5.0 days
=
9.0 days
2. Only process time is value-added time; therefore the manufacturing
cycle efficiency (MCE) is:
–Value added time 2.7 days
Throughput time 9.0 days
3. If the MCE is 30%, then 30% of the throughput time was spent in
4.
Delivery cycle time =
Wait time + Throughput time
=
14.0 days + 9.0 days
=
23.0 days
5. If all queue time is eliminated, then the throughput time drops to only 4
days (2.7 + 0.3 + 1.0). The MCE becomes:
–Value added time 2.7 days
© The McGraw-Hill Companies, Inc., 2016. All rights reserved.
+
+
+
+
Financial
Customer
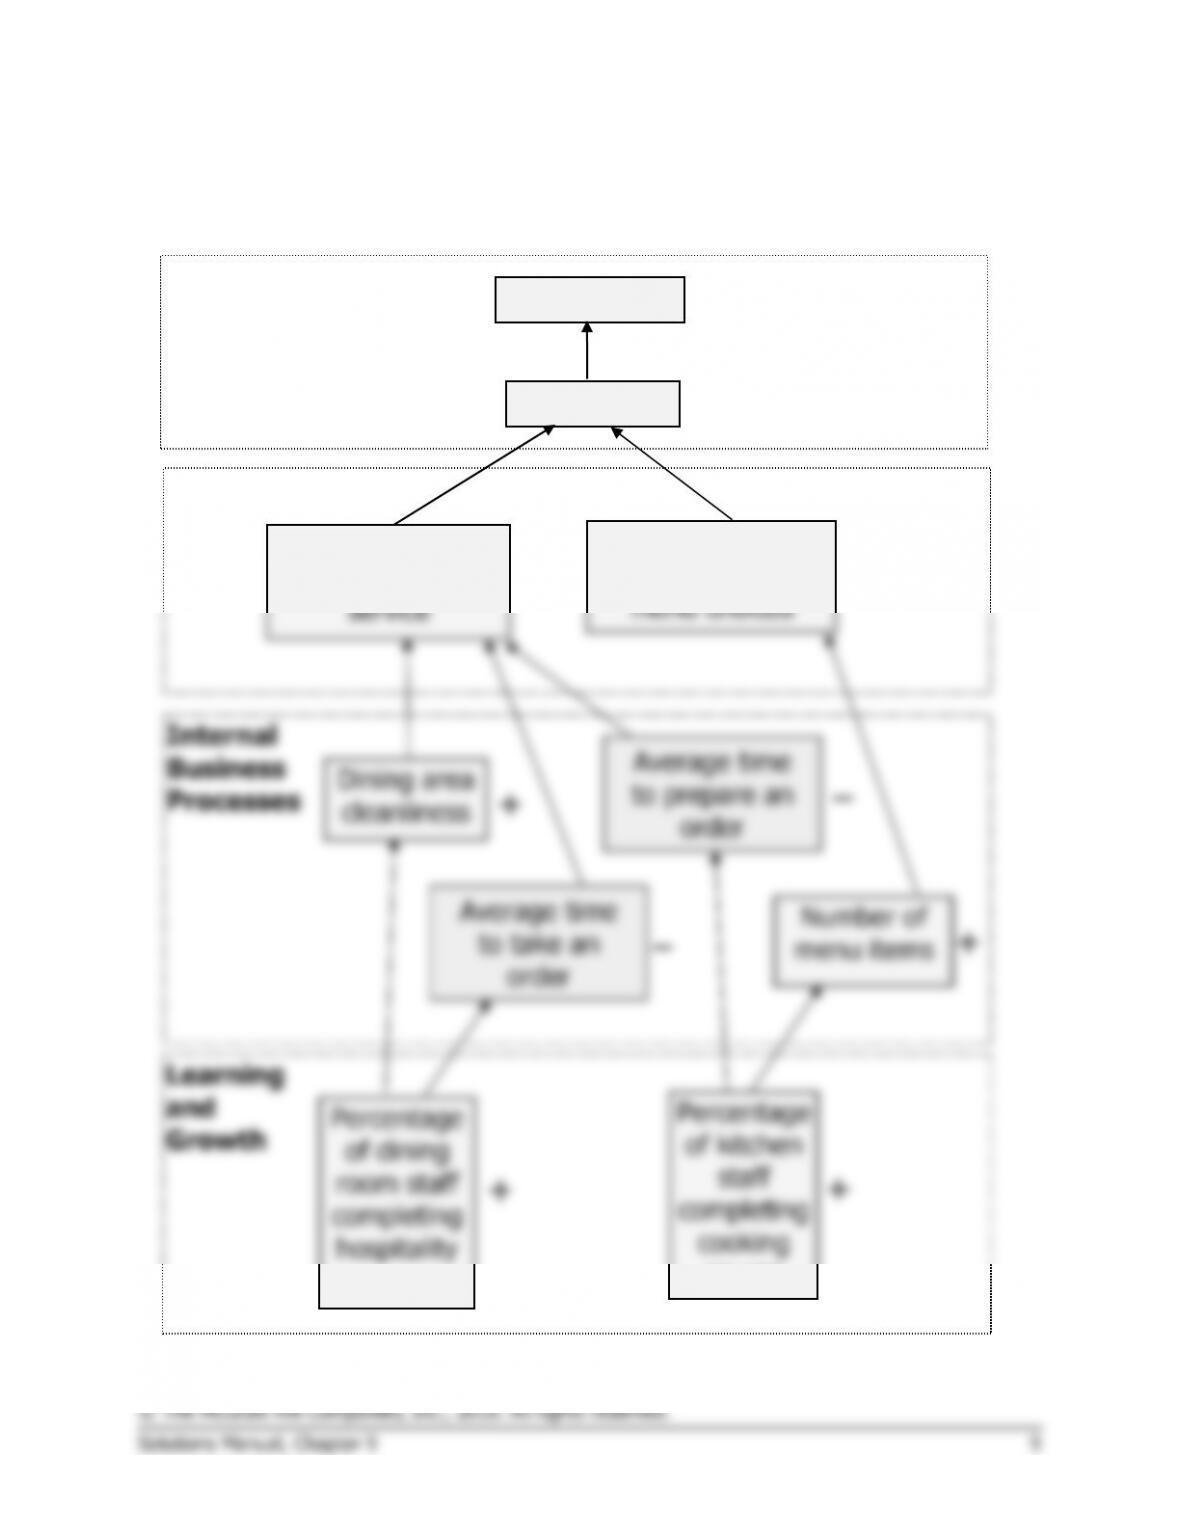
Exercise 9-4 (45 minutes)
1. Students’ answers may differ in some details from this solution.
Weekly profit
Weekly sales
course
+
+
Customer
satisfaction with
service
Customer
satisfaction with
menu choices
+
+
course
Exercise 9-4 (continued)
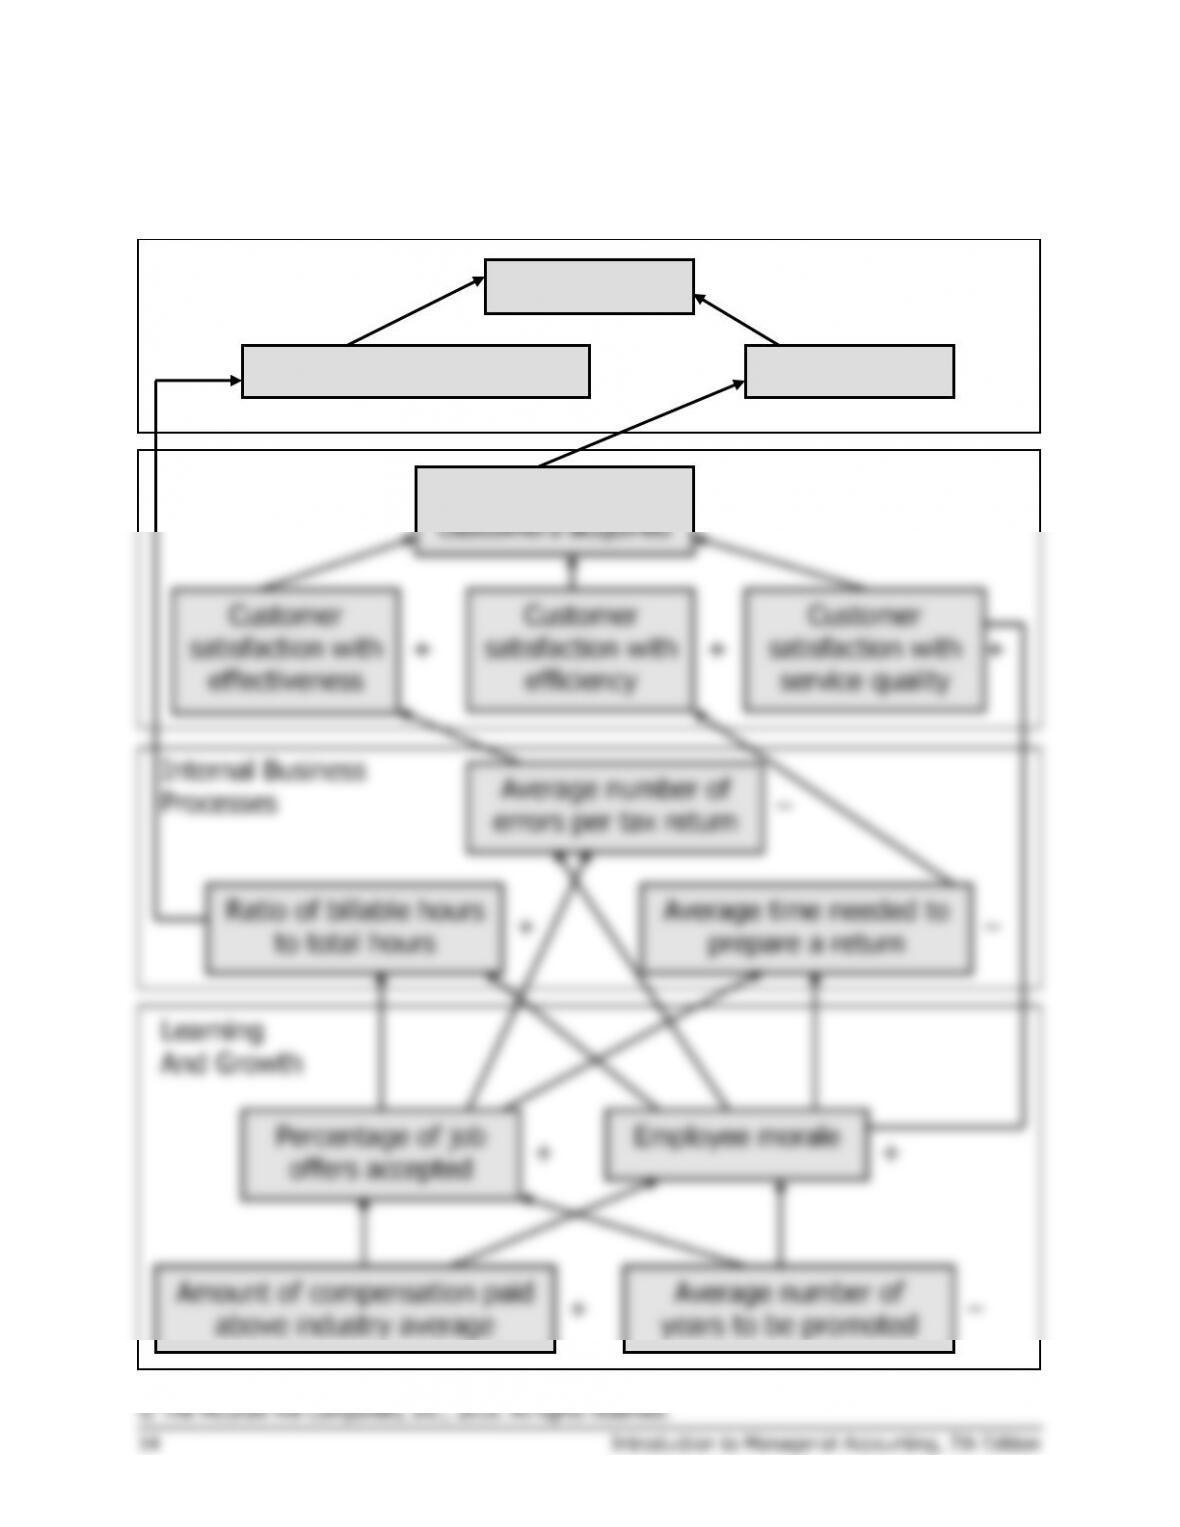
2. The hypotheses underlying the balanced scorecard are indicated by the
arrows in the diagram. Reading from the bottom of the balanced
scorecard, the hypotheses are:
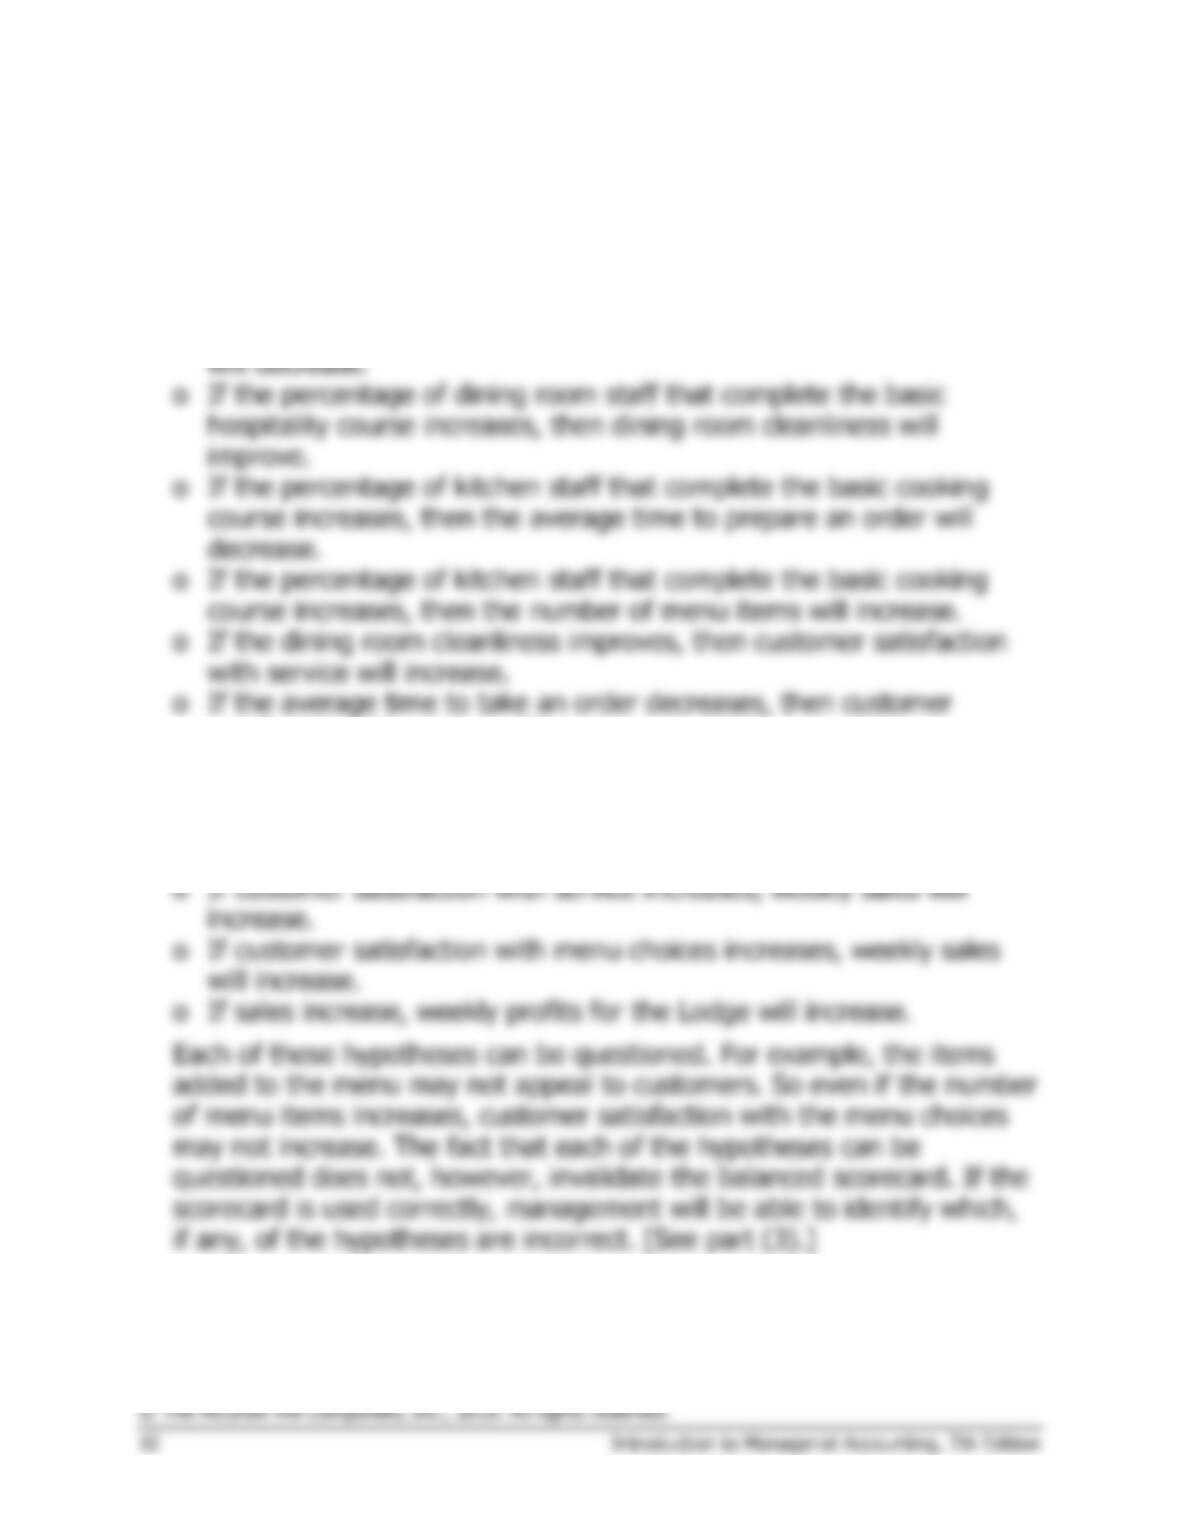
o If the percentage of dining room staff that complete the basic
hospitality course increases, then the average time to take an order
satisfaction with service will increase.
o If the average time to prepare an order decreases, then customer
satisfaction with service will increase.
o If the number of menu items increases, then customer satisfaction
with menu choices will increase.
Exercise 9-4 (continued)
3. Management will be able to tell if a hypothesis is false if an
improvement in a performance measure at the bottom of an arrow does
Exercise 9-5 (15 minutes)
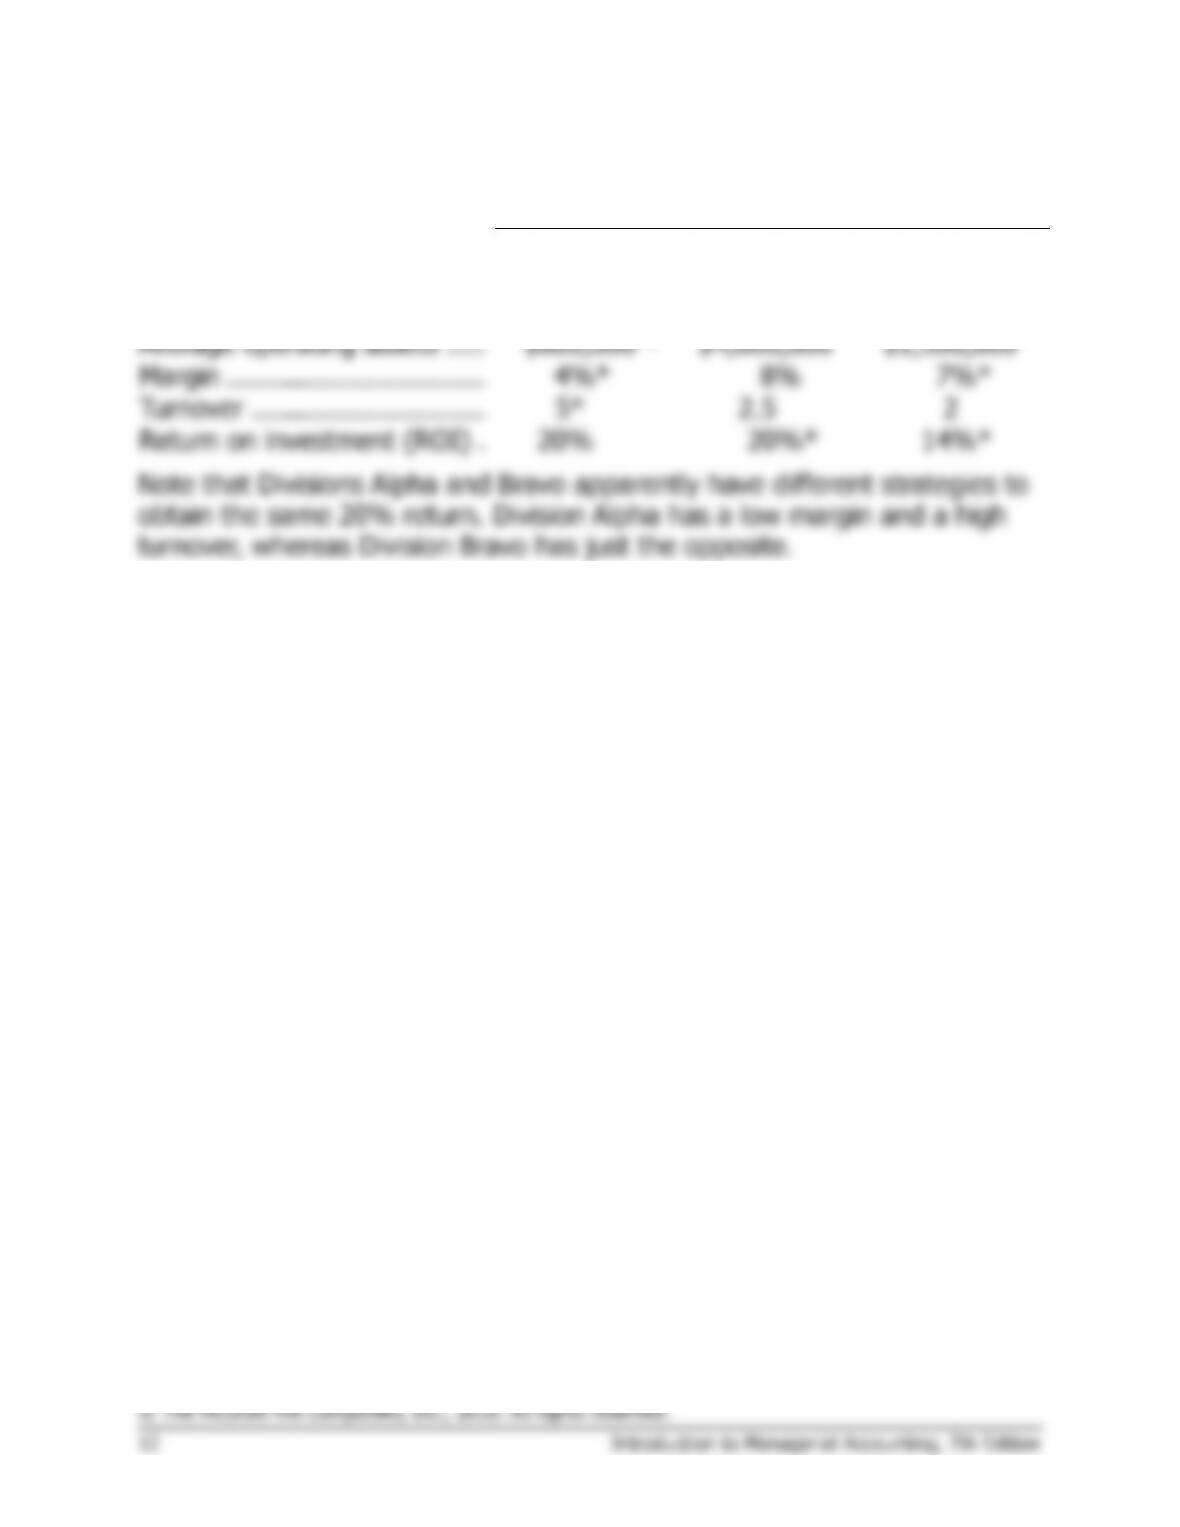
Division
Alpha
Bravo
Charlie
Sales ……………………………..
$4,000,000
$11,500,000
*
$3,000,000
Net operating income ………..
$160,000
$920,000
*
$210,000
*
Average operating assets …..
$800,000
*
$4,600,000
$1,500,000
Margin …………………………..
4%*
8%
7%*
Turnover ………………………..
5*
2.5
2
Return on investment (ROI) .
20%
20%*
14%*
*Given.
Exercise 9-6 (20 minutes)
1. ROI computations:
Net operating income Sales
ROI = ×
Sales Average operating assets
$9,000,000 $4,000,000
2.
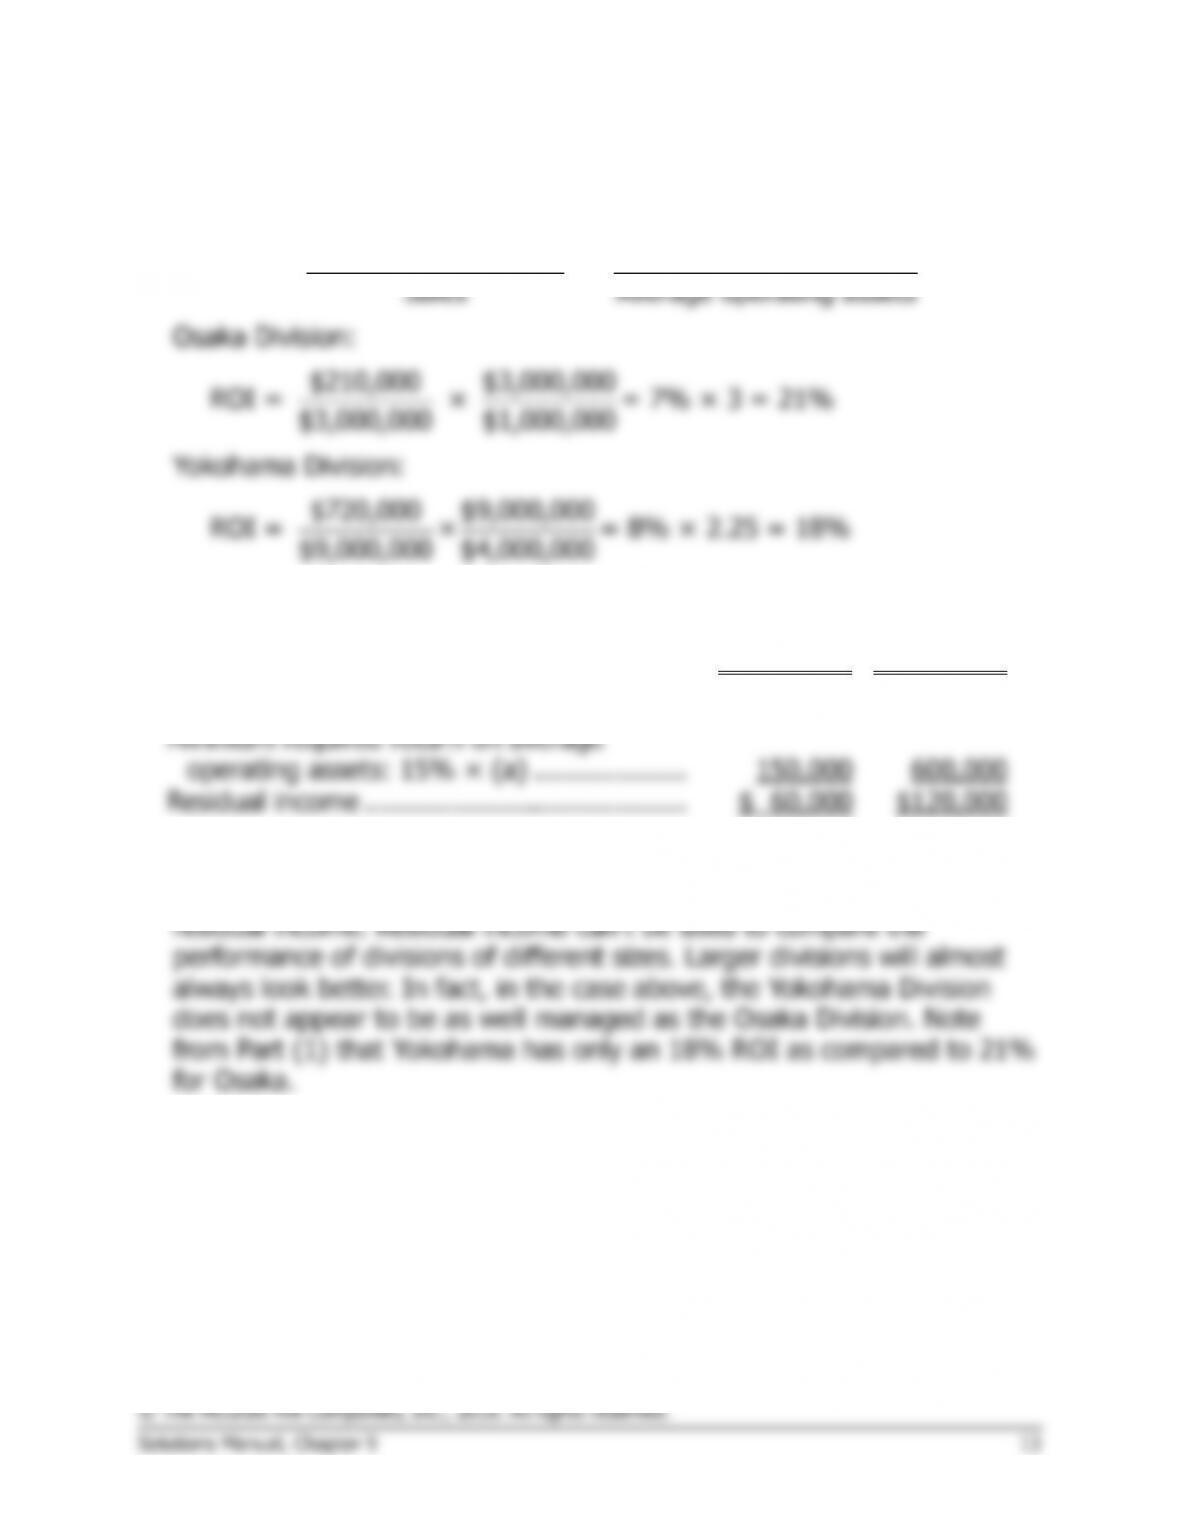
Osaka
Yokohama
Average operating assets (a) ………………….
$1,000,000
$4,000,000
Net operating income …………………………..
$210,000
$720,000
Minimum required return on average
operating assets: 15% × (a) ……………….
150,000
600,000
Residual income ………………………………….
$ 60,000
$120,000
3. No, the Yokohama Division is simply larger than the Osaka Division and
for this reason one would expect that it would have a greater amount of
Exercise 9-7 (45 minutes)
1. Students’ answers may differ in some details from this solution.
+
+
+
+
+
+
+
Revenue per employee
Sales
Profit margin
Financial
above industry average
years to be promoted
Customer
Number of new
customers acquired
+
+
+
+
Exercise 9-7 (continued)
2. The hypotheses underlying the balanced scorecard are indicated by the
arrows in the diagram. Reading from the bottom of the balanced
scorecard, the hypotheses are:
° If the amount of compensation paid above the industry average
increases, then the percentage of job offers accepted and the level of
return and the average time needed to prepare a return should
decrease.
° If employee morale increases, then the customer satisfaction with
service quality should increase.
° If the ratio of billable hours to total hours increases, then the revenue
per employee should increase.
Exercise 9-7 (continued)
Each of these hypotheses can be questioned. For example, Ariel’s
customers may define effectiveness as minimizing their tax liability
which is not necessarily the same as minimizing the number of errors in
3. The performance measure “total dollar amount of tax refunds
generated” would motivate Ariel’s employees to aggressively search for
tax minimization opportunities for its clients. However, employees may
be too aggressive and recommend questionable or illegal tax practices
Exercise 9-7 (continued)
4. Each office’s individual performance should be based on the scorecard
measures only if the measures are controllable by those employed at
the branch offices. In other words, it would not make sense to attempt
Exercise 9-8 (15 minutes)
1. ROI computations:
Net operating income Sales
ROI = ×
Sales Average operating assets
$7,000,000 $2,000,000
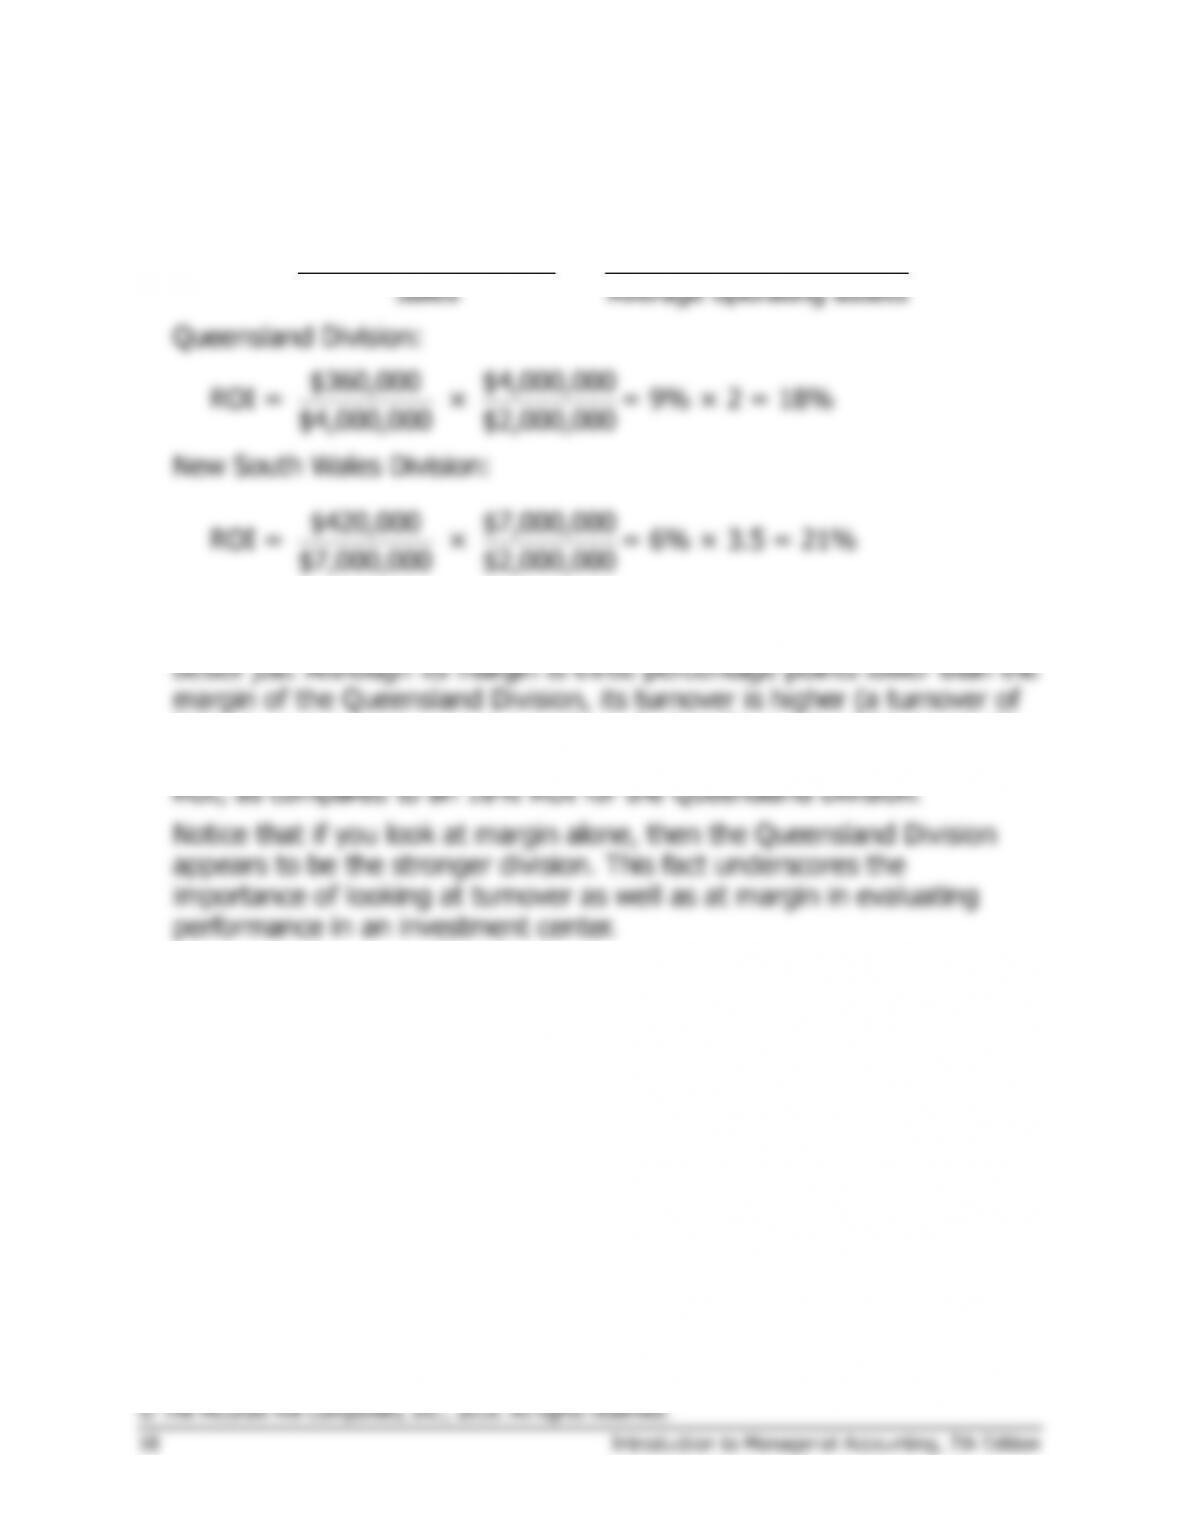
2. The manager of the New South Wales Division seems to be doing the
3.5, as compared to a turnover of two for the Queensland Division). The
greater turnover more than offsets the lower margin, resulting in a 21%
Exercise 9-9 (15 minutes)
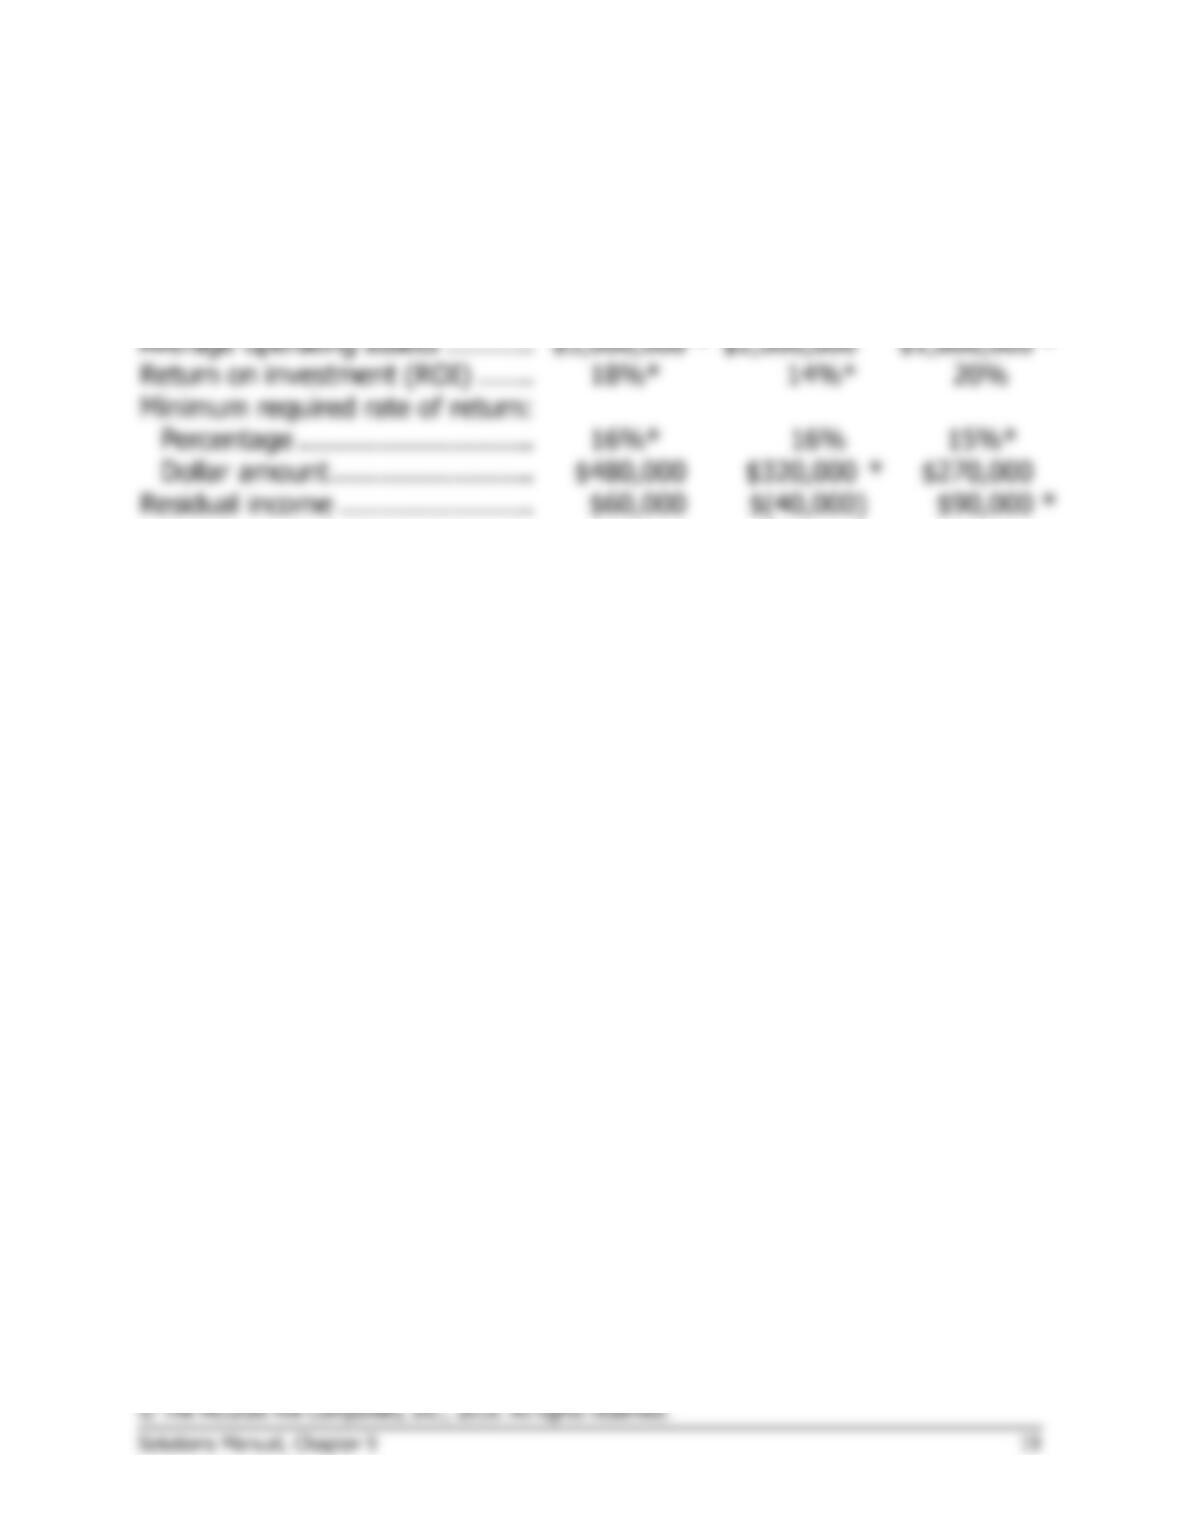
Company A
Company B
Company C
Sales …………………………………..
$9,000,000
*
$7,000,000
*
$4,500,000
*
Net operating income ……………..
$540,000
$280,000
*
$360,000
Average operating assets ………..
$3,000,000
*
$2,000,000
$1,800,000
*
Return on investment (ROI) …….
18%*
14%*
20%
Minimum required rate of return:
Percentage ………………………..
16%*
16%
15%*
Dollar amount …………………….
$480,000
$320,000
*
$270,000
Residual income ……………………
$60,000
$(40,000)
$90,000
*
*Given.
Exercise 9-10 (20 minutes)
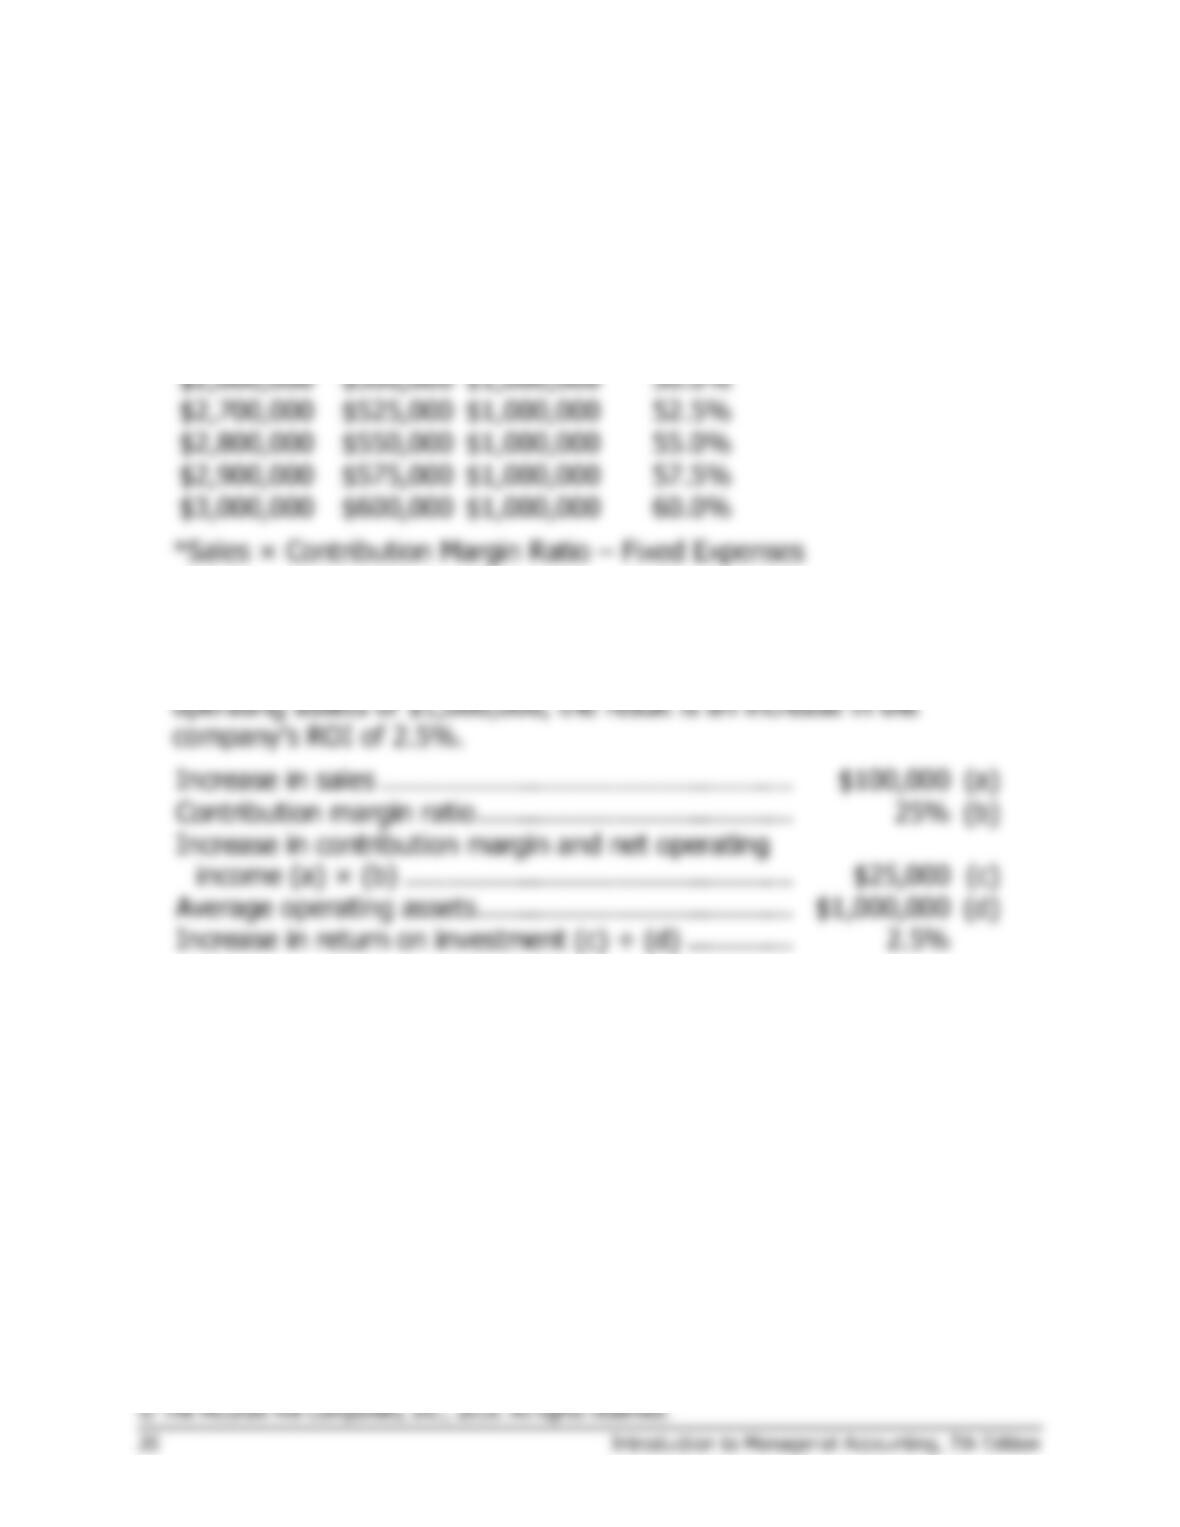
1.
(b)
(c)
Net
Average
(a)
Operating
Operating
ROI
Sales
Income*
Assets
(b) ÷ (c)
$2,500,000
$475,000
$1,000,000
47.5%
$2,600,000
$500,000
$1,000,000
50.0%
$2,700,000
$525,000
$1,000,000
52.5%
$2,800,000
$550,000
$1,000,000
55.0%
$2,900,000
$575,000
$1,000,000
57.5%
$3,000,000
$600,000
$1,000,000
60.0%
*Sales × Contribution Margin Ratio – Fixed Expenses
2. The ROI increases by 2.5% for each $100,000 increase in sales. This
happens because each $100,000 increase in sales brings in an additional
profit of $25,000. When this additional profit is divided by the average
Increase in sales ……………………………………………
$100,000
(a)
Contribution margin ratio …………………………………
25%
(b)
Increase in contribution margin and net operating
income (a) × (b) …………………………………………
$25,000
(c)
Average operating assets …………………………………
$1,000,000
(d)
Increase in return on investment (c) ÷ (d) ………….
2.5%