Problem 9-14B (30 minutes)
1.
Present
New Line
Total
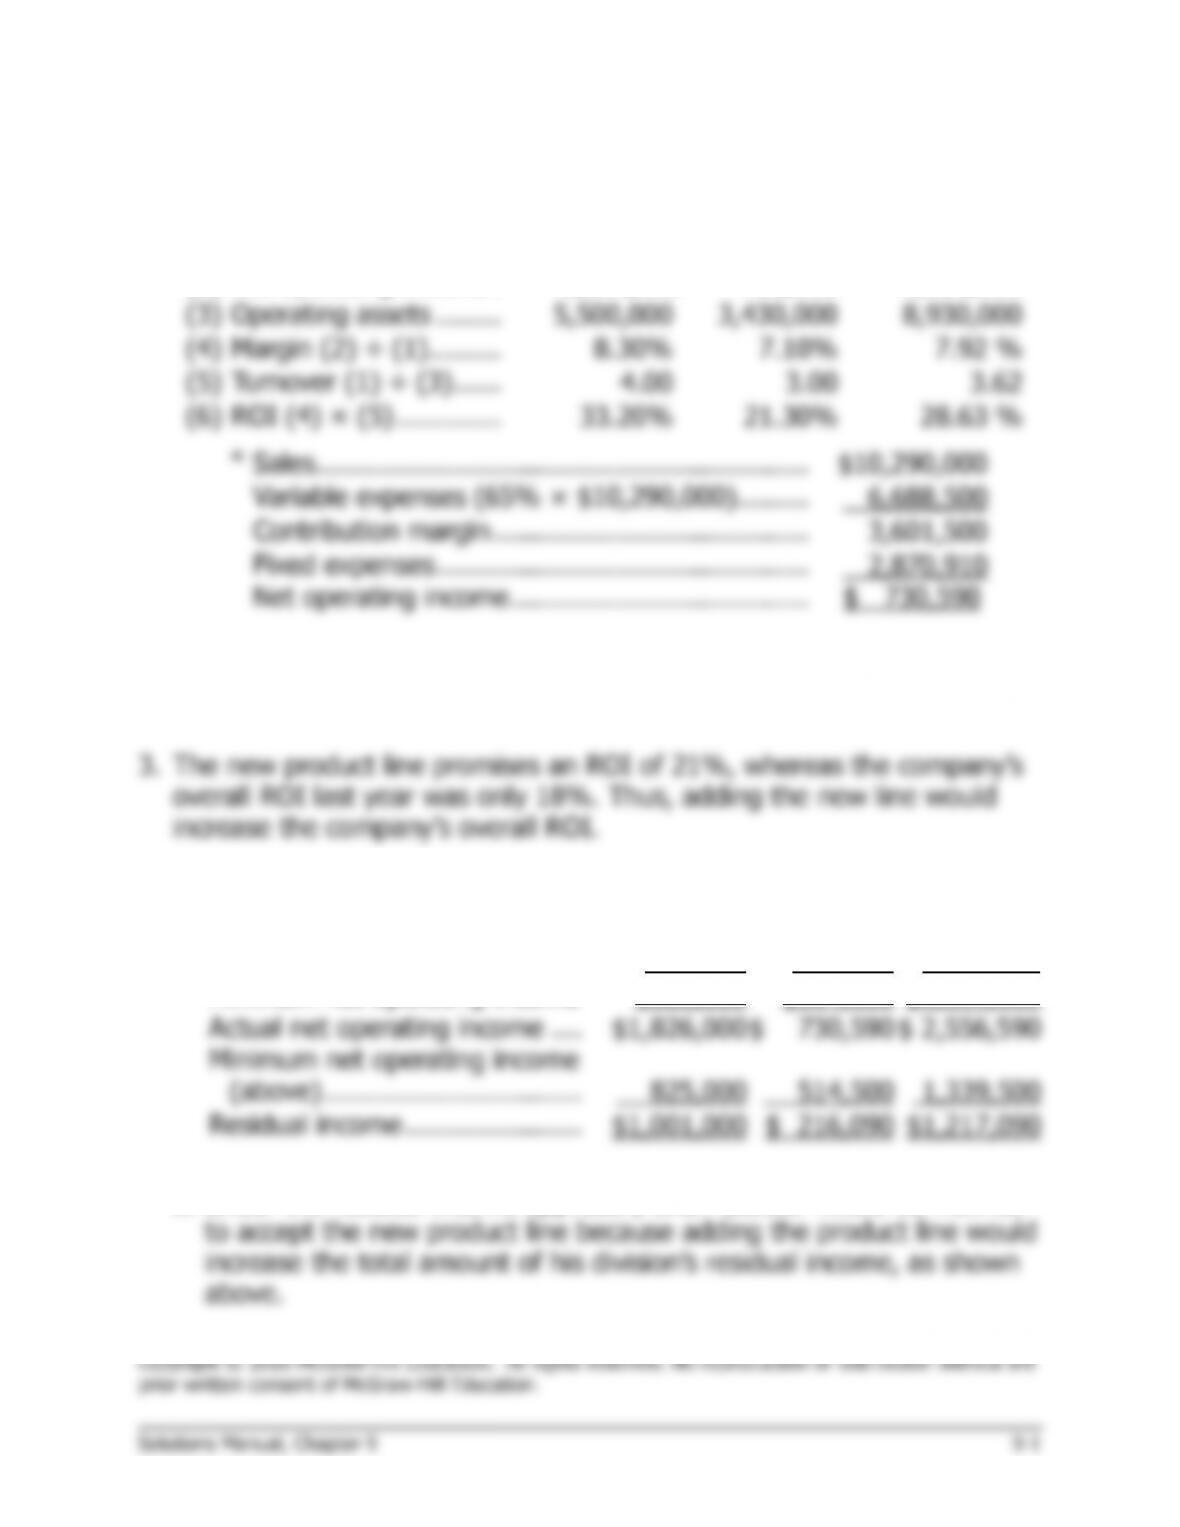
(1)
Sales …………………….
$22,000,000
$10,290,000
$32,290,000
(2)
Net operating income .
1,826,000
730,590
*
2,556,590
(3)
Operating assets ……..
5,500,000
3,430,000
8,930,000
(4)
Margin (2) ÷ (1) ………
8.30%
7.10%
7.92 %
(5)
Turnover (1) ÷ (3) ……
4.00
3.00
3.62
(6)
ROI (4) × (5) ………….
33.20%
21.30%
28.63 %
*
Sales …………………………………………………….
$10,290,000
Variable expenses (65% × $10,290,000)………
6,688,500
Contribution margin …………………………………
3,601,500
Fixed expenses ……………………………………….
2,870,910
Net operating income ……………………………….
$ 730,590
2. Brian Stettler will be inclined to reject the new product line because
accepting it would reduce his division’s overall rate of return.
4.
a.
Present
New Line
Total
Operating assets …………………
$5,500,000
$3,430,000
$8,930,000
Minimum required return ………
×15 %
×15 %
×15 %
Minimum net operating income
$825,000
$514,500
$1,339,500
Actual net operating income ….
$1,826,000
$ 730,590
$ 2,556,590
Minimum net operating income
(above) …………………………..
825,000
514,500
1,339,500
Residual income ………………….
$1,001,000
$ 216,090
$1,217,090
b. Under the residual income approach, Brian Stettler would be inclined
Problem 9-15B (30 minutes)
1. Breaking the ROI computation into two separate elements helps the
manager to see important relationships that might remain hidden. First,
the importance of turnover of assets as a key element to overall
profitability is emphasized. Prior to use of the ROI formula, managers
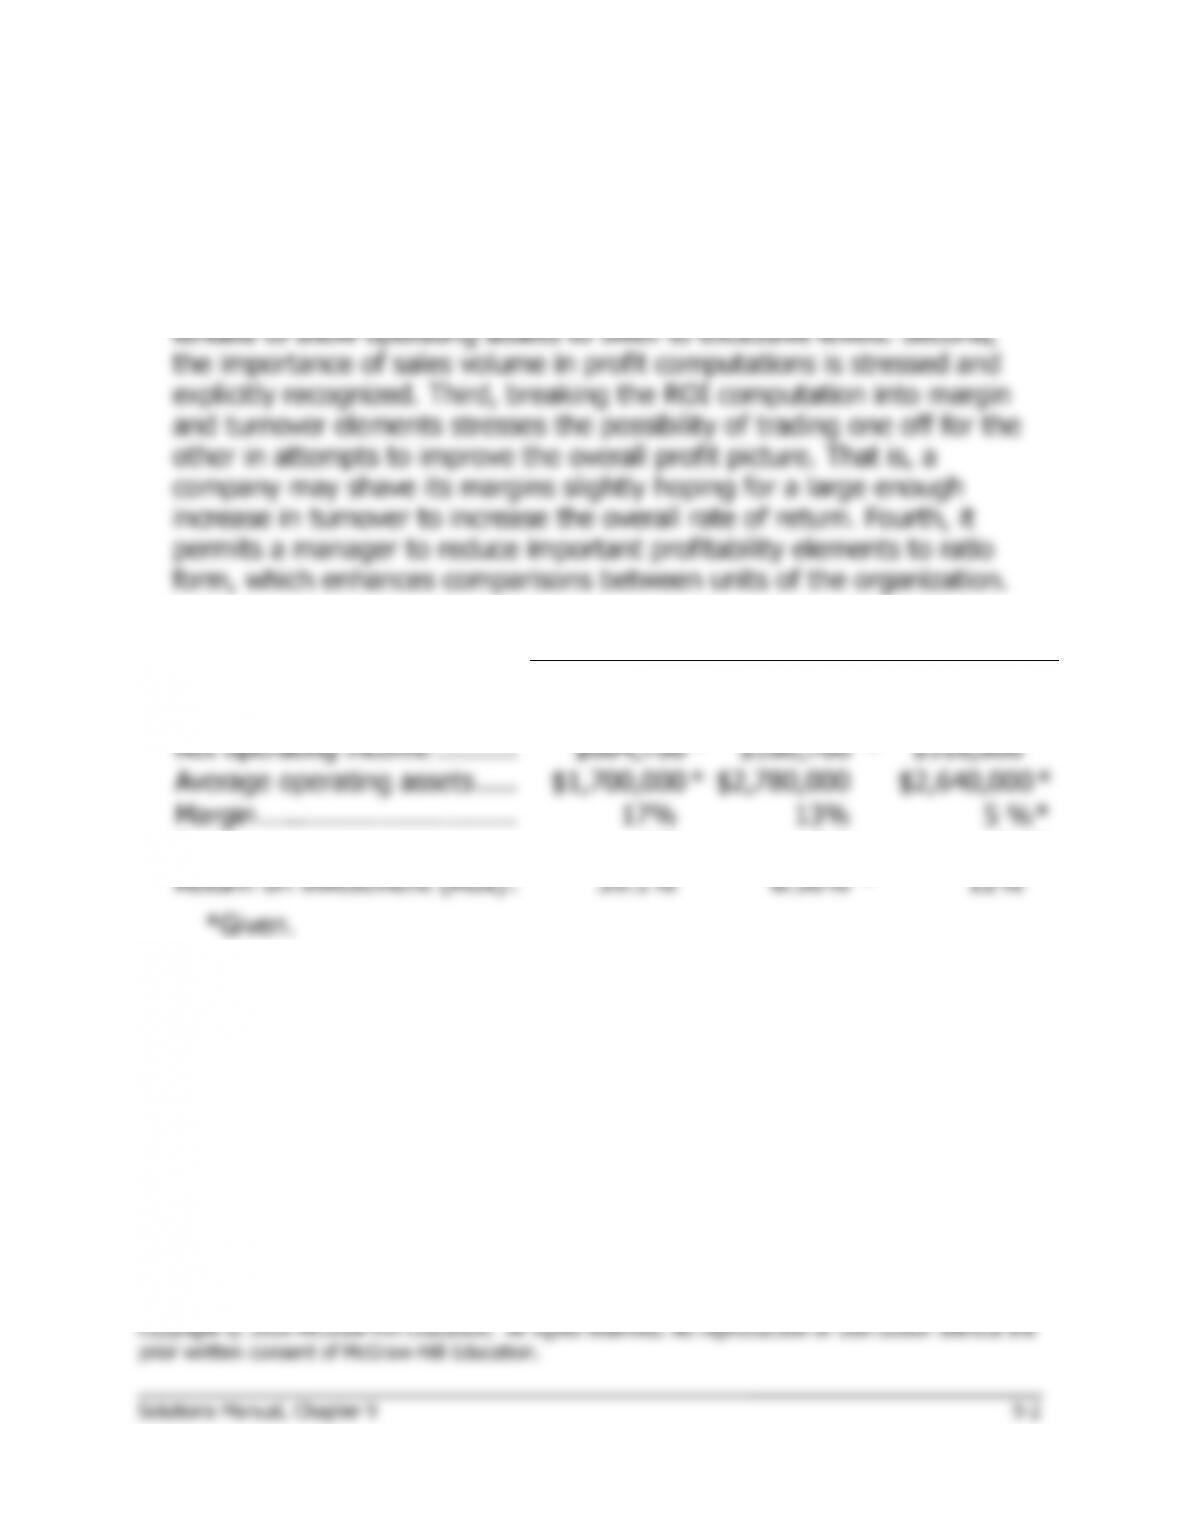
2.
Companies in the Same Industry
X
Y
Z
Sales …………………………….
$3,910,000
*
$1,390,000
*
$6,336,000
Net operating income ……….
$664,700
*
$180,700
*
$316,800
Average operating assets …..
$1,700,000
*
$2,780,000
$2,640,000
*
Margin …………………………..
17%
13%
5 %
*
Turnover ………………………..
2.3
0.5
2.4
*
Return on investment (ROI) .
39.1%
6.50%
*
12%
Problem 9-15B (continued)
NAA Report No. 35
states (p. 35): “Introducing sales to measure level of
operations helps to disclose specific areas for more intensive
investigation.”
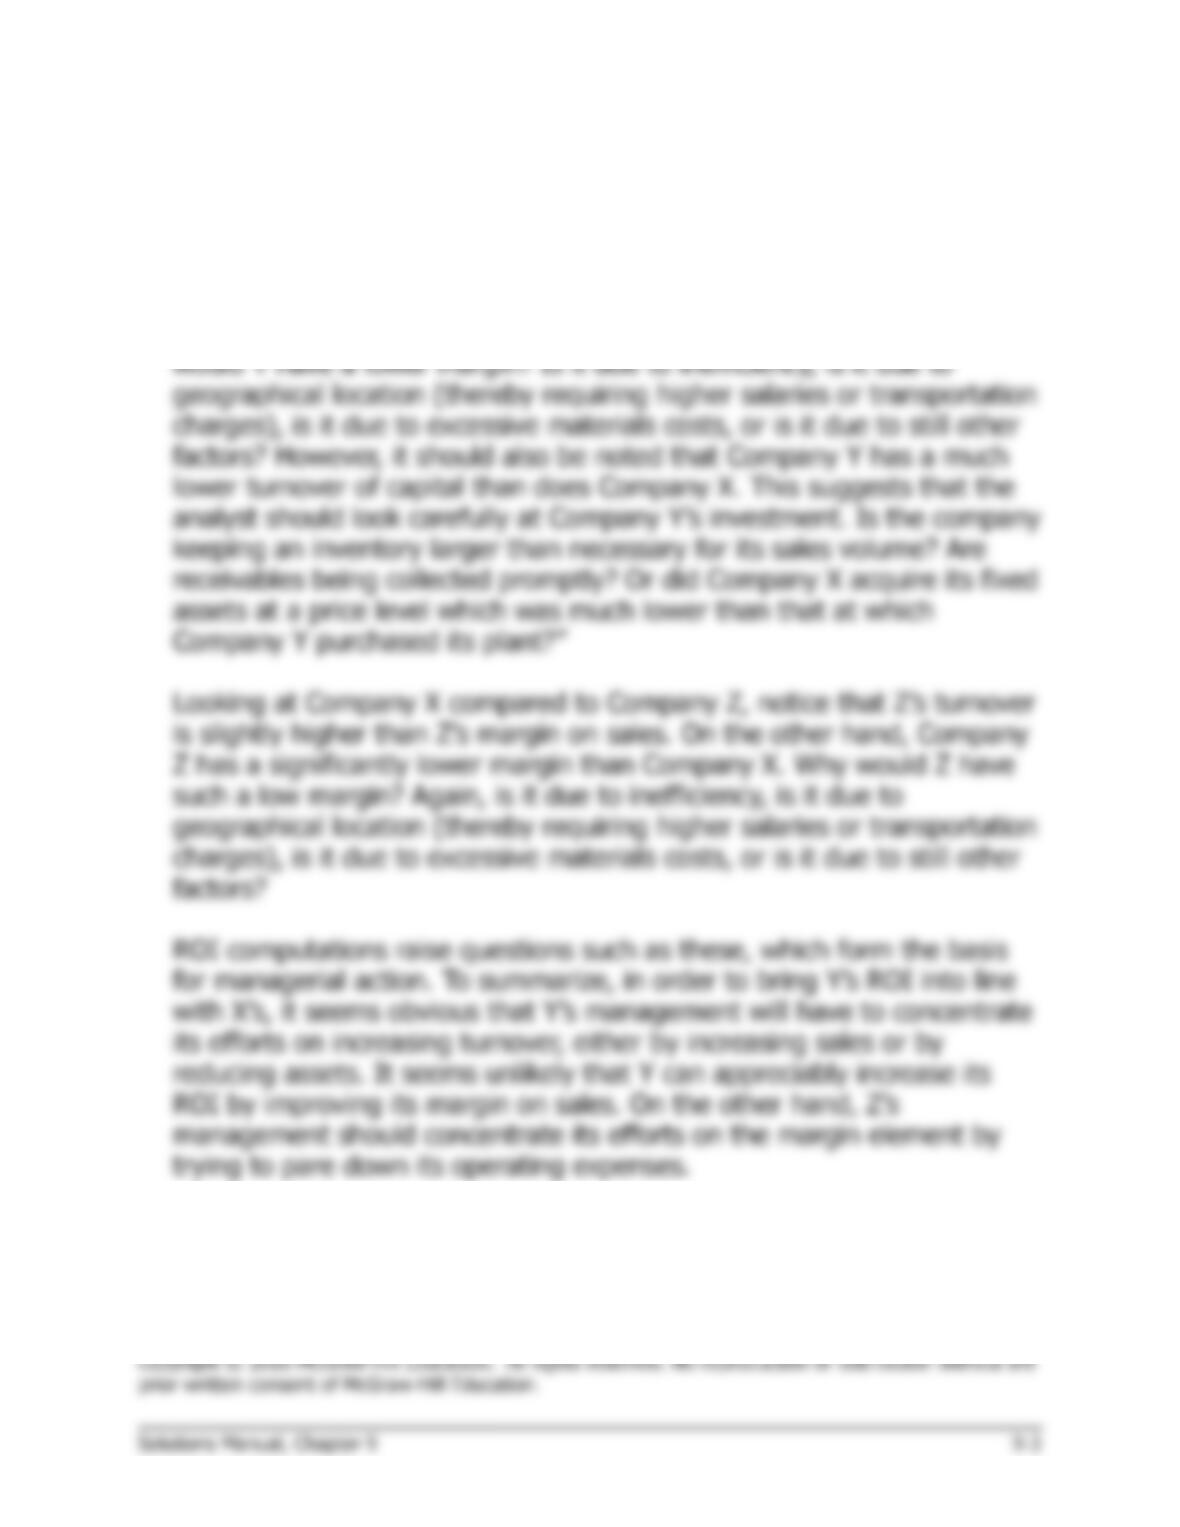
Company Y’s margin is somewhat lower than that of Company X. Why
Process time ÷ Throughput time …..
Delivery cycle time in days:
Wait time ………………………………..
Total throughput time …………………
Total delivery cycle time ……………..
Problem 9-16B (30 minutes)
1. a., b., and c.
Month
1
2
3
4
Throughput time in days:
Process time …………………………....
0.5
0.8
0.7
0.6
Inspection time …………………………
0.6
0.7
0.5
0.5
Move time ……………………………….
0.5
0.7
0.5
0.3
Queue time ……………………………..
3.0
3.0
2.0
1.0
Total throughput time …………………
4.6
5.2
3.7
2.4
Problem 9-16B (continued)
3. a. and b.
Month
5
6
Throughput time in days:
Process time …………………………..……..
0.6
0.6
Inspection time ………………………………
0.5
Move time …………………………………….
0.3
0.3
Queue time …………………………………..
Total throughput time ………………………
1.4
0.9
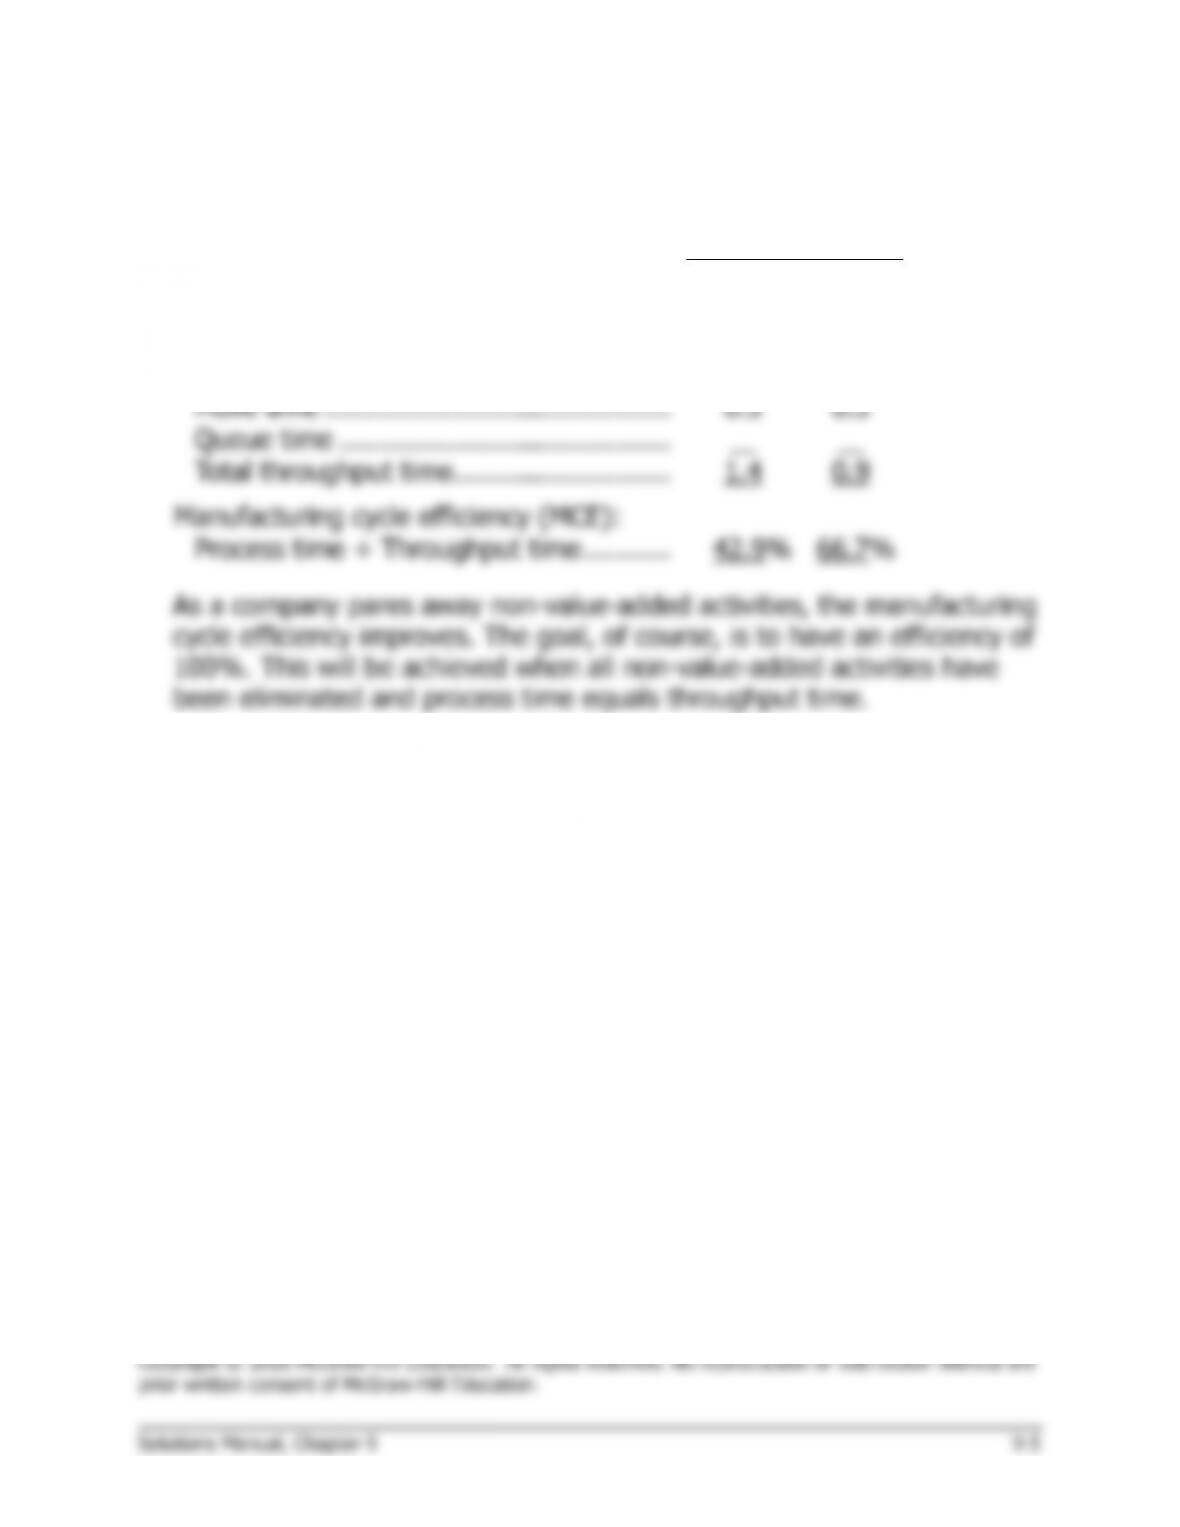
Manufacturing cycle efficiency (MCE):
Process time ÷ Throughput time ………..
42.9%
66.7%
As a company pares away non-value-added activities, the manufacturing
cycle efficiency improves. The goal, of course, is to have an efficiency of
100%. This will be achieved when all non-value-added activities have
been eliminated and process time equals throughput time.
=
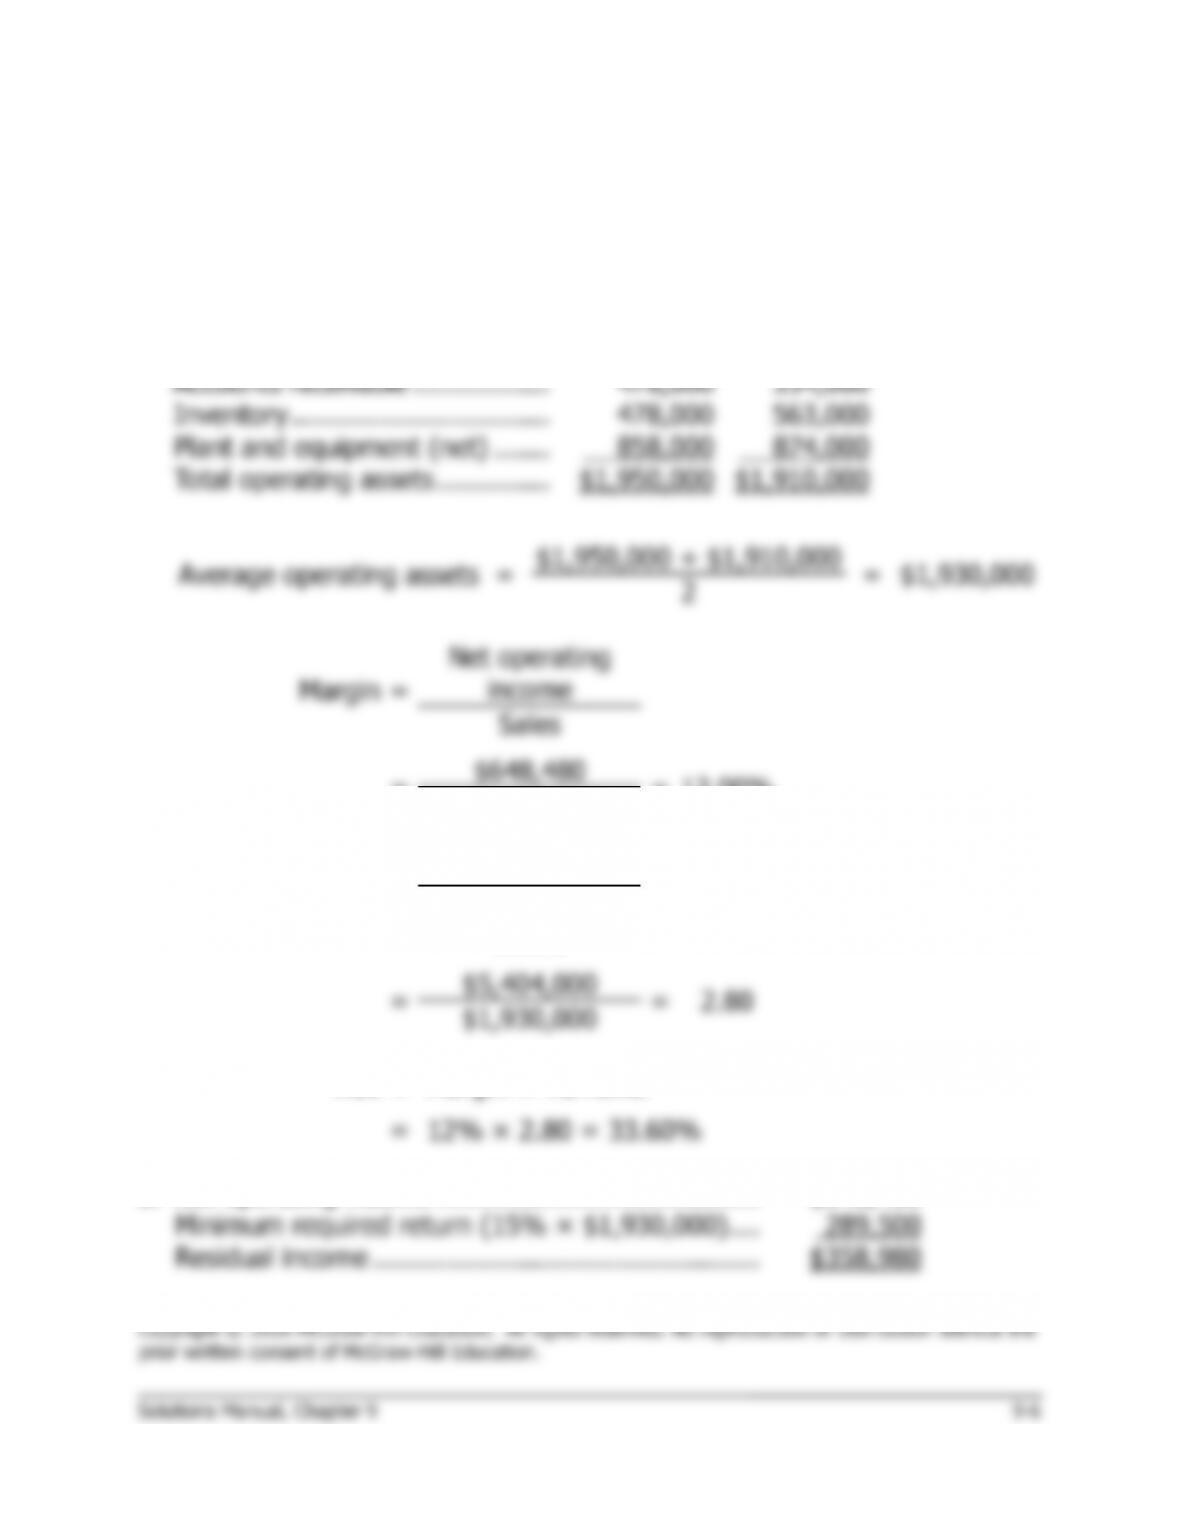
12% × 2.80 = 33.60%
Net operating income ………………………………….
Minimum required return (15% × $1,930,000) ….
Residual income …………………………………………
Problem 9-17B (20 minutes)
1. Operating assets do not include investments in other companies or in
undeveloped land.
Ending
Balances
Beginning
Balances
Cash …………………………………
$ 136,000
$ 139,000
Accounts receivable ……………..
478,000
334,000
Inventory …………………………..
478,000
563,000
Plant and equipment (net) …….
858,000
874,000
Total operating assets …………..
$1,950,000
$1,910,000
Average operating assets
=
$1,950,000 + $1,910,000
=
$1,930,000
2
Margin
=
Net operating
income
Sales
=
$648,480
=
12.00%
$5,404,000
Turnover
=
Sales
Average operating
assets
=
$5,404,000
=
2.80
$1,930,000
ROI
=
Margin × Turnover

16.71%
18.91%
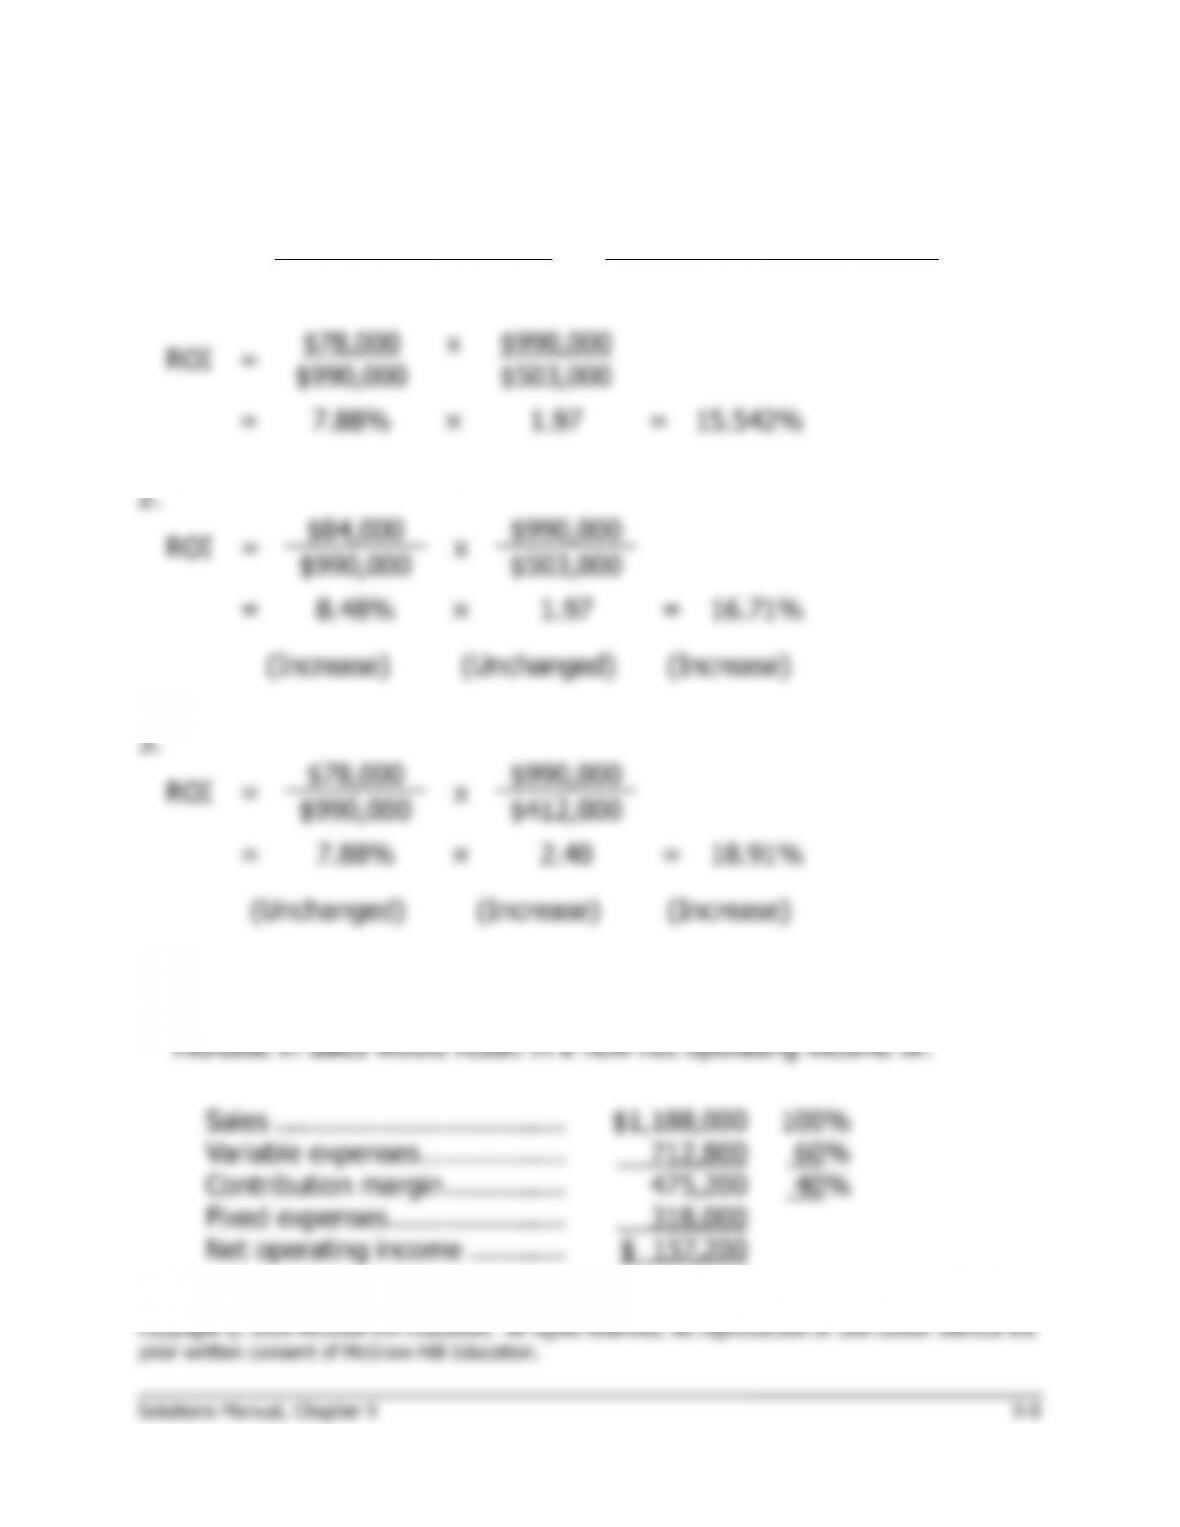
Problem 9-18B (30 minutes)
1.
ROI
=
Net operating income
x
Sales
Sales
Average operating assets
ROI
=
$78,000
x
$990,000
$990,000
$503,000
=
7.88%
×
1.97
=
15.542%
Problem 9-18B (continued)
ROI
=
$157,200
x
$1,188,000
$1,188,000
$503,000
=
13.23%
×
2.36
=
31.22%
(Increase)
(Increase)
(Increase)
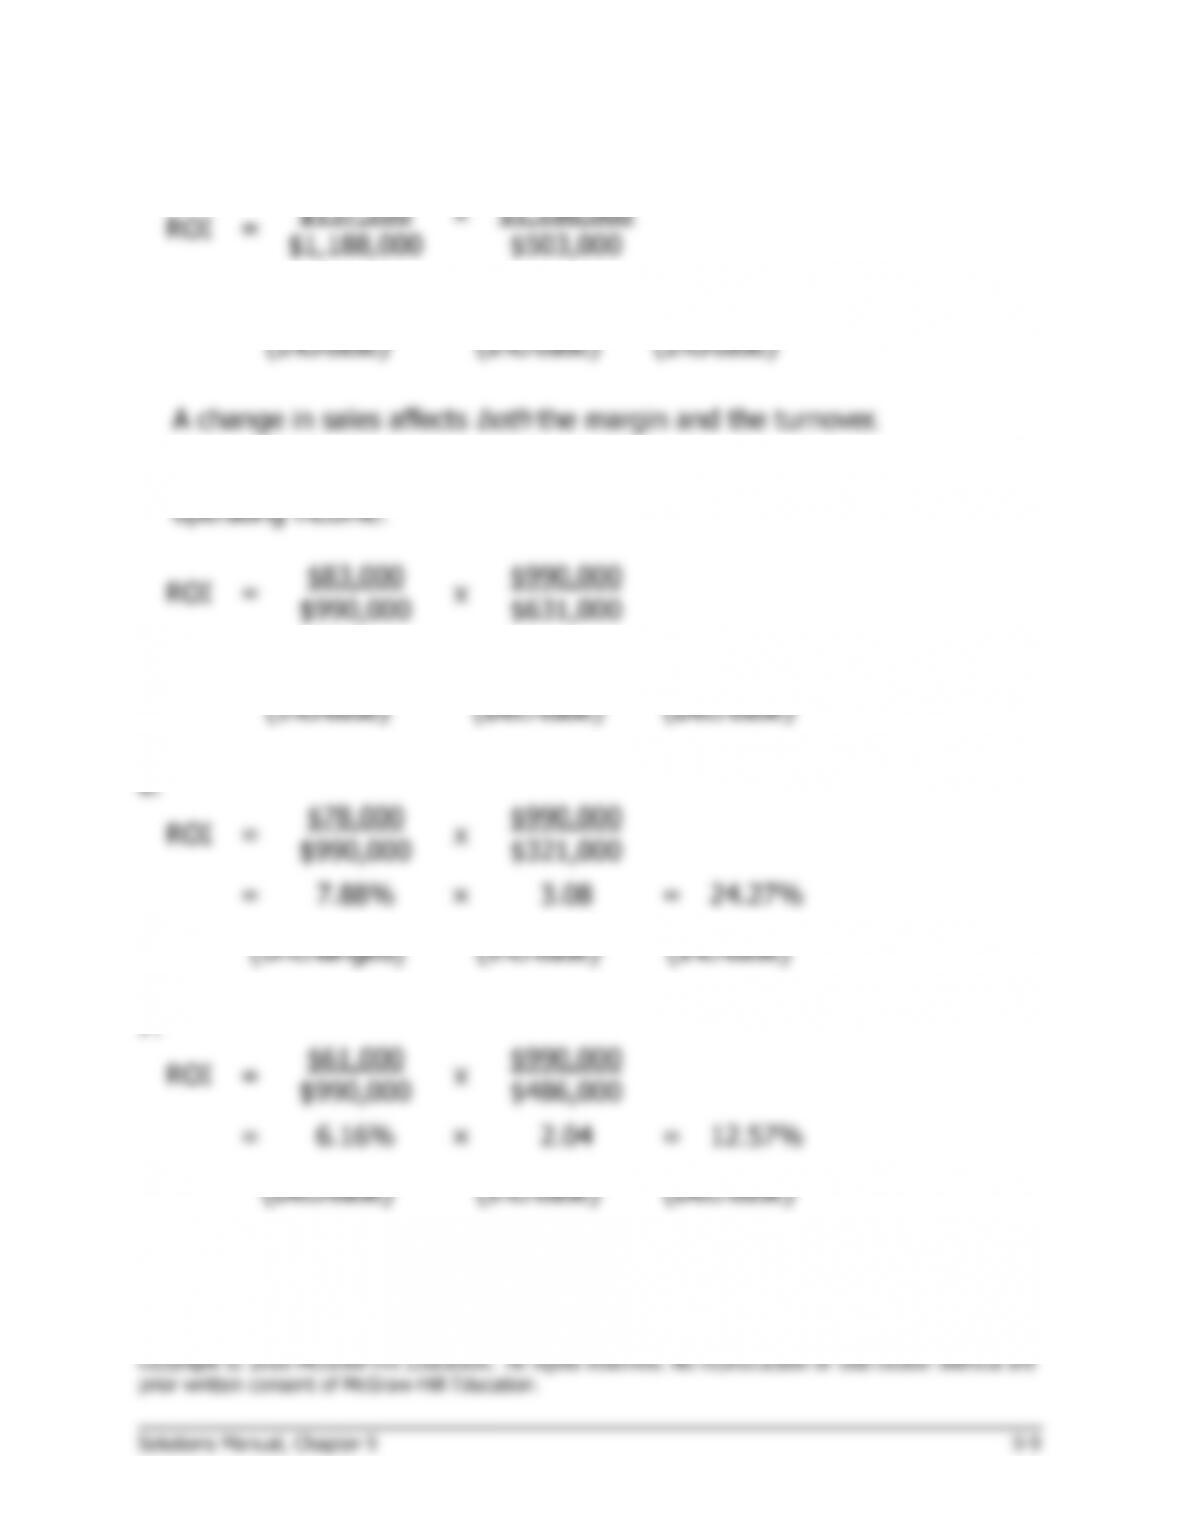
5. Interest is a financing expense and thus is not used to compute net
ROI
=
=
×
1.57
=
13.15%
(Increase)
=
×
3.08
=
24.27%
(Increase)
ROI
=
=
×
2.04
=
12.57%
(Increase)
Problem 9-19B (30 minutes)
1. a., b., and c.
Month
1
2
3
4
Throughput time in days:
Process time …………………………..….
0.5
0.5
0.5
0.5
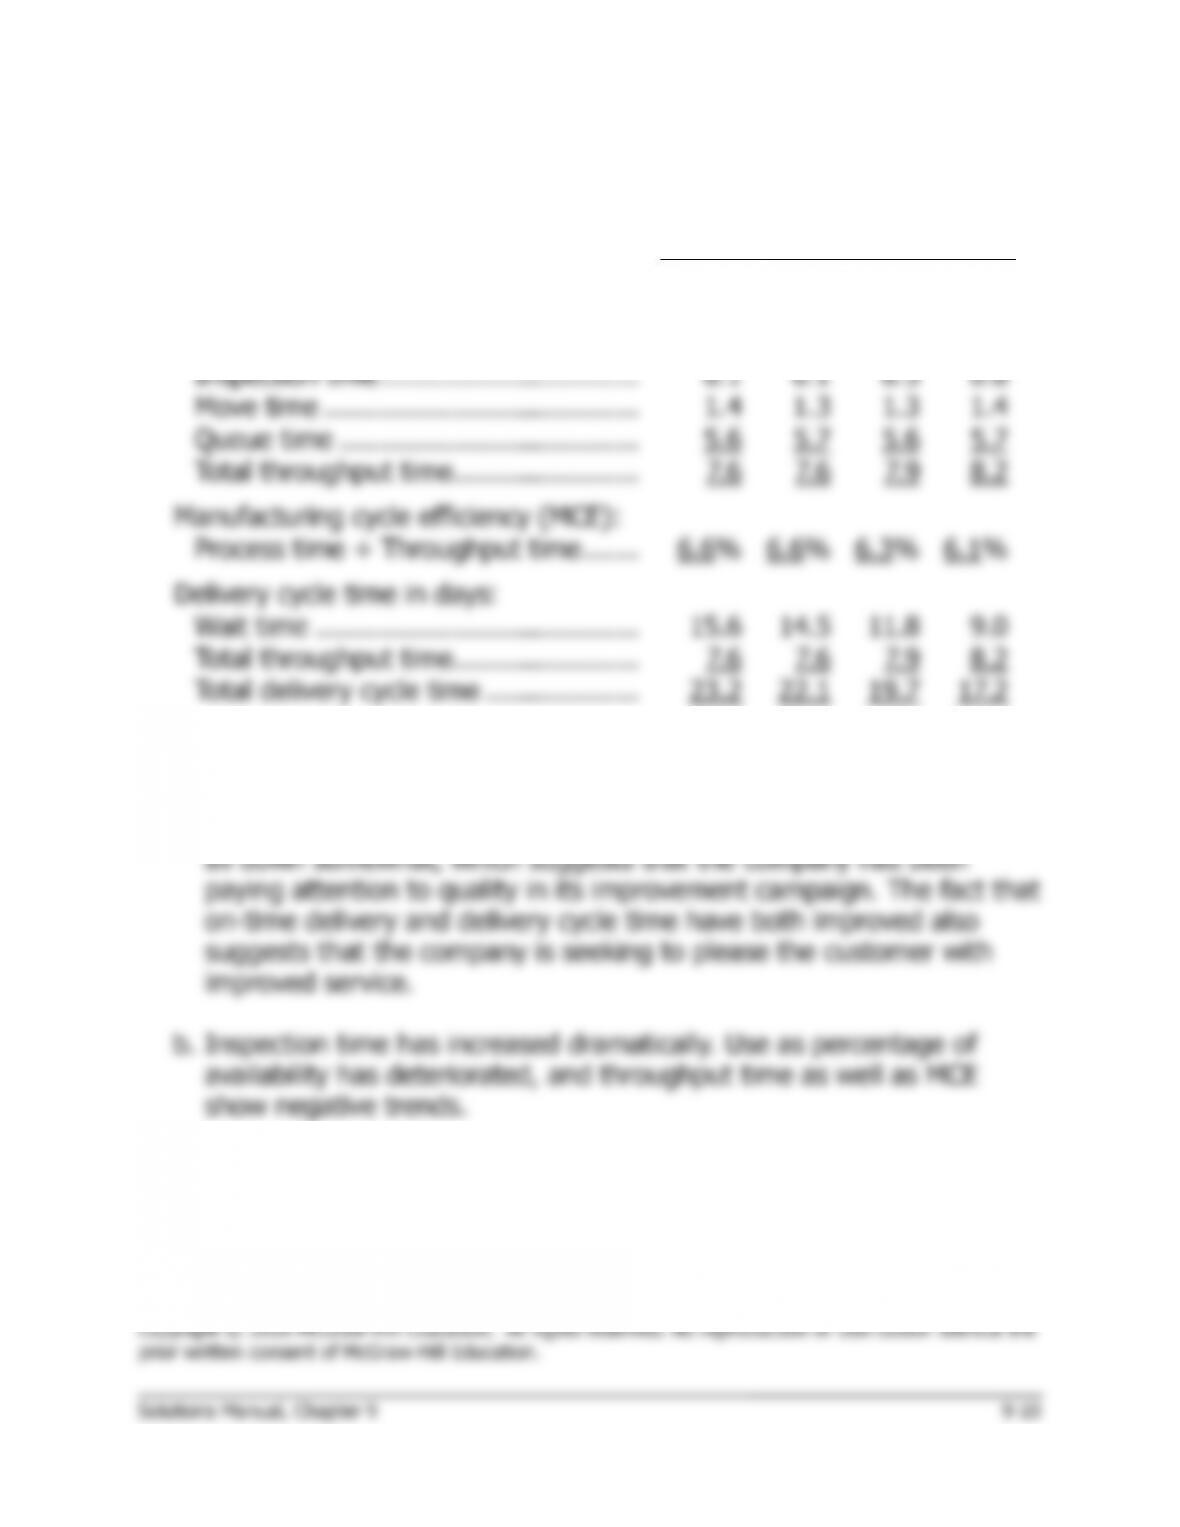
Inspection time …………………………..
0.1
0.1
0.5
0.6
Move time …………………………………
1.4
1.3
1.3
1.4
Queue time ……………………………….
5.6
5.7
5.6
5.7
Total throughput time …………………..
7.6
7.6
7.9
8.2
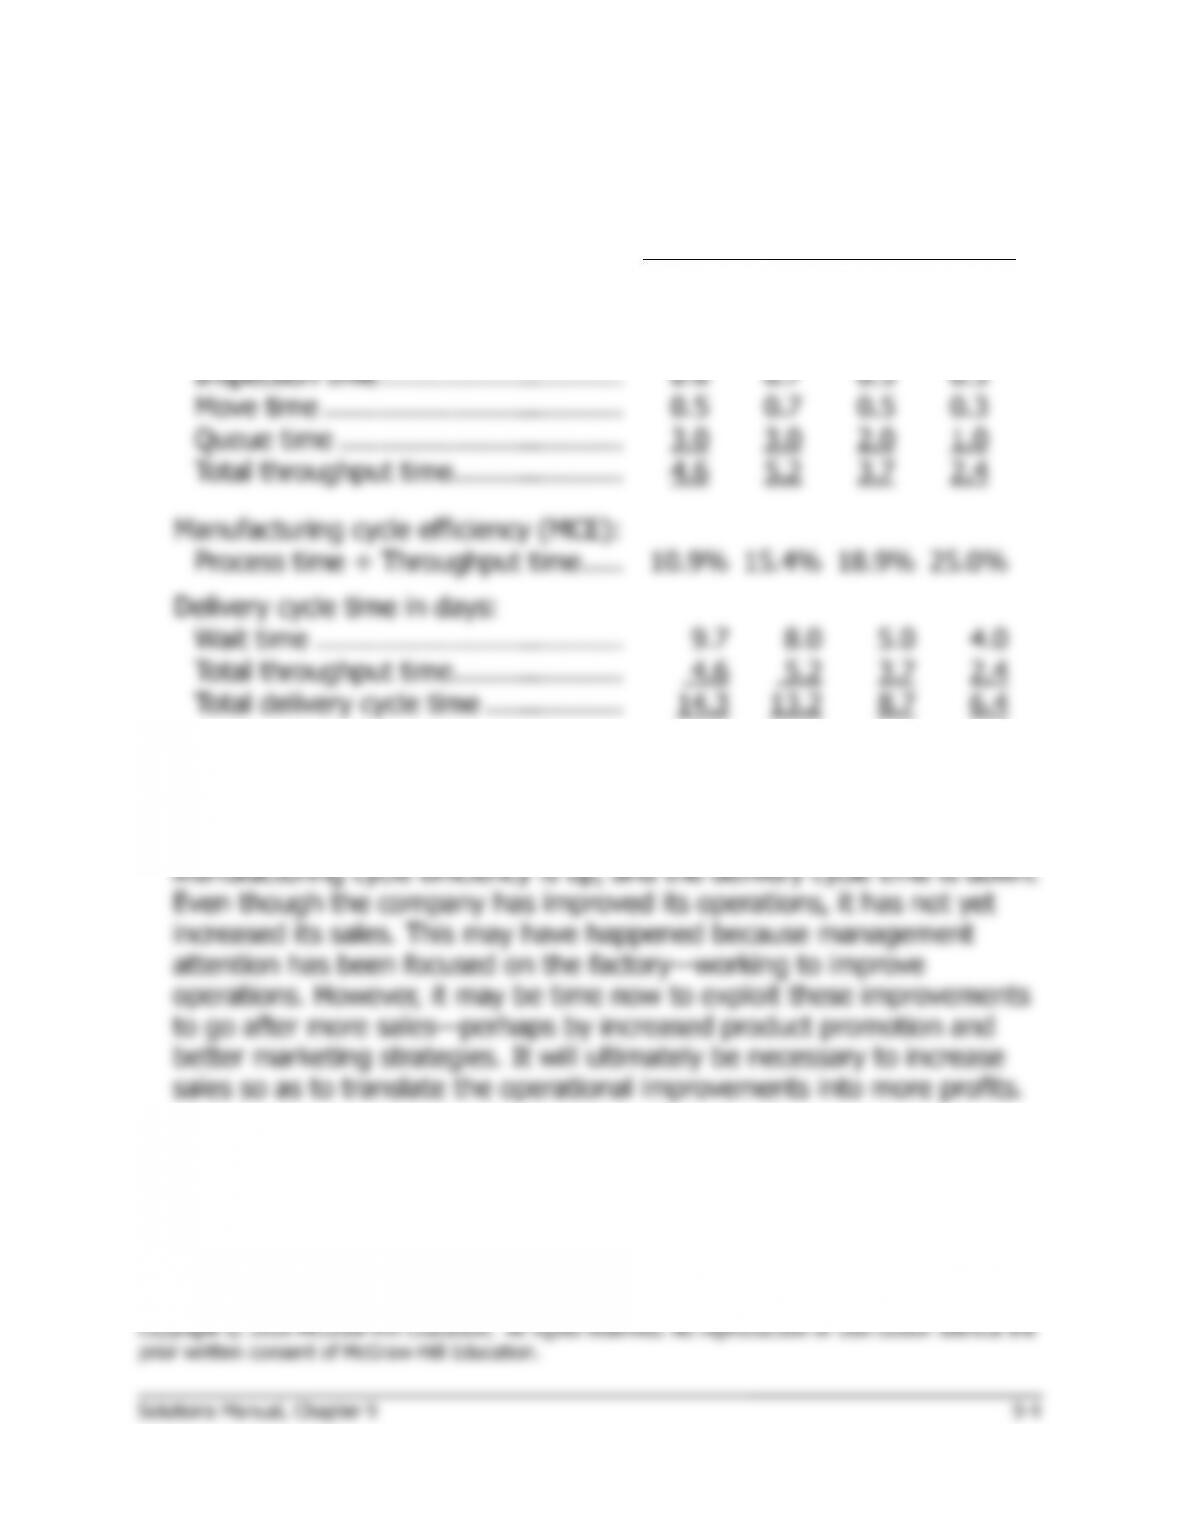
Manufacturing cycle efficiency (MCE):
Process time ÷ Throughput time …….
6.6%
6.6%
6.3%
6.1%
Delivery cycle time in days:
Wait time ………………………………….
15.6
14.5
11.8
9.0
Total throughput time …………………..
7.6
7.6
7.9
8.2
Total delivery cycle time ……………….
23.2
22.1
19.7
17.2
2. a. The company seems to be improving mainly in the areas of quality
control, material control, on-time delivery, and total delivery cycle
time. Customer complaints, warranty claims, defects, and scrap are
Problem 9-19B (continued)
c. While it is difficult to draw any definitive conclusions, it appears that
the company has concentrated first on those areas of performance
3. a. and b.
Month
5
6
Throughput time in days:
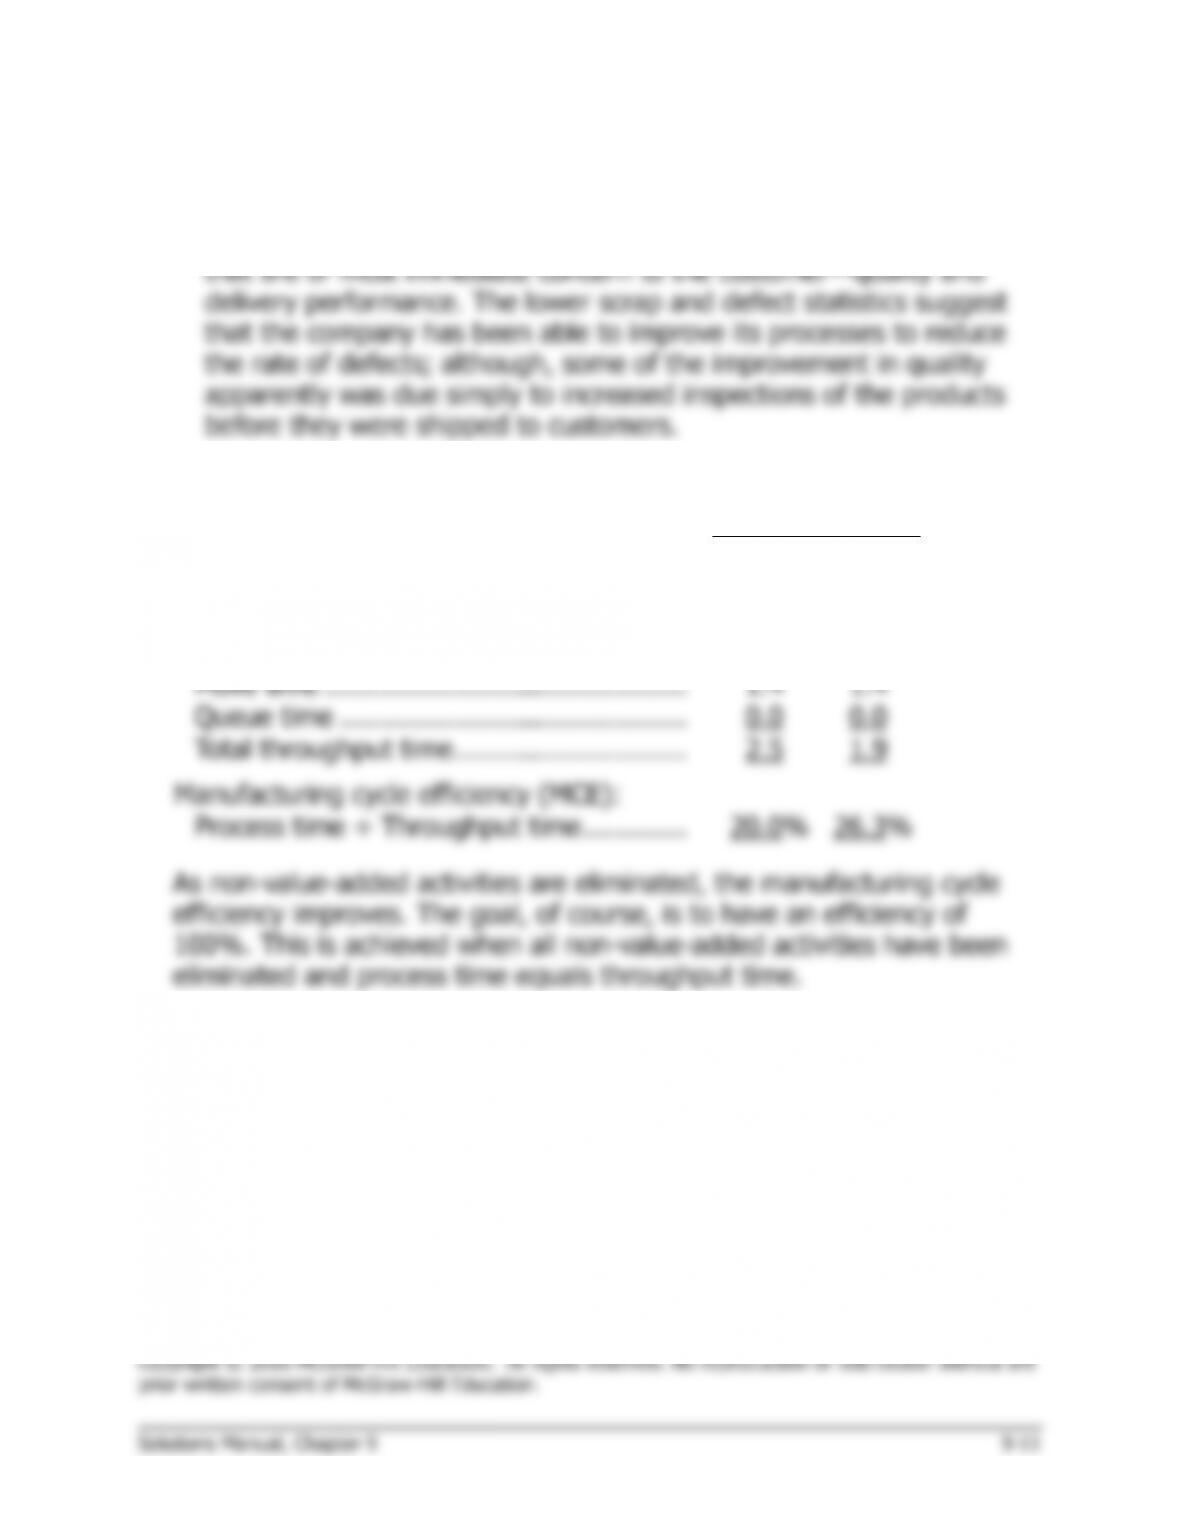
Process time …………………………..……….
0.5
0.5
Inspection time ………………………………..
0.6
0.0
Move time ………………………………………
1.4
1.4
Queue time …………………………………….
0.0
0.0
Total throughput time ………………………..
2.5
1.9
Manufacturing cycle efficiency (MCE):
Process time ÷ Throughput time ………….
20.0%
26.3%
As non-value-added activities are eliminated, the manufacturing cycle
efficiency improves. The goal, of course, is to have an efficiency of
100%. This is achieved when all non-value-added activities have been
eliminated and process time equals throughput time.