Problem 5-28A (continued)
2. The sales mix has shifted over the last year from Standard sets to
3. Sales commissions could be based on contribution margin rather than
on sales price. A flat rate on total contribution margin, as the text
suggests, might encourage the salespersons to emphasize the product
Problem 5-29A (60 minutes)
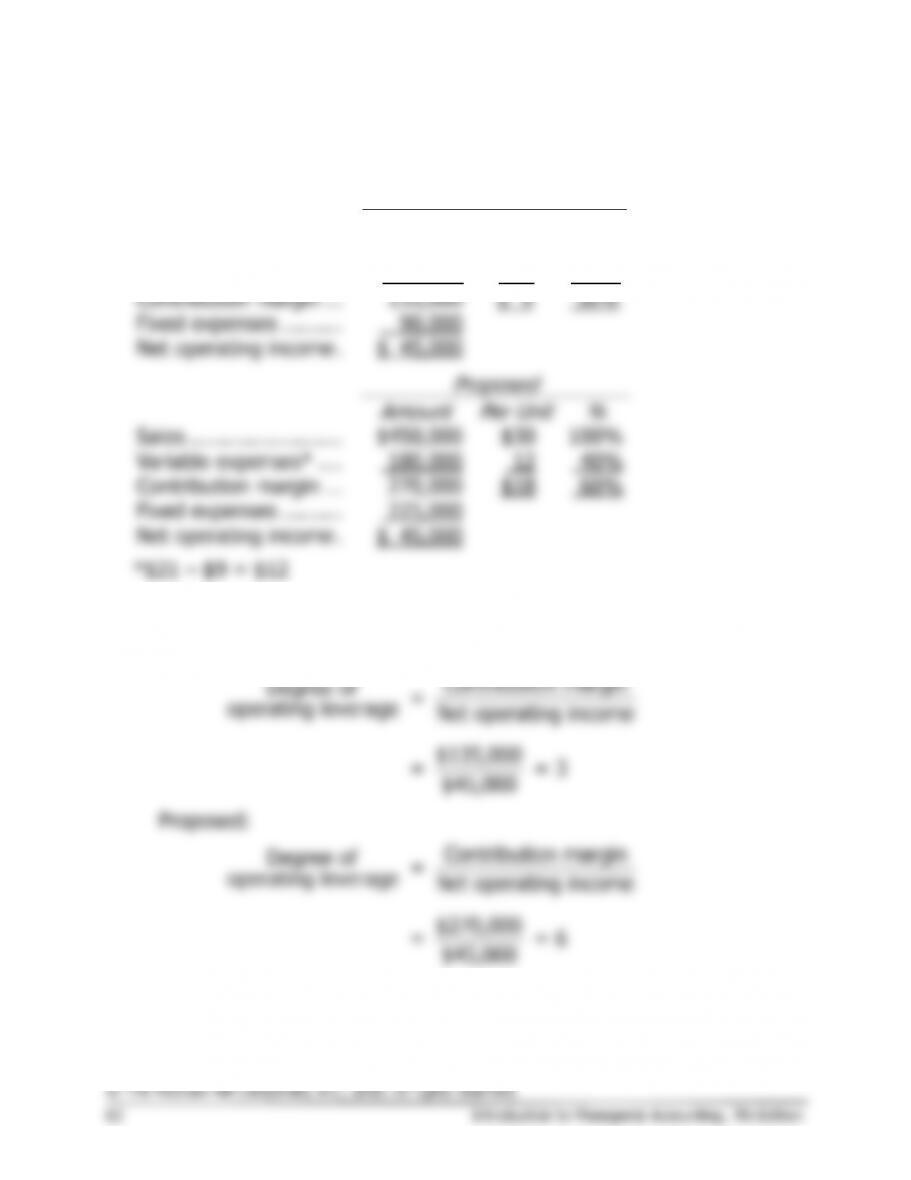
1. The income statements would be:
Present
Amount
Per Unit
%
Sales …………………….
$450,000
$30
100%
Variable expenses ……
315,000
21
70%
Contribution margin …
135,000
$ 9
30%
Fixed expenses ……….
90,000
Net operating income .
$ 45,000
Proposed
Amount
Per Unit
%
Sales …………………….
$450,000
$30
100%
Variable expenses* ….
180,000
12
40%
Contribution margin …
270,000
$18
60%
Fixed expenses ……….
225,000
Net operating income .
$ 45,000
*$21 – $9 = $12
2. a. Degree of operating leverage:
Present:
Contribution margin
Degree of
=
operating leverage Net operating income
$270,000
= = 6
$45,000
Problem 5-29A (continued)
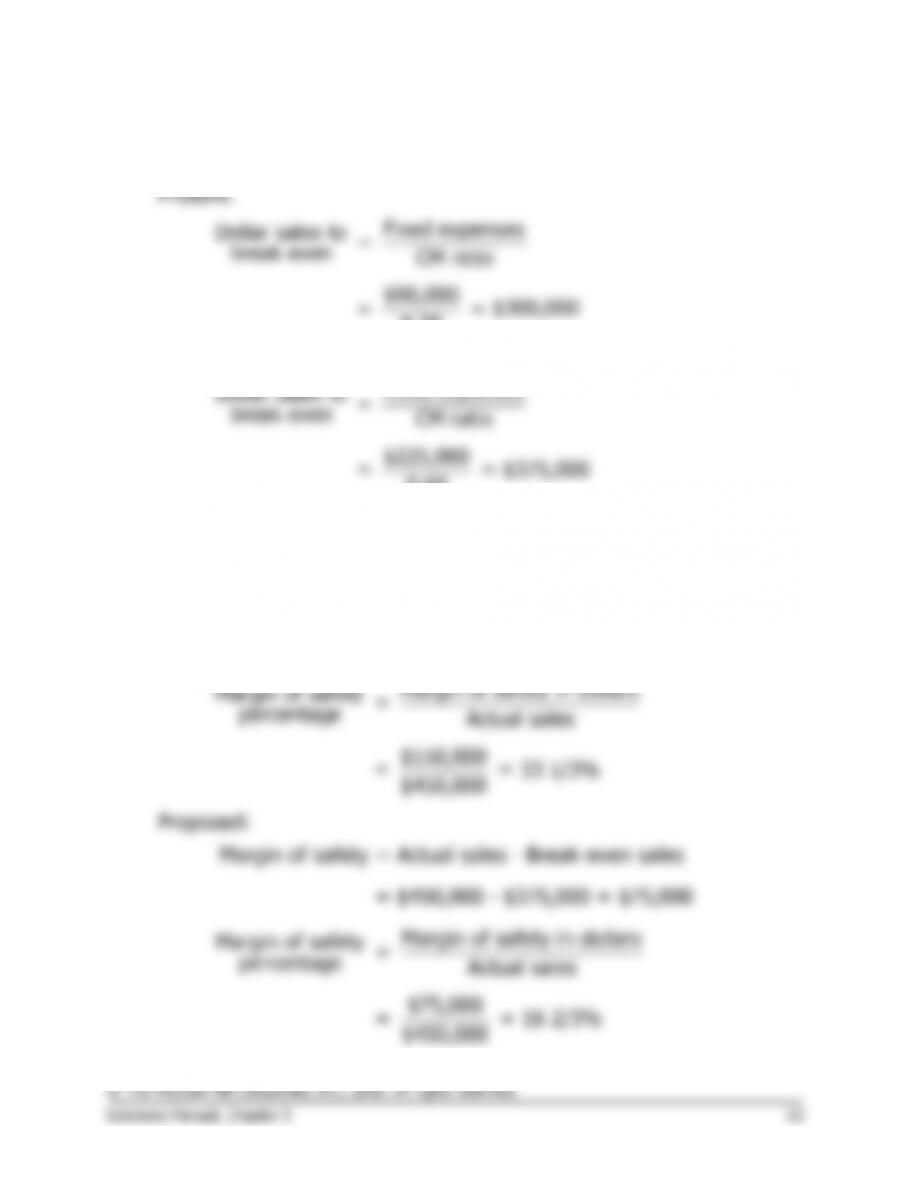
b. Dollar sales to break even:
Problem 5-29A (continued)
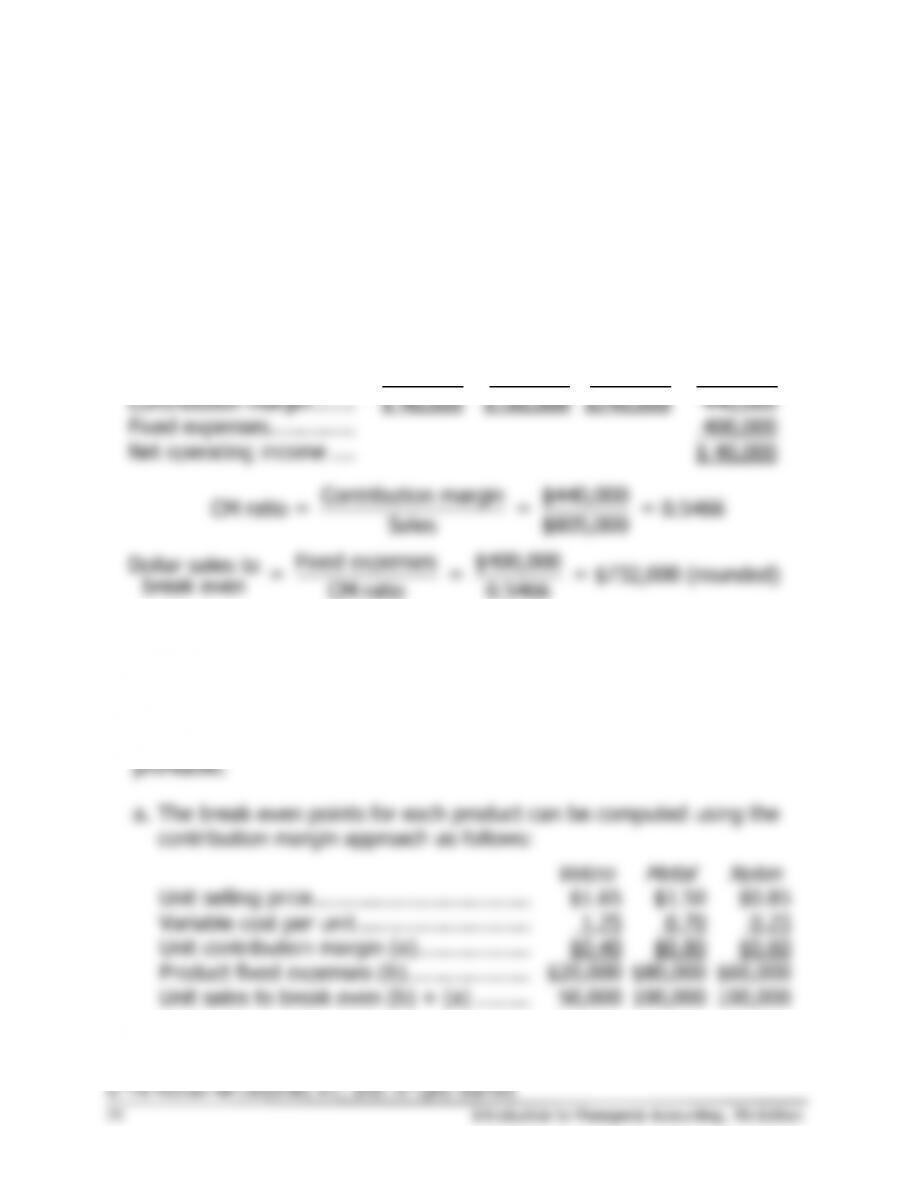
3. The major factor would be the sensitivity of the company’s operations to
cyclical movements in the economy. Because the new equipment will
increase the CM ratio, in years of strong economic activity, the company
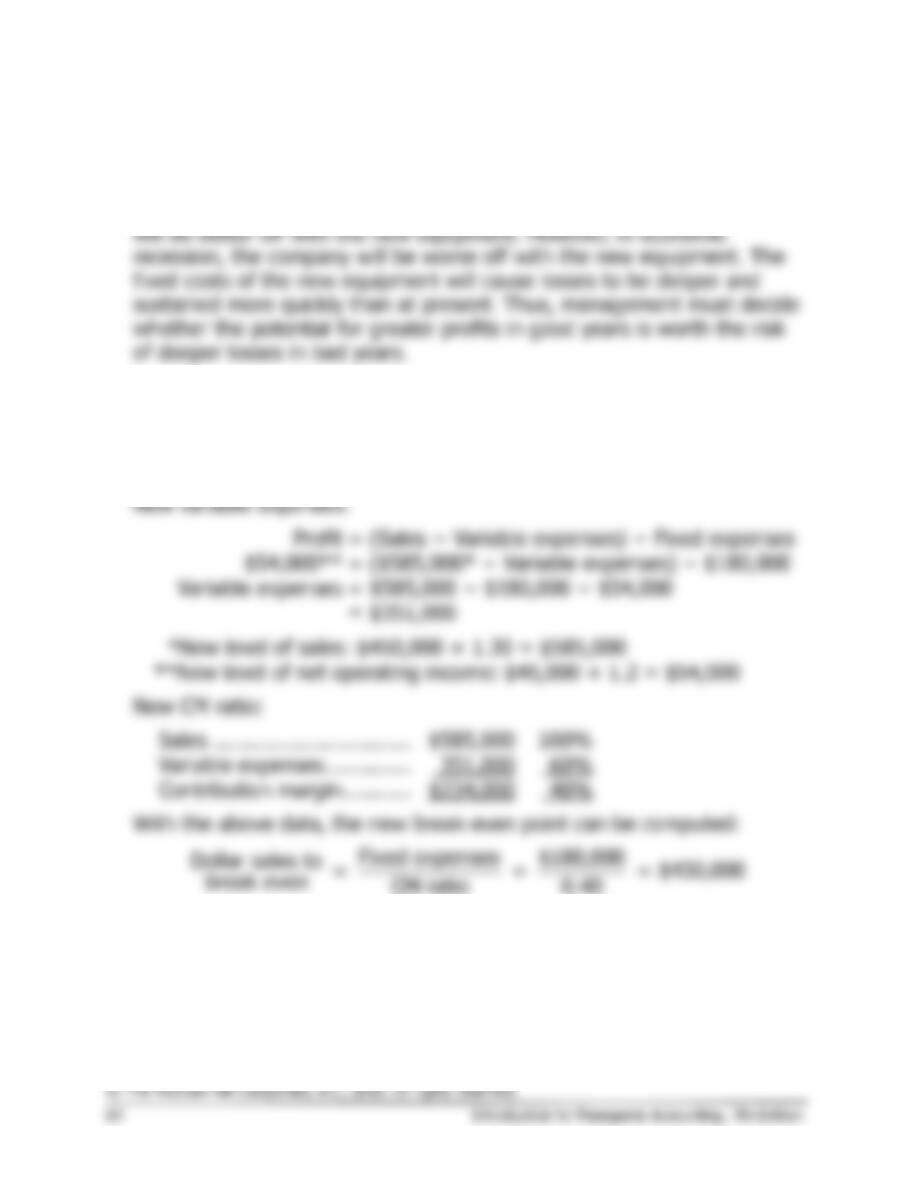
4. No information is given in the problem concerning the new variable
expenses or the new contribution margin ratio. Both of these items must
be determined before the new break-even point can be computed. The
computations are:
break even CM ratio 0.40
Problem 5-29A (continued)
The greatest risk is that the increases in sales and net operating income
predicted by the marketing manager will not happen and that sales will
remain at their present level. Note that the present level of sales is
Target profit + Fixed expenses
Dollar sales to =
attain target profit CM ratio
$45,000 + $180,000
= 0.40
= $562,500 in sales each month
Thus, sales would have to increase by at least 25% ($562,500 is 25%
Problem 5-30A (60 minutes)
1.
Profit
= Unit CM × Q − Fixed expenses
$0
= ($40 − $16) × Q − $60,000
$0
= ($24) × Q − $60,000
$24Q
= $60,000
Q
= $60,000 ÷ $24
Q
= 2,500 pairs, or at $40 per pair, $100,000 in sales
Alternative solution:
Fixed expenses $60,000
Unit sales to = = = 2,500 pairs
break even CM per unit $24.00
Fixed expenses $60,000
Dollar sales to = = = $100,000
break even CM ratio 0.600
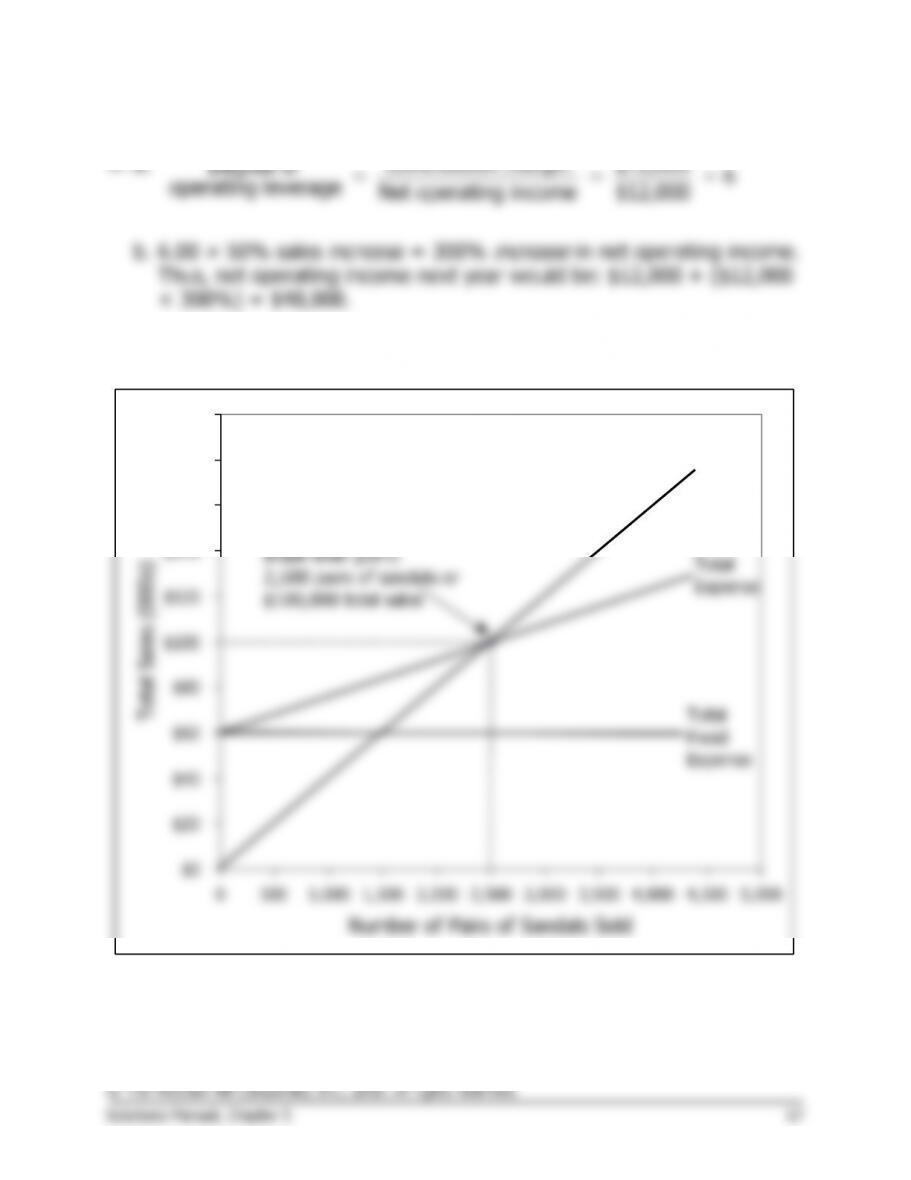
2. See the graphs at the end of this solution.
3.
Profit
= Unit CM × Q − Fixed expenses
$18,000
= $24 × Q − $60,000
$24Q
= $18,000 + $60,000
Q
= $78,000 ÷ $24
Q
= 3,250 pairs
Alternative solution:
Target profit + Fixed expenses
Unit sales to attain =
target profit Unit contribution margin
$18,000 + $60,000
= = 3,250 pairs
$24.00
4.
Incremental contribution margin:
$25,000 increased sales × 60% CM ratio …..
$15,000
Incremental fixed salary cost …………………….
8,000
Increased net income ………………………………
$ 7,000
Yes, the position should be converted to a full-time basis.
Problem 5-30A (continued)
5.
a.
Contribution margin $72,000
Degree of = = = 6
operating leverage Net operating income $12,000
b. 6.00 × 50% sales increase = 300%
increase
in net operating income.
Thus, net operating income next year would be: $12,000 + ($12,000
× 300%) = $48,000.
2. Cost-volume-profit graph:
$0
$20
$40
$60
$80
$100
$120
$140
$160
$180
$200
0500 1,000 1,500 2,000 2,500 3,000 3,500 4,000 4,500 5,000
Number of Pairs of Sandals Sold
Total Sales (000s)
Break-even point:
2,500 pairs of sandals or
$100,000 total sales
Total Sales
Total
Expense
Total
Fixed
Expense
Problem 5-30A (continued)
Profit graph:
-$60,000
-$55,000
-$50,000
-$45,000
-$40,000
-$35,000
-$30,000
-$25,000
-$20,000
-$15,000
-$10,000
-$5,000
$0
$5,000
$10,000
$15,000
$20,000
$25,000
$30,000
$35,000
0 500 1,000 1,500 2,000 2,500 3,000 3,500 4,000
Profit
Sales Volume in Units
Profit Graph
Break-even point:
2,500 sandals
Problem 5-31A (30 minutes)
1.
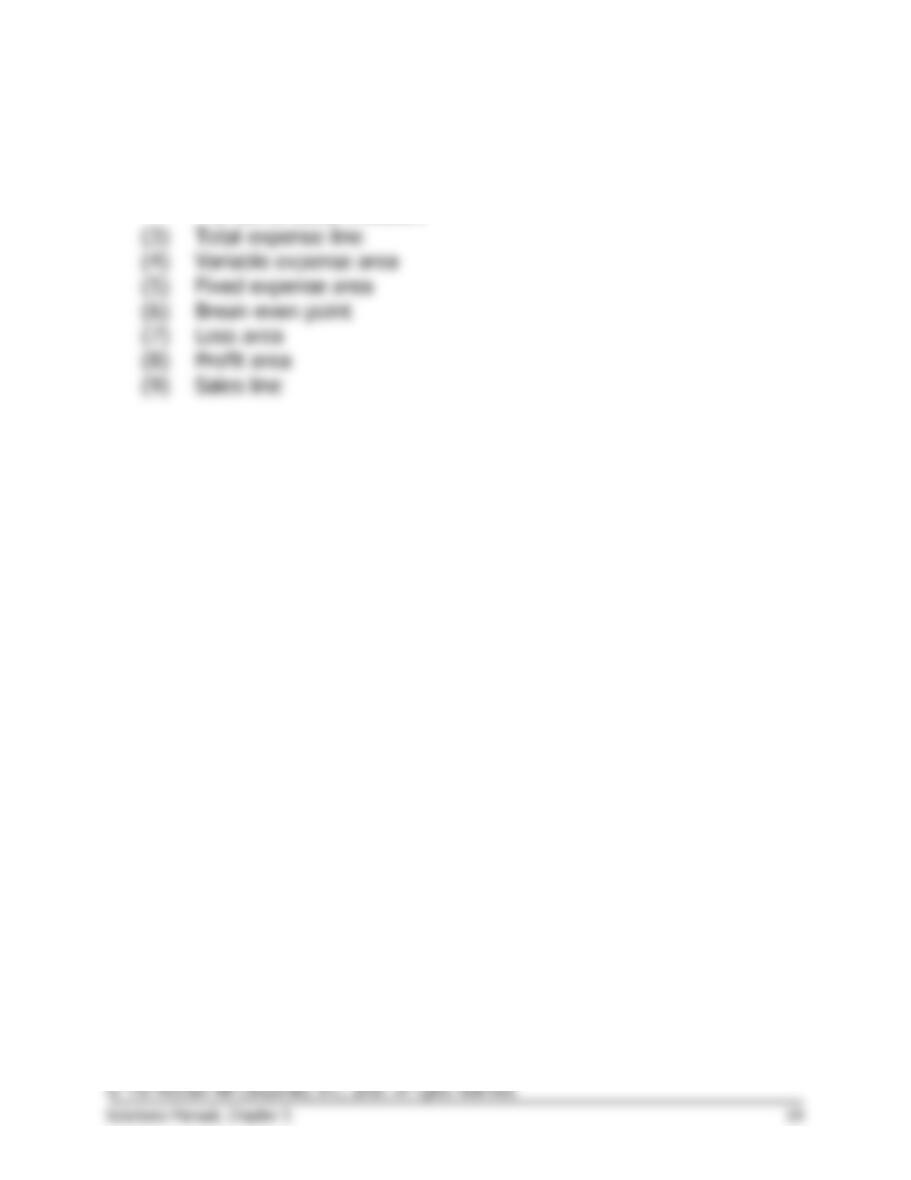
(1)
Dollars
(2)
Volume of output, expressed in units, % of capacity, sales,
or some other measure
(3)
Total expense line
(4)
Variable expense area
(5)
Fixed expense area
(6)
Break-even point
(7)
Loss area
(8)
Profit area
(9)
Sales line
Problem 5-31A (continued)
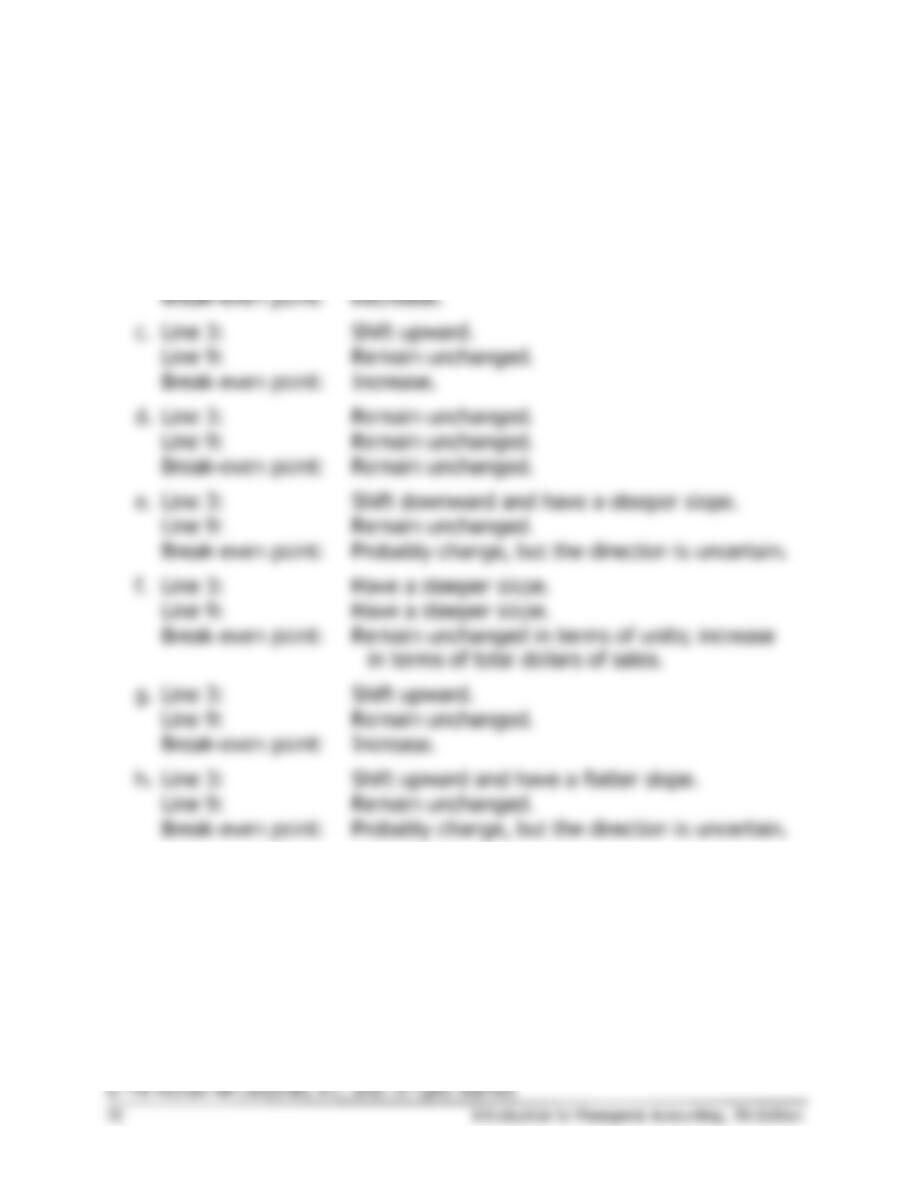
2.
a.
Line 3:
Remain unchanged.
Line 9:
Have a steeper slope.
Break-even point:
Decrease.
b.
Line 3:
Have a flatter slope.
Line 9:
Remain unchanged.
Break-even point:
Decrease.
c.
Line 3:
Shift upward.
Line 9:
Remain unchanged.
Break-even point:
Increase.
d.
Line 3:
Remain unchanged.
Line 9:
Remain unchanged.
Break-even point:
Remain unchanged.
e.
Line 3:
Shift downward and have a steeper slope.
Line 9:
Remain unchanged.
Break-even point:
Probably change, but the direction is uncertain.
f.
Line 3:
Have a steeper slope.
Line 9:
Have a steeper slope.
Break-even point:
Remain unchanged in terms of units; increase
in terms of total dollars of sales.
g.
Line 3:
Shift upward.
Line 9:
Remain unchanged.
Break-even point:
Increase.
h.
Line 3:
Shift upward and have a flatter slope.
Line 9:
Remain unchanged.
Break-even point:
Probably change, but the direction is uncertain.
Case (75 minutes)
Before proceeding with the solution, it is helpful first to restructure the data into contribution format for
each of the three alternatives. (The data in the statements below are in thousands.)
15% Commission
20% Commission
Own Sales Force
Sales ……………………………………
$16,000
100%
$16,000
100%
$16,000.00
100.0%
Variable expenses:
Manufacturing ……………………..
7,200
7,200
7,200.00
Commissions (15%, 20% 7.5%)
2,400
3,200
1,200.00
Total variable expenses …………….
9,600
60%
10,400
65%
8,400.00
52.5%
Contribution margin …………………
6,400
40%
5,600
35%
7,600.00
47.5%
Fixed expenses:
Manufacturing overhead …………
2,340
2,340
2,340.00
Marketing …………………………...
120
120
2,520.00
*
Administrative ………………………
1,800
1,800
1,725.00
**
Interest ………………………………
540
540
540.00
Total fixed expenses ………………..
4,800
4,800
7,125.00
Income before income taxes ……..
1,600
800
475.00
Income taxes (30%) ………………..
480
240
142.50
Net income …………………………...
$ 1,120
$ 560
$ 332.50
*$120,000 + $2,400,000 = $2,520,000
**$1,800,000 – $75,000 = $1,725,000
Case (continued)
1. When the income before taxes is zero, income taxes will also be zero
and net income will be zero. Therefore, the break-even calculations can
be based on the income before taxes.
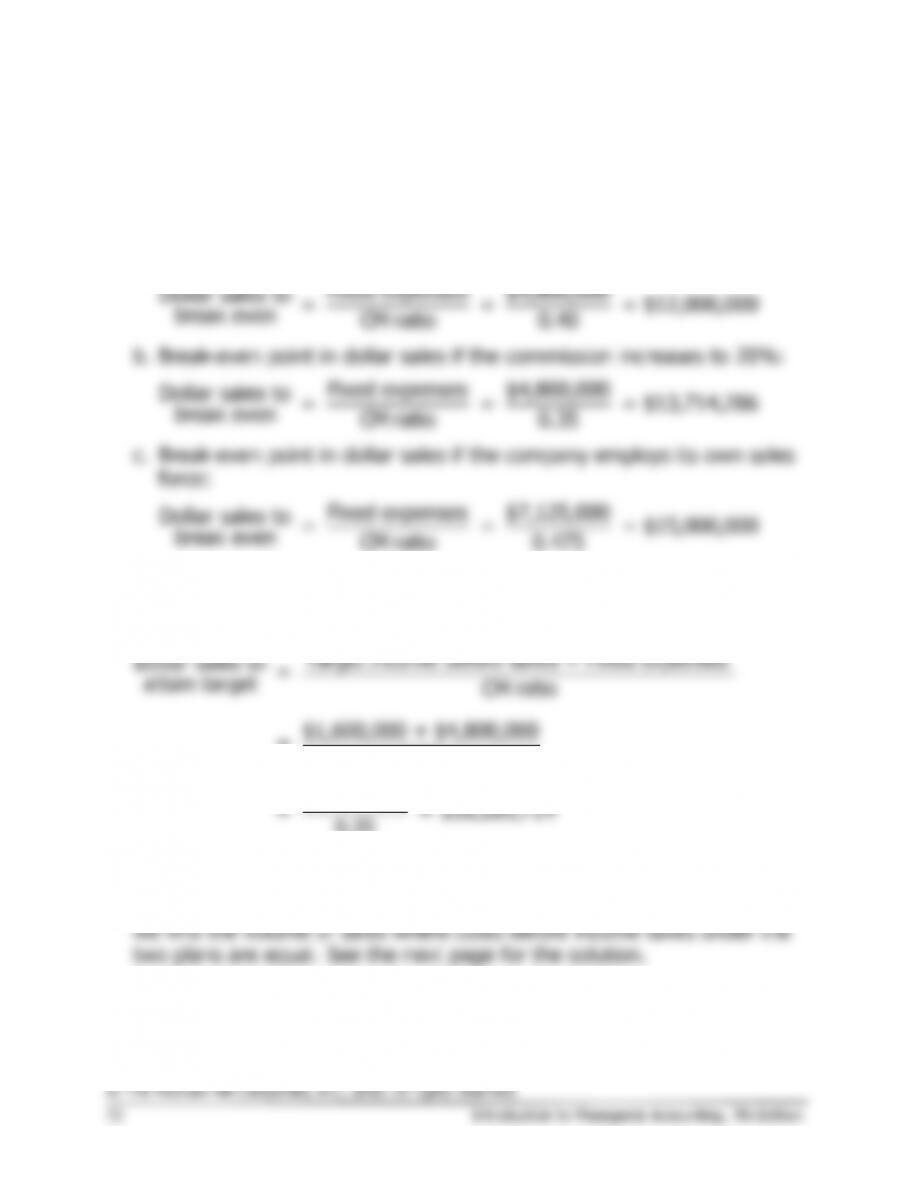
a. Break–even point in dollar sales if the commission remains 15%:
Fixed expenses $4,800,000
Dollar sales to = = = $12,000,000
break even CM ratio 0.40
b. Break-even point in dollar sales if the commission increases to 20%:
Fixed expenses $4,800,000
Dollar sales to = = = $13,714,286
break even CM ratio 0.35
c. Break–even point in dollar sales if the company employs its own sales
force:
Fixed expenses $7,125,000
Dollar sales to = = = $15,000,000
break even CM ratio 0.475
2. In order to generate a $1,120,000 net income, the company must
generate $1,600,000 in income before taxes. Therefore,
Target income before taxes + Fixed expenses
Dollar sales to =
attain target CM ratio
$1,600,000 + $4,800,000
=
0.35
$6,400,000
= = $18,285,714
0.35
3. To determine the volume of sales at which net income would be equal
under either the 20% commission plan or the company sales force plan,
Case (continued)
X =
Total sales revenue
0.65X + $4,800,000 =
0.525X + $7,125,000
0.125X =
$2,325,000
X =
$2,325,000 ÷ 0.125
X =
$18,600,000
Thus, at a sales level of $18,600,000 either plan would yield the same
income before taxes and net income. Below this sales level, the
commission plan would yield the largest net income; above this sales
level, the sales force plan would yield the largest net income.
4. a., b., and c.
15%
Commission
20%
Commission
Own
Sales Force
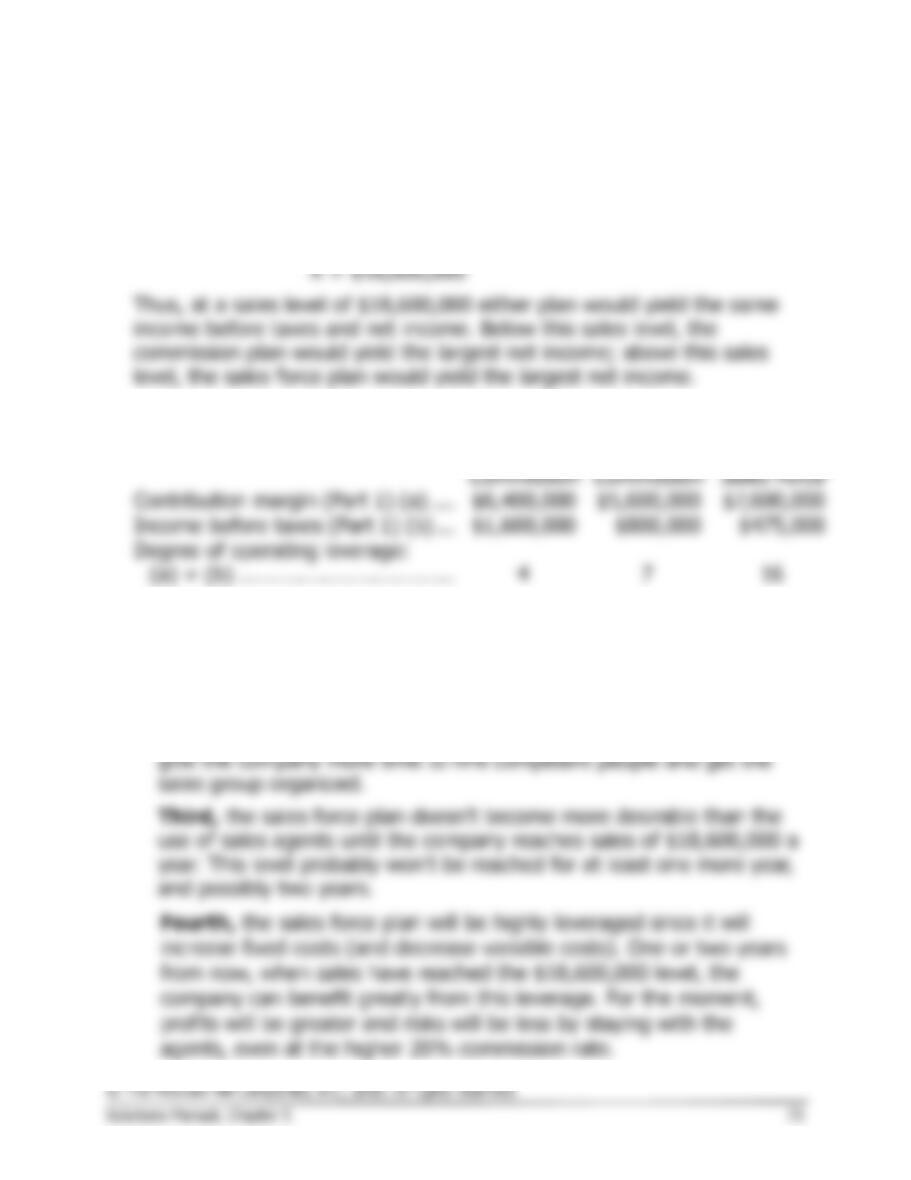
Contribution margin (Part 1) (a) ….
$6,400,000
$5,600,000
$7,600,000
Income before taxes (Part 1) (b) …
$1,600,000
$800,000
$475,000
Degree of operating leverage:
(a) ÷ (b) ……………………………..
4
7
16
5. We would continue to use the sales agents for at least one more year,
and possibly for two more years. The reasons are as follows:
First, use of the sales agents would have a less dramatic effect on
net income.
Second, use of the sales agents for at least one more year would
Analytical Thinking (60 minutes)
Note: This is a problem that will challenge the very best students’ conceptual
and analytical skills. However, working through this case will yield substantial
dividends in terms of a much deeper understanding of critical management
accounting concepts.
1. The overall break-even sales can be determined using the CM ratio.
Velcro
Metal
Nylon
Total
Sales ……………………….
$165,000
$300,000
$340,000
$805,000
Variable expenses ………
125,000
140,000
100,000
365,000
Contribution margin …….
$ 40,000
$160,000
$240,000
440,000
Fixed expenses…………..
400,000
Net operating income ….
$ 40,000
Contribution margin $440,000
CM ratio = = = 0.5466
Sales $805,000
Fixed expenses $400,000
Dollar sales to = = = $732,000 (rounded)
break even CM ratio 0.5466
2. The issue is what to do with the common fixed cost when computing
the break-evens for the individual products. The correct approach is to
ignore the common fixed costs. If the common fixed costs are included
in the computations, the break-even points will be overstated for
individual products and managers may drop products that in fact are
Velcro
Metal
Nylon
Unit selling price ……………………………..
$1.65
$1.50
$0.85
Variable cost per unit ……………………….
1.25
0.70
0.25
Unit contribution margin (a) ………………
$0.40
$0.80
$0.60
Product fixed expenses (b)………………..
$20,000
$80,000
$60,000
Unit sales to break even (b) ÷ (a) ………
50,000
100,000
100,000
Analytical Thinking (continued)
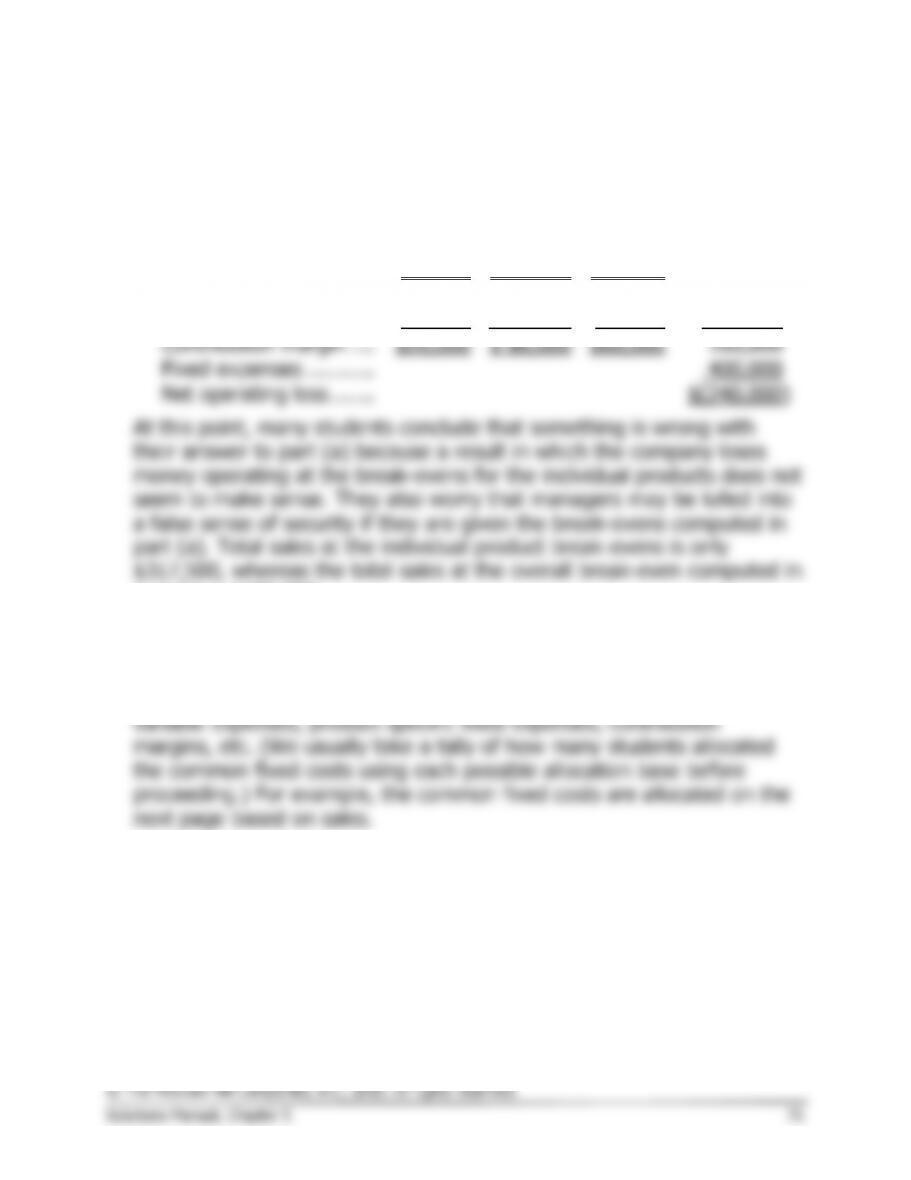
b. If the company were to sell exactly the break-even quantities
computed above, the company would lose $240,000—the amount of
the common fixed cost. This can be verified as follows:
Velcro
Metal
Nylon
Total
Unit sales ……………….
50,000
100,000
100,000
Sales ……………………..
$82,500
$150,000
$85,000
$317,500
Variable expenses …….
62,500
70,000
25,000
157,500
Contribution margin ….
$20,000
$ 80,000
$60,000
160,000
Fixed expenses ………..
400,000
Net operating loss …….
$(240,000)
At this point, many students conclude that something is wrong with
their answer to part (a) because a result in which the company loses
money operating at the break-evens for the individual products does not
seem to make sense. They also worry that managers may be lulled into
a false sense of security if they are given the break-evens computed in
part (a). Total sales at the individual product break-evens is only
$317,500, whereas the total sales at the overall break-even computed in
part (1) is $732,000.
Many students (and managers, for that matter) attempt to resolve this
apparent paradox by allocating the common fixed costs among the
products prior to computing the break-evens for individual products. Any
of a number of allocation bases could be used for this purpose—sales,