Problem 5-20A (continued)
c. This problem illustrates the difficulty faced by some companies. When
Problem 5-21A (30 minutes)
1.
Product
White
Fragrant
Loonzain
Total
Percentage of total
sales …………………
40%
24%
36%
100%
Sales …………………..
$300,000
100%
$180,000
100%
$270,000
100%
$750,000
100%
Variable expenses …..
216,000
72%
36,000
20%
108,000
40%
360,000
48%
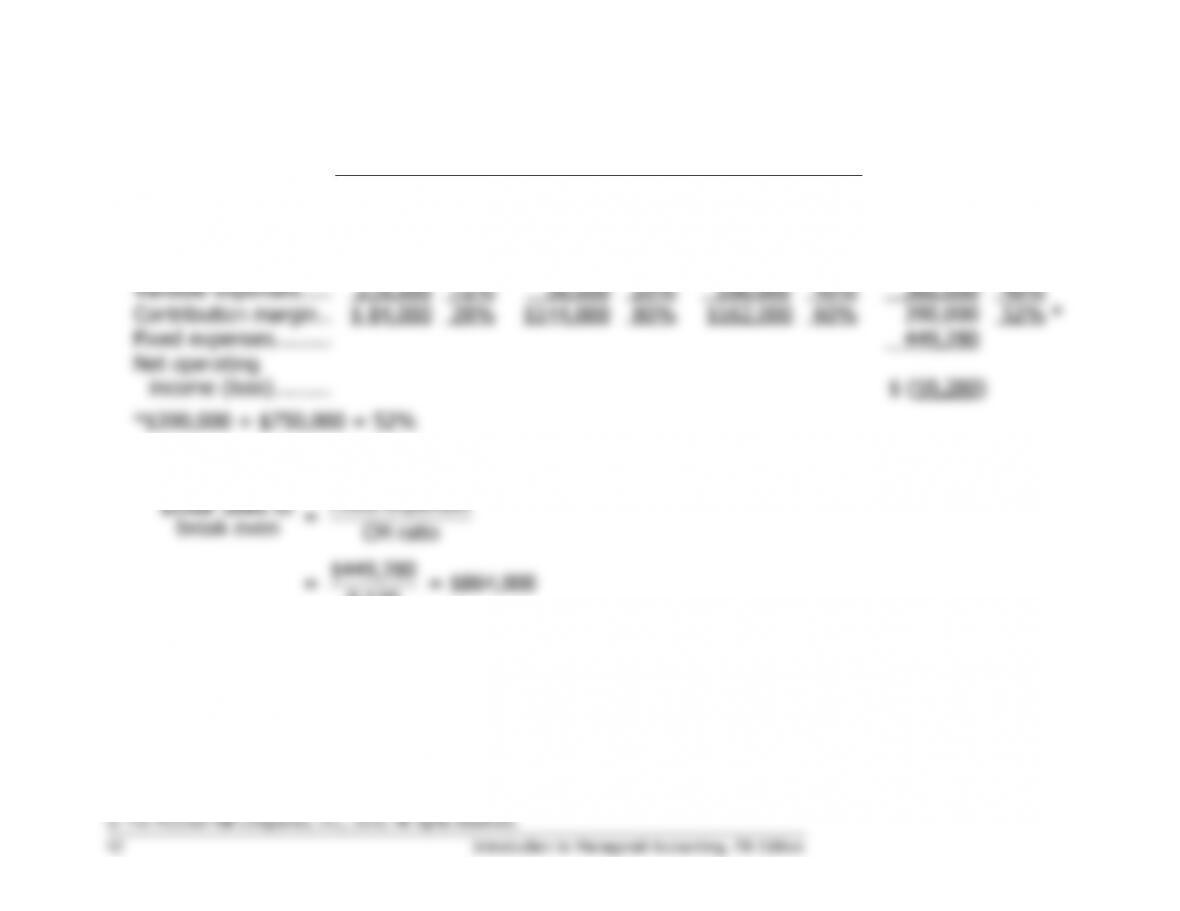
Contribution margin ..
$ 84,000
28%
$144,000
80%
$162,000
60%
390,000
52%
*
Fixed expenses ………
449,280
Net operating
income (loss) ………
$ (59,280)
2. Break-even sales would be:
Fixed expenses
Dollar sales to =
break even CM ratio
Problem 5-21A (continued)
3. Memo to the president:
Although the company met its sales budget of $750,000 for the month,
the mix of products changed substantially from that budgeted. This is
the reason the budgeted net operating income was not met, and the
Problem 5-22A (60 minutes)
1. The CM ratio is 30%:
Total
Per Unit
Percent of Sales
Sales (19,500 units) ………
$585,000
$30.00
100%
Variable expenses …………
409,500
21.00
70%
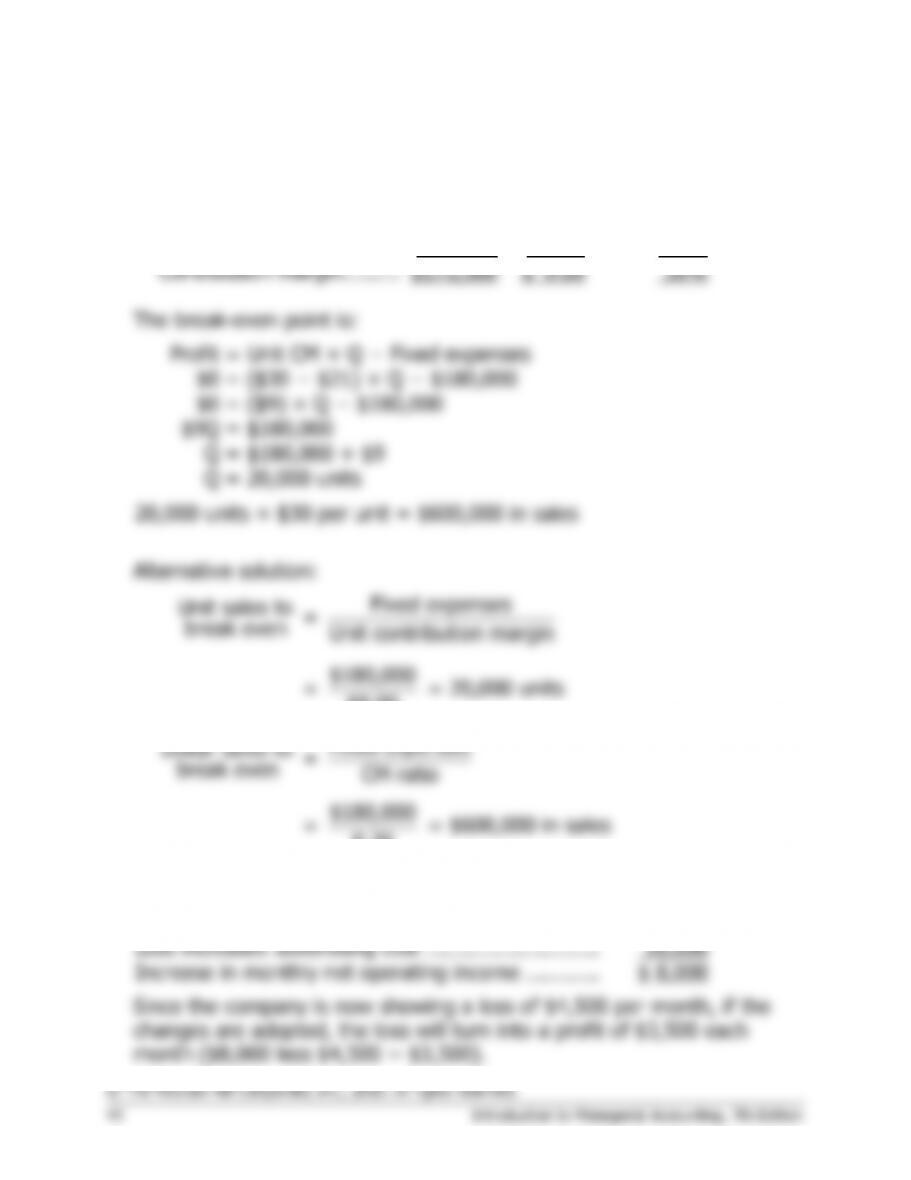
Contribution margin ………
$175,500
$ 9.00
30%
= ($30 − $21) × Q − $180,000
= ($9) × Q − $180,000
= $180,000
Incremental contribution margin:
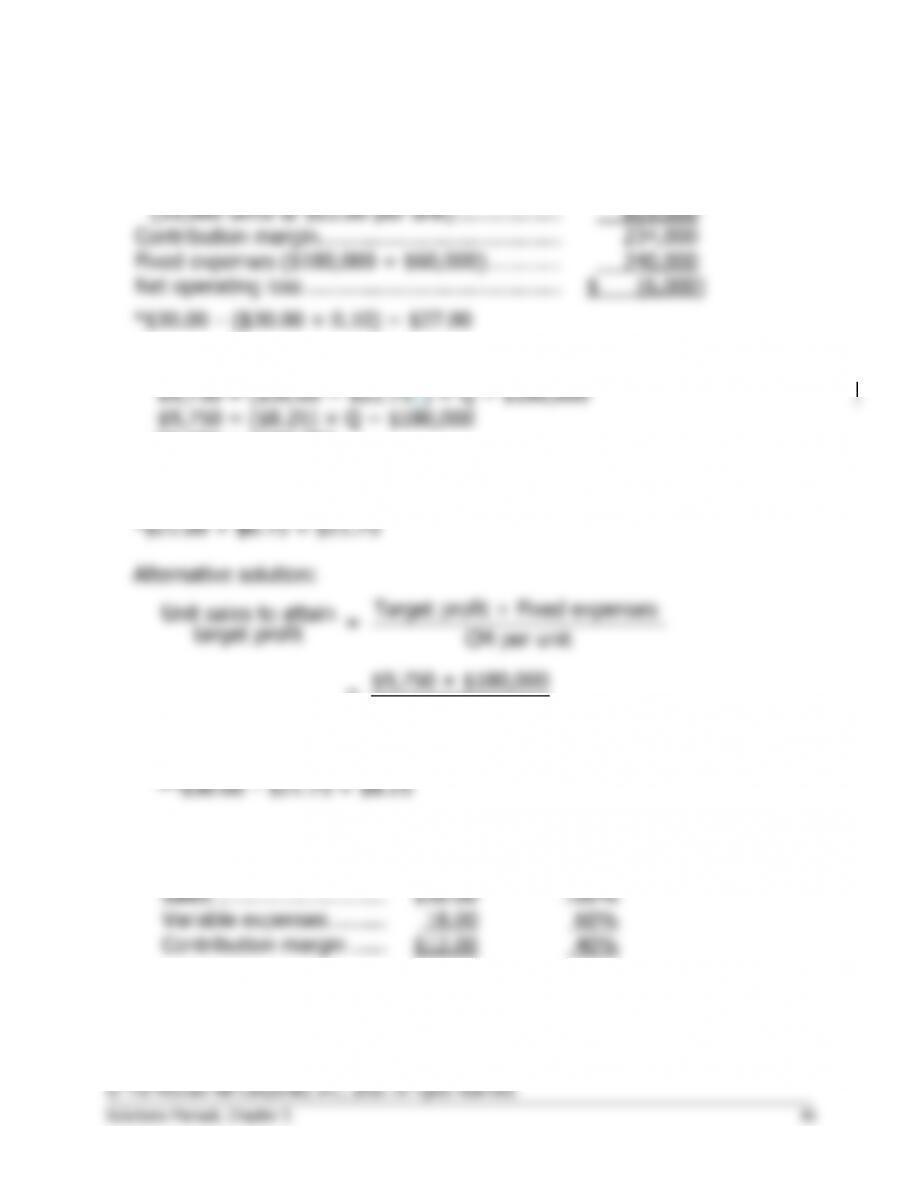
Problem 5-22A (continued)
3.
Sales (39,000 units @ $27.00 per unit*) ………
$1,053,000
Variable expenses
(39,000 units @ $21.00 per unit) ……………..
819,000
Contribution margin …………………………………
234,000
Fixed expenses ($180,000 + $60,000) …………
240,000
Net operating loss …………………………………..
$ (6,000)
*$30.00 – ($30.00 × 0.10) = $27.00
4.
Profit
= Unit CM × Q − Fixed expenses
$9,750
= ($30.00 − $21.75*) × Q − $180,000
$9,750
= ($8.25) × Q − $180,000
$8.25Q
= $189,750
Q
= $189,750 ÷ $8.25
Q
= 23,000 units
Target profit + Fixed expenses
Unit sales to attain =
target profit CM per unit
$9,750 + $180,000
=
$8.25**
= 23,000 units
5. a. The new CM ratio would be:
Per Unit
Percent of Sales
Sales ……………………….
$30.00
100%
Variable expenses ………
18.00
60%
Contribution margin ……
$12.00
40%
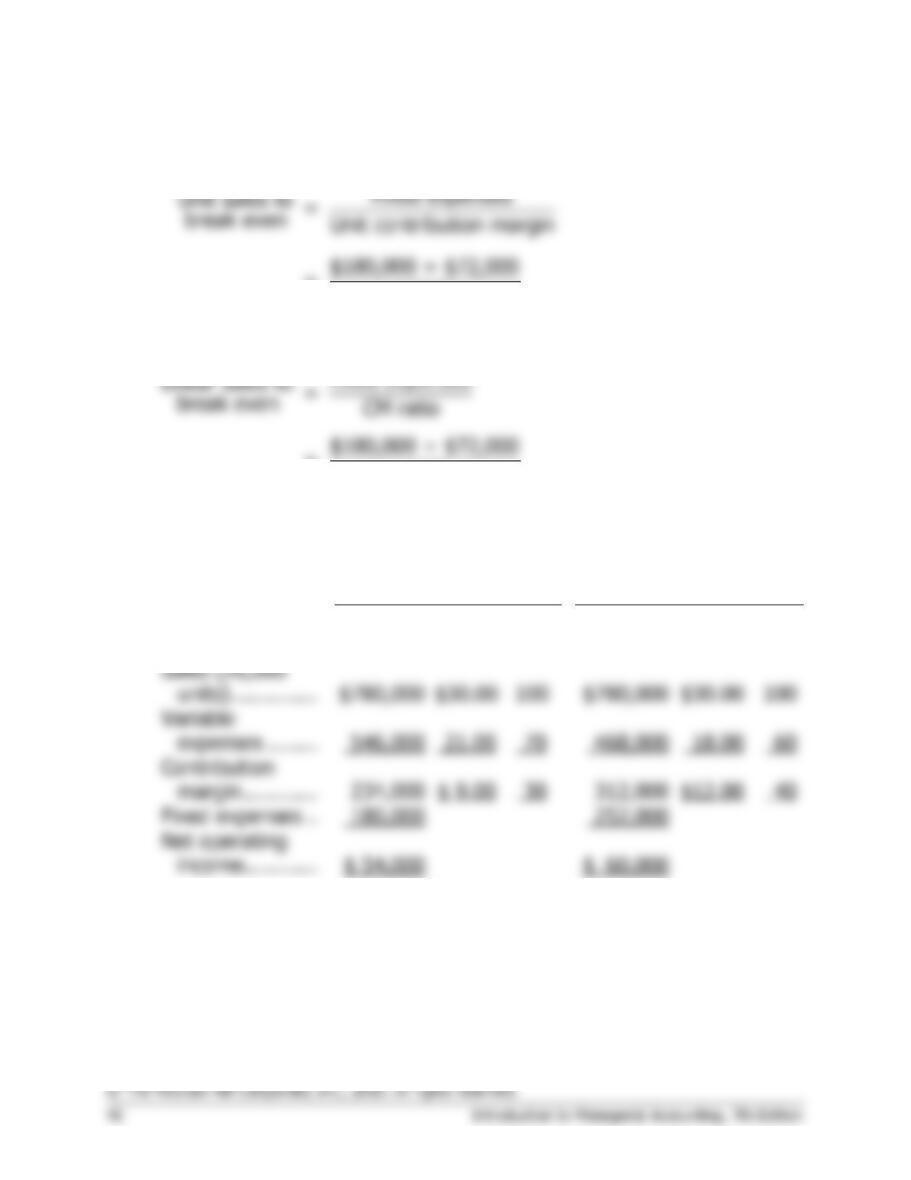
Problem 5-22A (continued)
The new break-even point would be:
Fixed expenses
Unit sales to =
break even Unit contribution margin
$180,000 + $72,000
=
$12.00
= 21,000 units
Fixed expenses
Dollar sales to =
break even CM ratio
$180,000 + $72,000
=
0.40
= $630,000
b. Comparative income statements follow:
Not Automated
Automated
Total
Per
Unit
%
Total
Per
Unit
%
Sales (26,000
units) …………..
$780,000
$30.00
100
$780,000
$30.00
100
Variable
expenses ……..
546,000
21.00
70
468,000
18.00
60
Contribution
margin …………
234,000
$ 9.00
30
312,000
$12.00
40
Fixed expenses ..
180,000
252,000
Net operating
$ 54,000
$ 60,000
Problem 5-22A (continued)
c. Whether or not the company should automate its operations depends
on how much risk the company is willing to take and on prospects for
future sales. The proposed changes would increase the company’s
fixed costs and its break-even point. However, the changes would
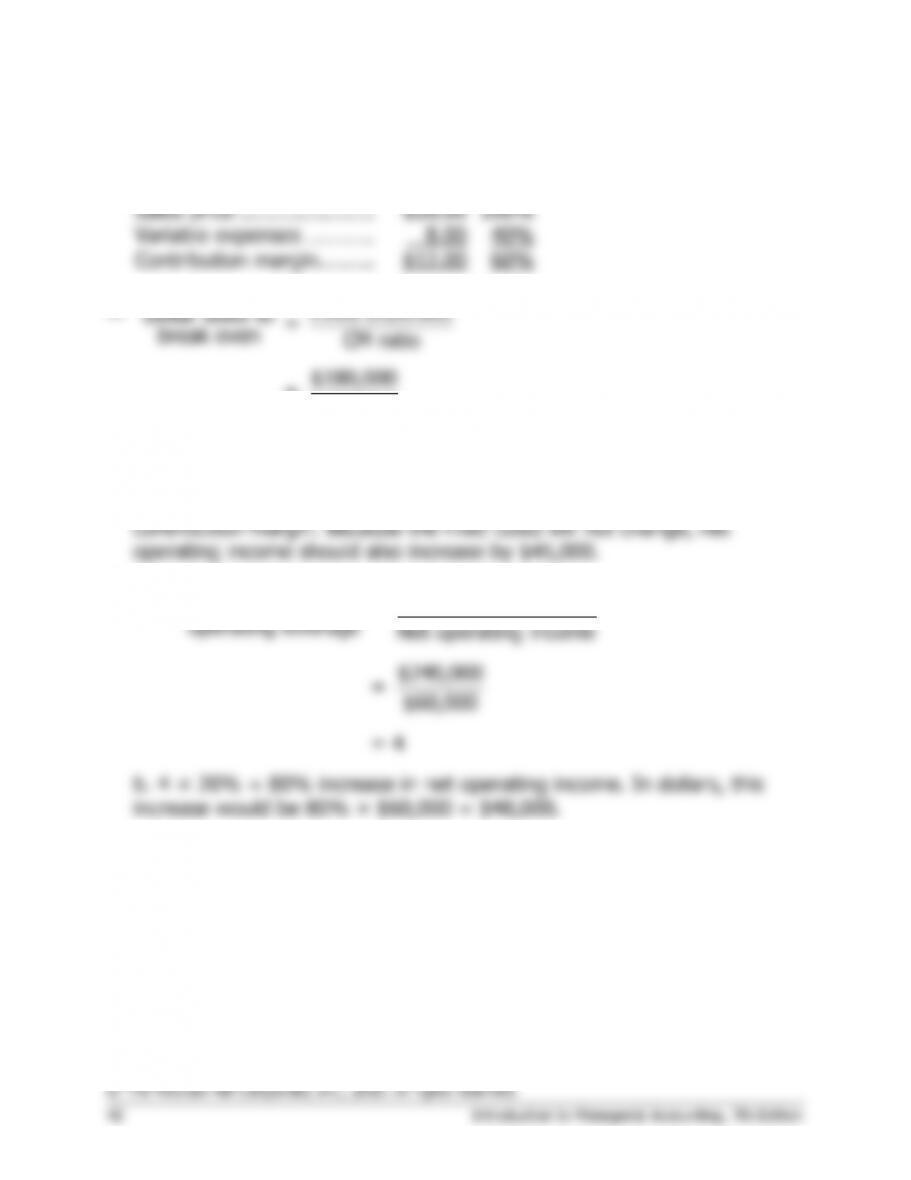
Problem 5-23A (60 minutes)
1. The CM ratio is 60%:
Sales price ………………….
$20.00
100%
Variable expenses ………..
8.00
40%
Contribution margin ………
$12.00
60%
2.
Fixed expenses
Dollar sales to =
break even CM ratio
$180,000
=
0.60
= $300,000
3. $75,000 increased sales × 0.60 CM ratio = $45,000 increased
4.
a.
Contribution margin
Degree of
=
operating leverage Net operating income
$240,000
=
$60,000
= 4
b. 4 × 20% = 80% increase in net operating income. In dollars, this
increase would be 80% × $60,000 = $48,000.
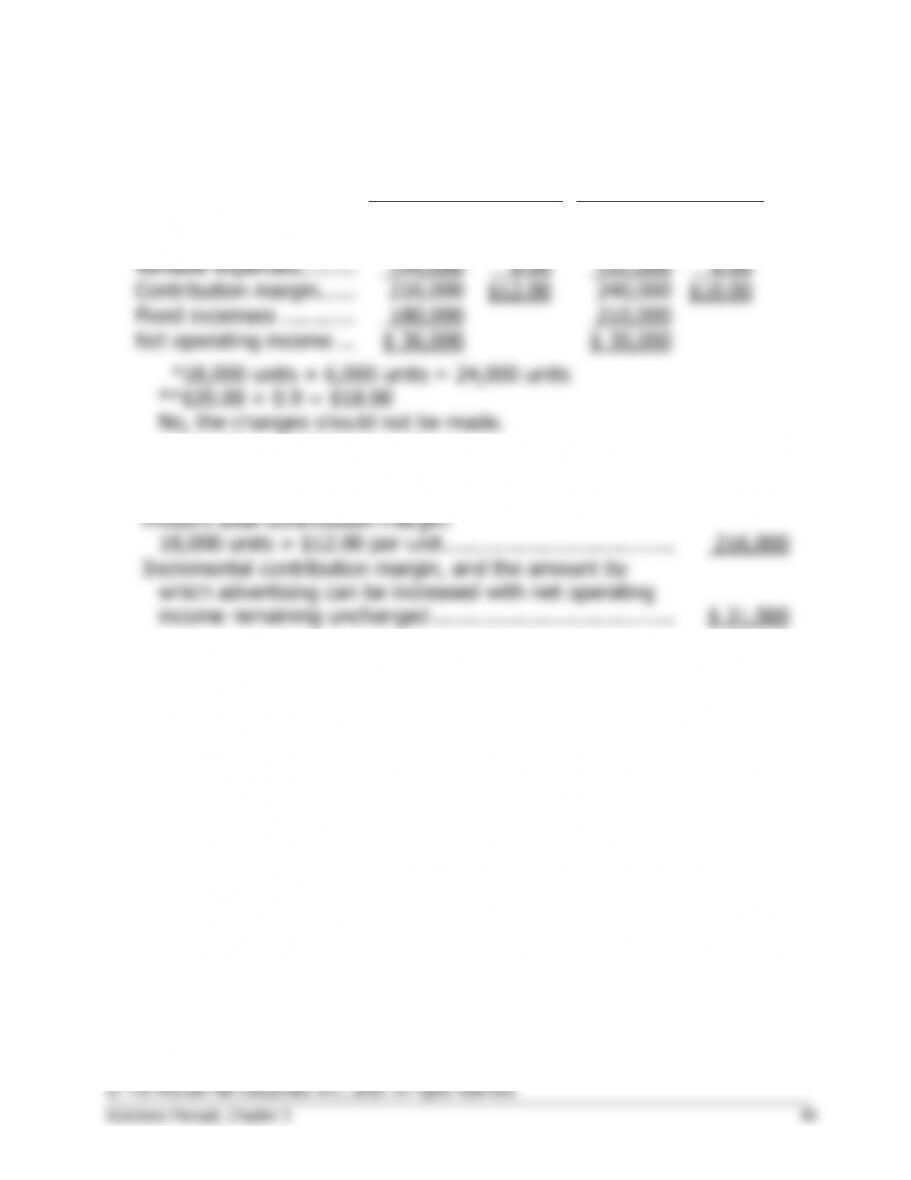
Problem 5-23A (continued)
5.
Last Year:
18,000 units
Proposed:
24,000 units*
Amount
Per Unit
Amount
Per Unit
Sales ………………………
$360,000
$20.00
$432,000
$18.00
**
Variable expenses ………
144,000
8.00
192,000
8.00
Contribution margin ……
216,000
$12.00
240,000
$10.00
Fixed expenses …………
180,000
210,000
Net operating income …
$ 36,000
$ 30,000
6.
Expected total contribution margin:
18,000 units × 1.25 × $11.00 per unit* ……………………
$247,500
Present total contribution margin:
18,000 units × $12.00 per unit ……………………………….
216,000
Incremental contribution margin, and the amount by
which advertising can be increased with net operating
income remaining unchanged …………………………………
$ 31,500
*$20.00 – ($8.00 + $1.00) = $11.00
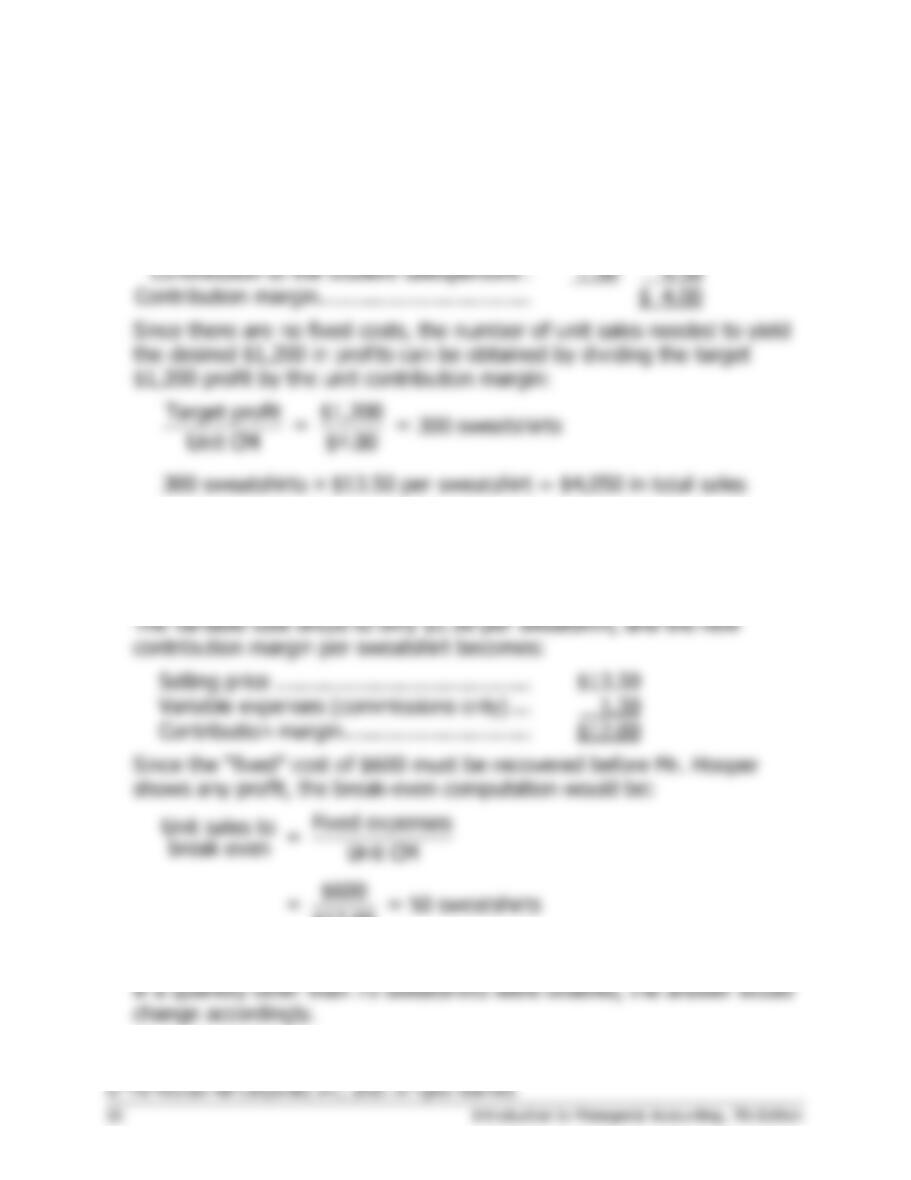
Problem 5-24A (30 minutes)
1. The contribution margin per sweatshirt would be:
Selling price ………………………………………
$13.50
Variable expenses:
Purchase cost of the sweatshirts ………….
$8.00
Commission to the student salespersons .
1.50
9.50
Contribution margin …………………………….
$ 4.00
300 sweatshirts × $13.50 per sweatshirt = $4,050 in total sales
2. Since an order has been placed, there is now a “fixed” cost associated
with the purchase price of the sweatshirts (i.e., the sweatshirts can’t be
returned). For example, an order of 75 sweatshirts requires a “fixed”
cost (investment) of $600 (=75 sweatshirts × $8.00 per sweatshirt).
Selling price …………………………………..
$13.50
Variable expenses (commissions only) …
1.50
Contribution margin …………………………
$12.00
Since the “fixed” cost of $600 must be recovered before Mr. Hooper
shows any profit, the break-even computation would be:
Fixed expenses
Unit sales to =
break even Unit CM
$600
= = 50 sweatshirts
$12.00
50 sweatshirts × $13.50 per sweatshirt = $675 in total sales
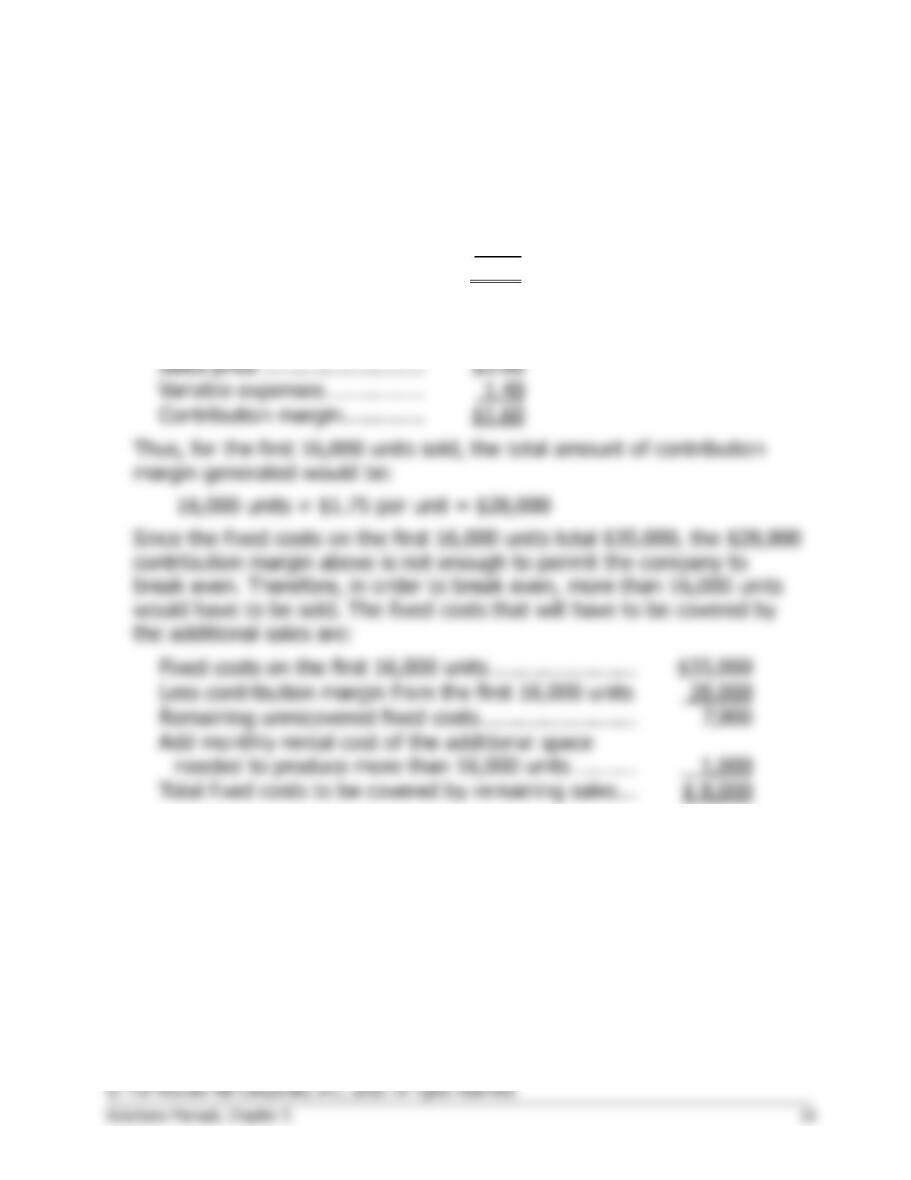
Problem 5-25A (45 minutes)
1. The contribution margin per unit on the first 16,000 units is:
Per Unit
Sales price ……………………..
$3.00
Variable expenses …………….
1.25
Contribution margin ………….
$1.75
The contribution margin per unit on anything over 16,000 units is:
Per Unit
Sales price ……………………..
$3.00
Variable expenses …………….
1.40
Contribution margin ………….
$1.60
Thus, for the first 16,000 units sold, the total amount of contribution
margin generated would be:
16,000 units × $1.75 per unit = $28,000
Since the fixed costs on the first 16,000 units total $35,000, the $28,000
contribution margin above is not enough to permit the company to
break even. Therefore, in order to break even, more than 16,000 units
would have to be sold. The fixed costs that will have to be covered by
the additional sales are:
Fixed costs on the first 16,000 units …………………..
$35,000
Less contribution margin from the first 16,000 units
28,000
Remaining unrecovered fixed costs …………………….
7,000
Add monthly rental cost of the additional space
needed to produce more than 16,000 units ……….
1,000
Total fixed costs to be covered by remaining sales …
$ 8,000
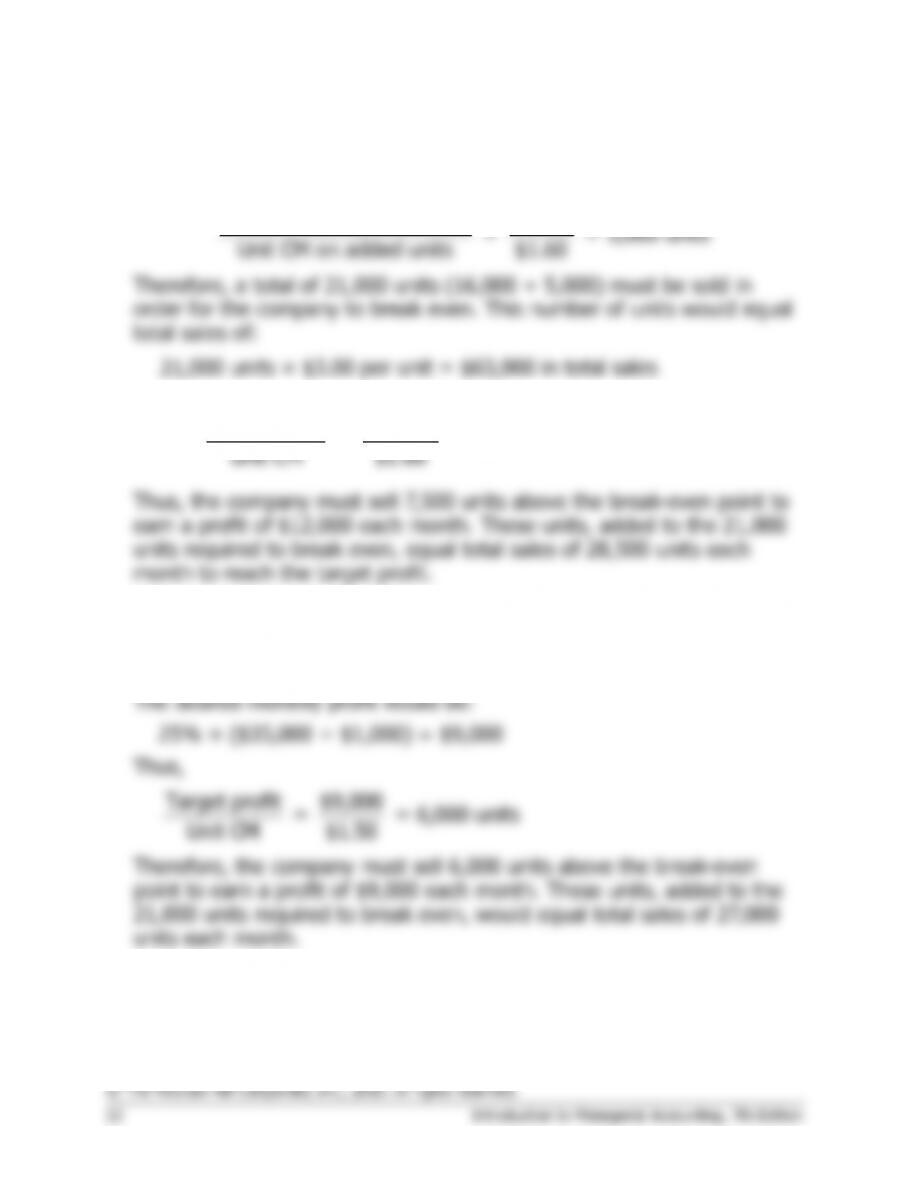
Problem 5-25A (continued)
The additional sales of units required to cover these fixed costs would
be:
Total remaining fixed costs $8,000
= = 5,000 units
Unit CM on added units $1.60
Therefore, a total of 21,000 units (16,000 + 5,000) must be sold in
order for the company to break even. This number of units would equal
total sales of:
21,000 units × $3.00 per unit = $63,000 in total sales
2.
Target profit $12,000
= = 7,500 units
Unit CM $1.60
3. If a bonus of $0.10 per unit is paid for each unit sold in excess of the
break-even point, then the contribution margin on these units would
drop from $1.60 to $1.50 per unit.
Problem 5-26A (60 minutes)
1.
Profit
= Unit CM × Q − Fixed expenses
$0
= ($30 − $18) × Q − $150,000
$0
= ($12) × Q − $150,000
$12Q
= $150,000
Q
= $150,000 ÷ $12
Q
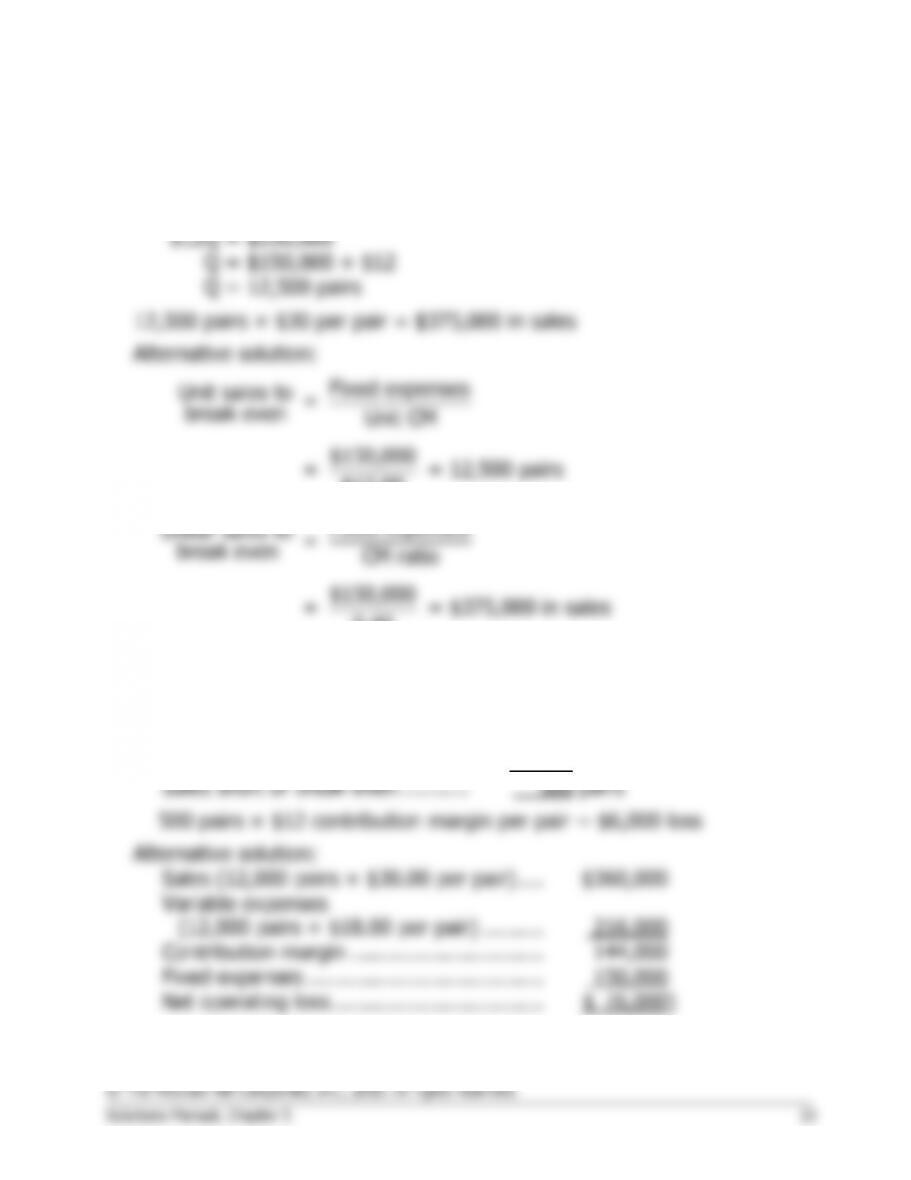
= 12,500 pairs
12,500 pairs × $30 per pair = $375,000 in sales
Alternative solution:
Fixed expenses
Unit sales to =
break even Unit CM
$150,000
= = 12,500 pairs
$12.00
Fixed expenses
Dollar sales to =
break even CM ratio
$150,000
= = $375,000 in sales
0.40
2. See the graph on the following page.
3. The simplest approach is:
Break-even sales ……………………
12,500 pairs
Actual sales ………………………….
12,000 pairs
Sales short of break-even ………..
500 pairs
500 pairs × $12 contribution margin per pair = $6,000 loss
Alternative solution:
Sales (12,000 pairs × $30.00 per pair) ….
$360,000
Variable expenses
(12,000 pairs × $18.00 per pair) ……….
216,000
Contribution margin ………………………….
Fixed expenses ………………………………..
Net operating loss …………………………….
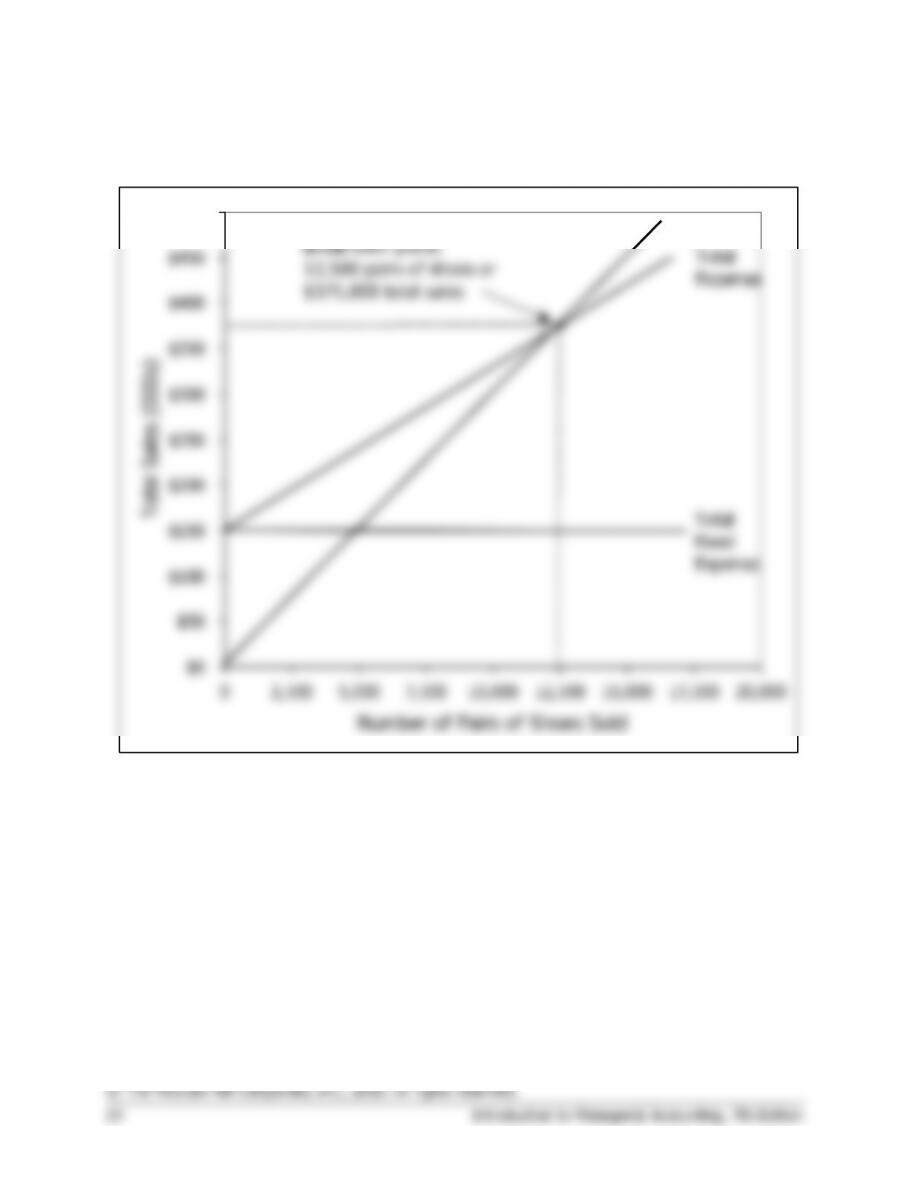
Problem 5-26A (continued)
2. Cost-volume-profit graph:
$0
$50
$100
$150
$200
$250
$300
$350
$400
$450
$500
0 2,500 5,000 7,500 10,000 12,500 15,000 17,500 20,000
Number of Pairs of Shoes Sold
Total Sales (000s)
Break-even point:
12,500 pairs of shoes or
$375,000 total sales
Total Sales
Total
Expense
Total
Fixed
Expense
Problem 5-26A (continued)
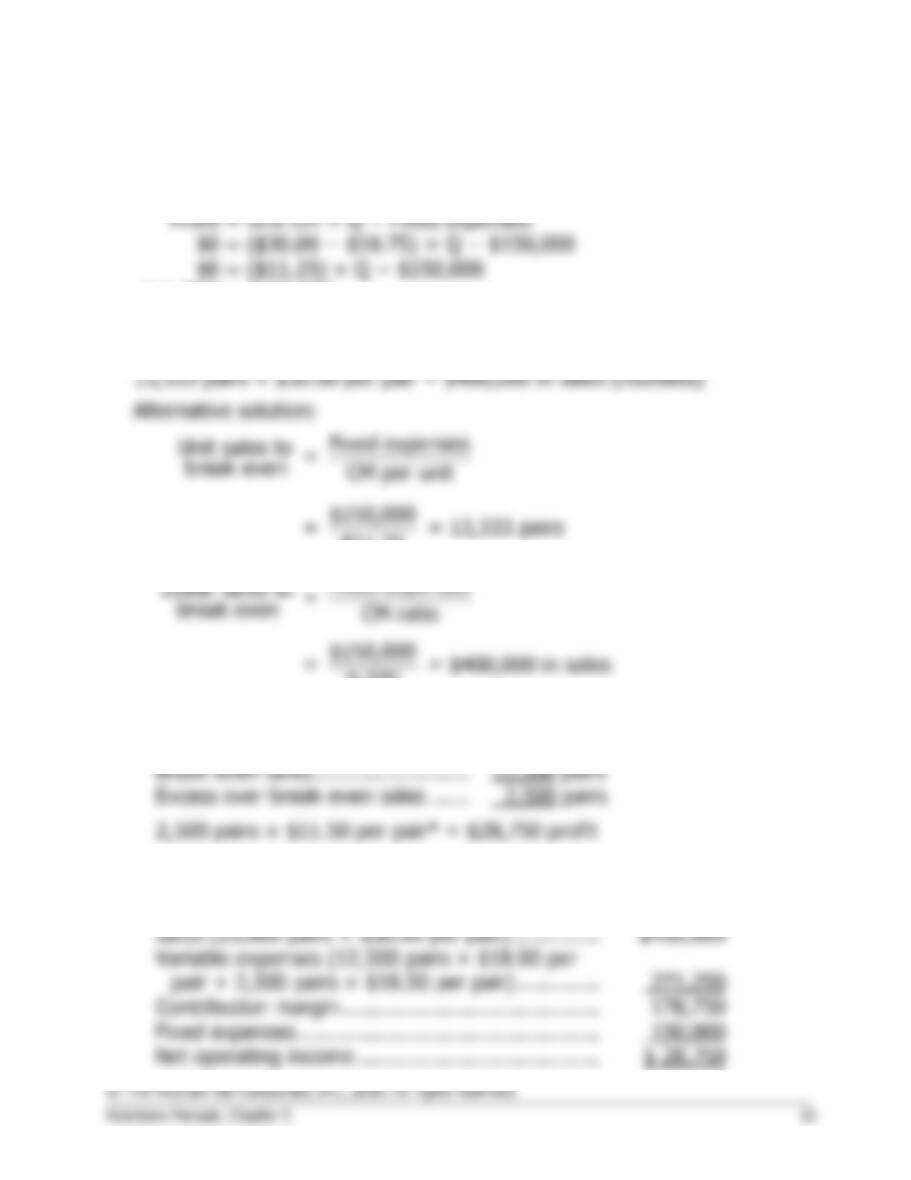
4. The variable expenses will now be $18.75 ($18.00 + $0.75) per pair,
and the contribution margin will be $11.25 ($30.00 – $18.75) per pair.
Profit
= Unit CM × Q − Fixed expenses
$0
= ($30.00 − $18.75) × Q − $150,000
$0
= ($11.25) × Q − $150,000
$11.25Q
= $150,000
Q
= $150,000 ÷ $11.25
Q
= 13,333 pairs (rounded)
Fixed expenses
Unit sales to =
break even CM per unit
$150,000
= = 13,333 pairs
$11.25
Fixed expenses
Dollar sales to =
break even CM ratio
$150,000
= = $400,000 in sales
0.375
5. The simplest approach is:
Actual sales …………………………..
15,000 pairs
Break-even sales …………………….
12,500 pairs
Excess over break-even sales ……
2,500 pairs
2,500 pairs × $11.50 per pair* = $28,750 profit
*$12.00 present contribution margin – $0.50 commission = $11.50
Alternative solution:
Sales (15,000 pairs × $30.00 per pair) …………..
Contribution margin …………………………………..
Fixed expenses …………………………………………
150,000
Net operating income …………………………………
$ 28,750
Problem 5-26A (continued)
6. The new variable expenses will be $13.50 per pair.
Profit
= Unit CM × Q − Fixed expenses
$0
= ($30.00 − $13.50) × Q − $181,500
$0
= ($16.50) × Q − $181,500
$16.50Q
= $181,500
Q
= $181,500 ÷ $16.50
Q
= 11,000 pairs
11,000 pairs × $30.00 per pair = $330,000 in sales
Problem 5-27A (45 minutes)
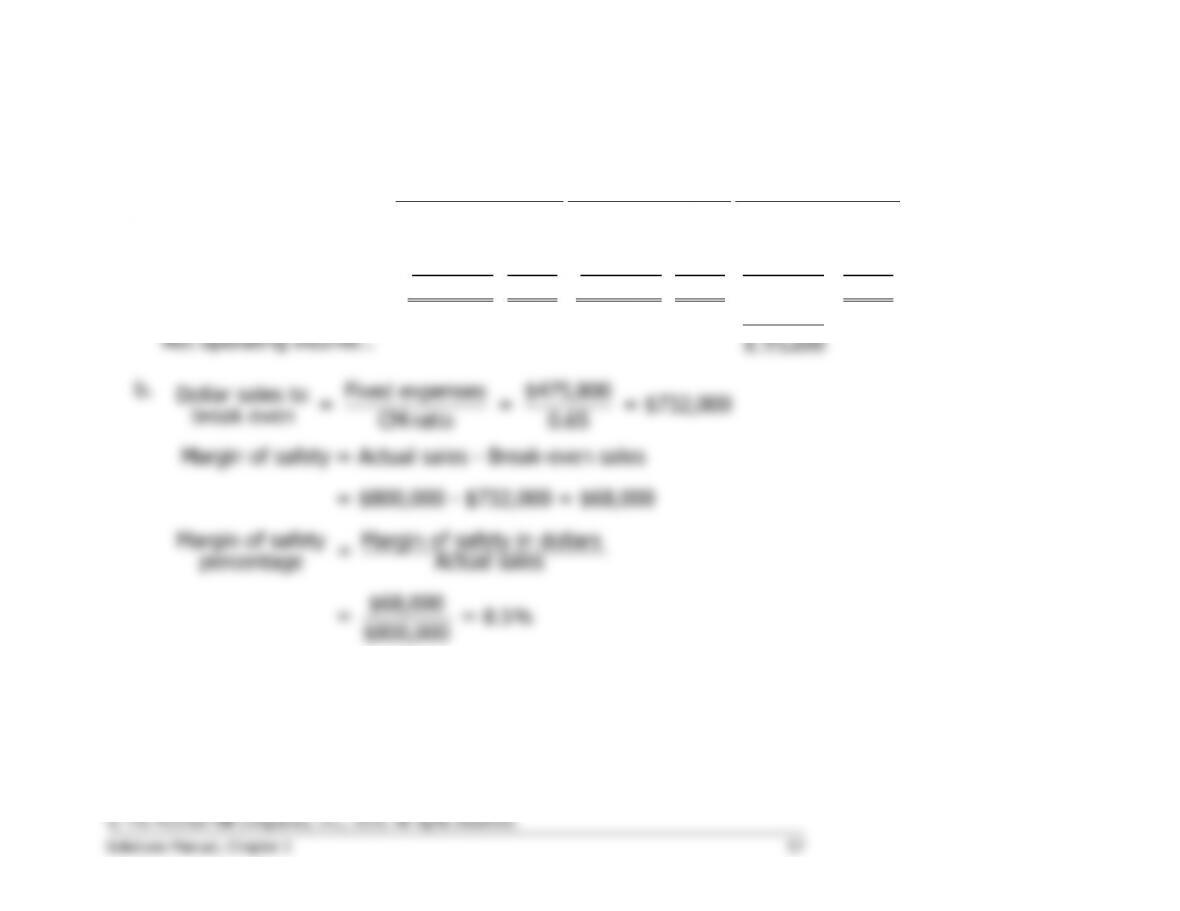
1.
a.
Hawaiian
Fantasy
Tahitian
Joy
Total
Amount
%
Amount
%
Amount
%
Sales ……………………..
$300,000
100%
$500,000
100%
$800,000
100%
Variable expenses …….
180,000
60%
100,000
20%
280,000
35%
Contribution margin ….
$120,000
40%
$400,000
80%
520,000
65%
Fixed expenses ………..
475,800
Net operating income ..
$ 44,200
b.
Fixed expenses $475,800
Dollar sales to = = = $732,000
break even CM ratio 0.65
Margin of safety = Actual sales – Break-even sales
= $800,000 – $732,000 = $68,000
Margin of safety Margin of safety in dollars
=
percentage Actual sales
$68,000
= = 8.5%
$800,000
Problem 5-27A (continued)
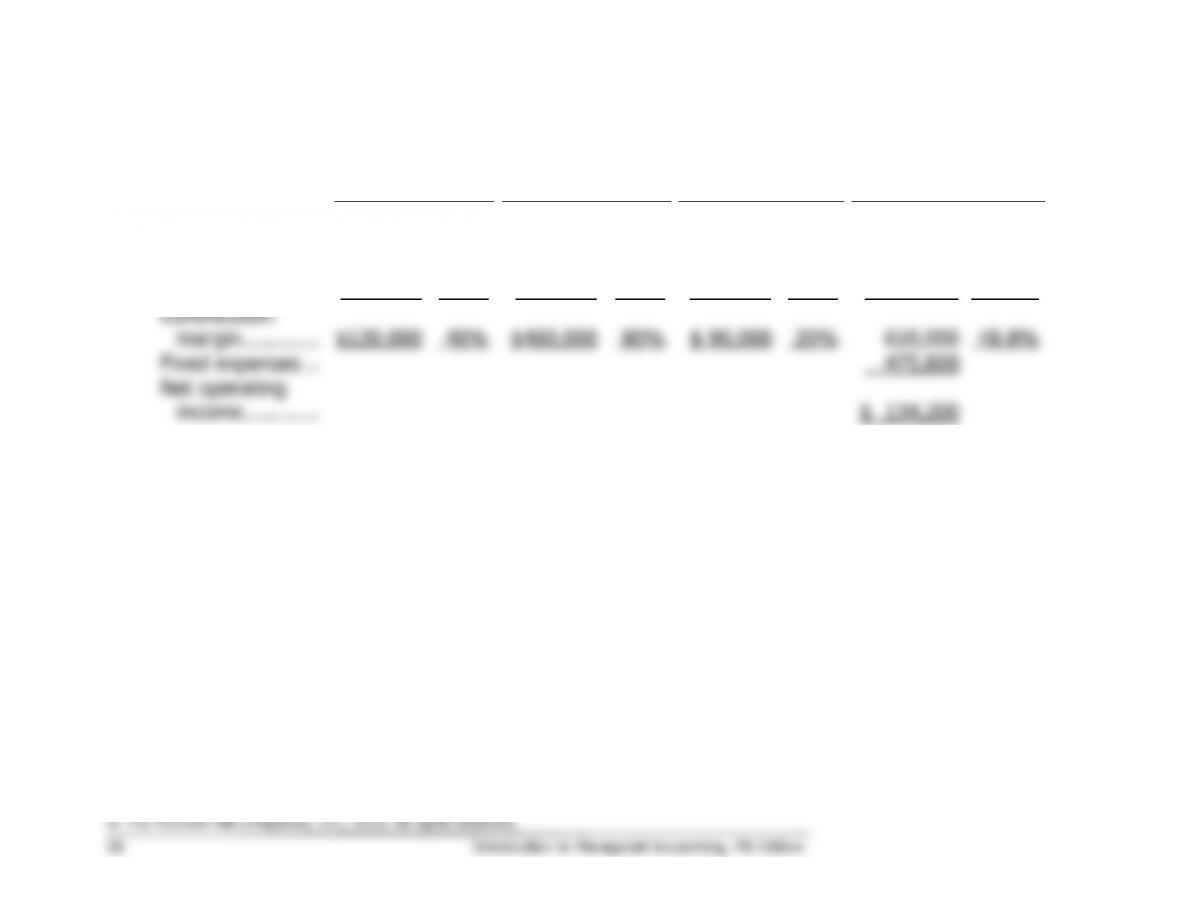
2.
a.
Hawaiian
Fantasy
Tahitian
Joy
Samoan
Delight
Total
Amount
%
Amount
%
Amount
%
Amount
%
Sales ……………..
$300,000
100%
$500,000
100%
$450,000
100%
$1,250,000
100.0%
Variable
expenses ………
180,000
60%
100,000
20%
360,000
80%
640,000
51.2%
Contribution
margin …………
$120,000
40%
$400,000
80%
$ 90,000
20%
610,000
48.8%
Fixed expenses ..
475,800
Net operating
income …………
$ 134,200
Problem 5-27A (continued)
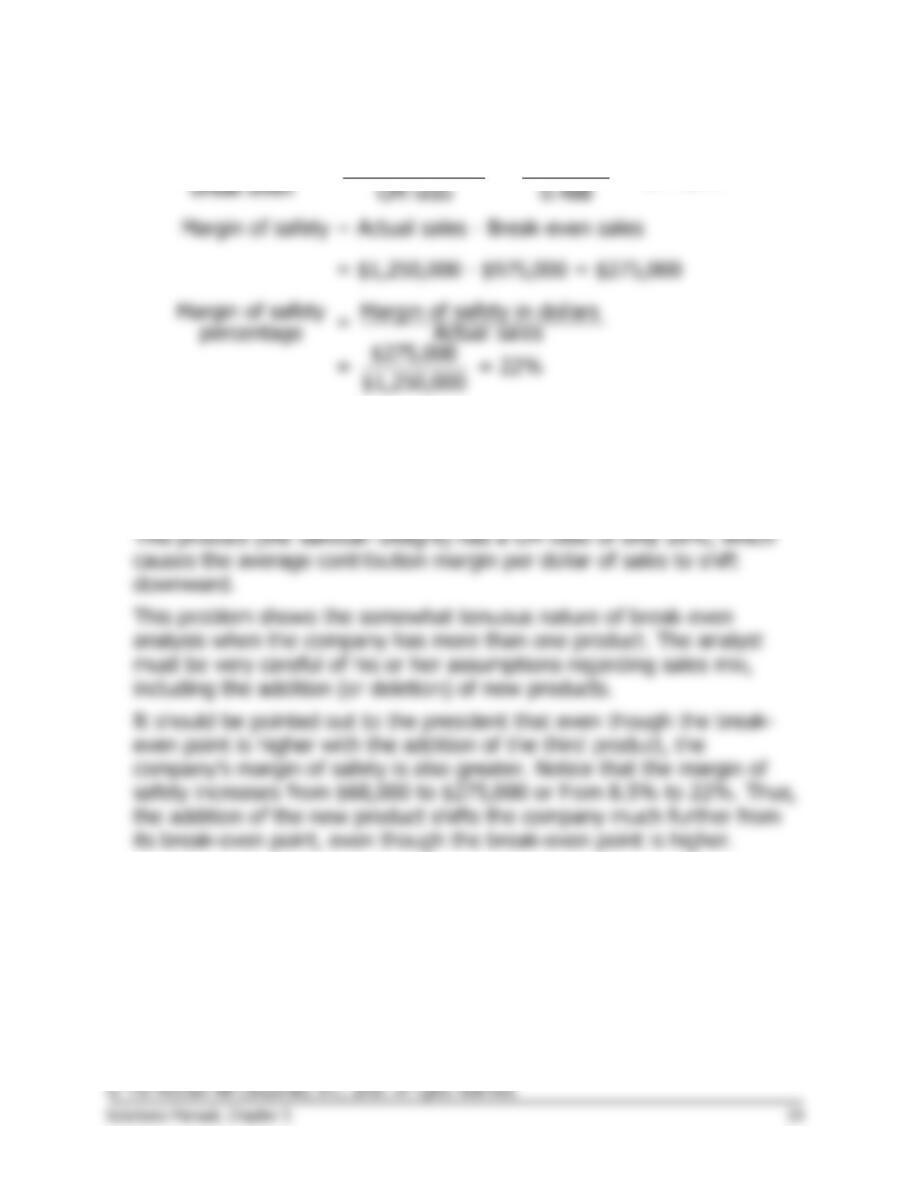
b.
Fixed expenses $475,800
Dollar sales to = = = $975,000
break even CM ratio 0.488
Margin of safety = Actual sales – Break-even sales
= $1,250,000 – $975,000 = $275,000
Margin of safety Margin of safety in dollars
=
percentage Actual sales
$275,000
= = 22%
$1,250,000
3. The reason for the increase in the break-even point can be traced to the
decrease in the company’s overall contribution margin ratio when the
third product is added. Note from the income statements above that this
ratio drops from 65% to 48.8% with the addition of the third product.
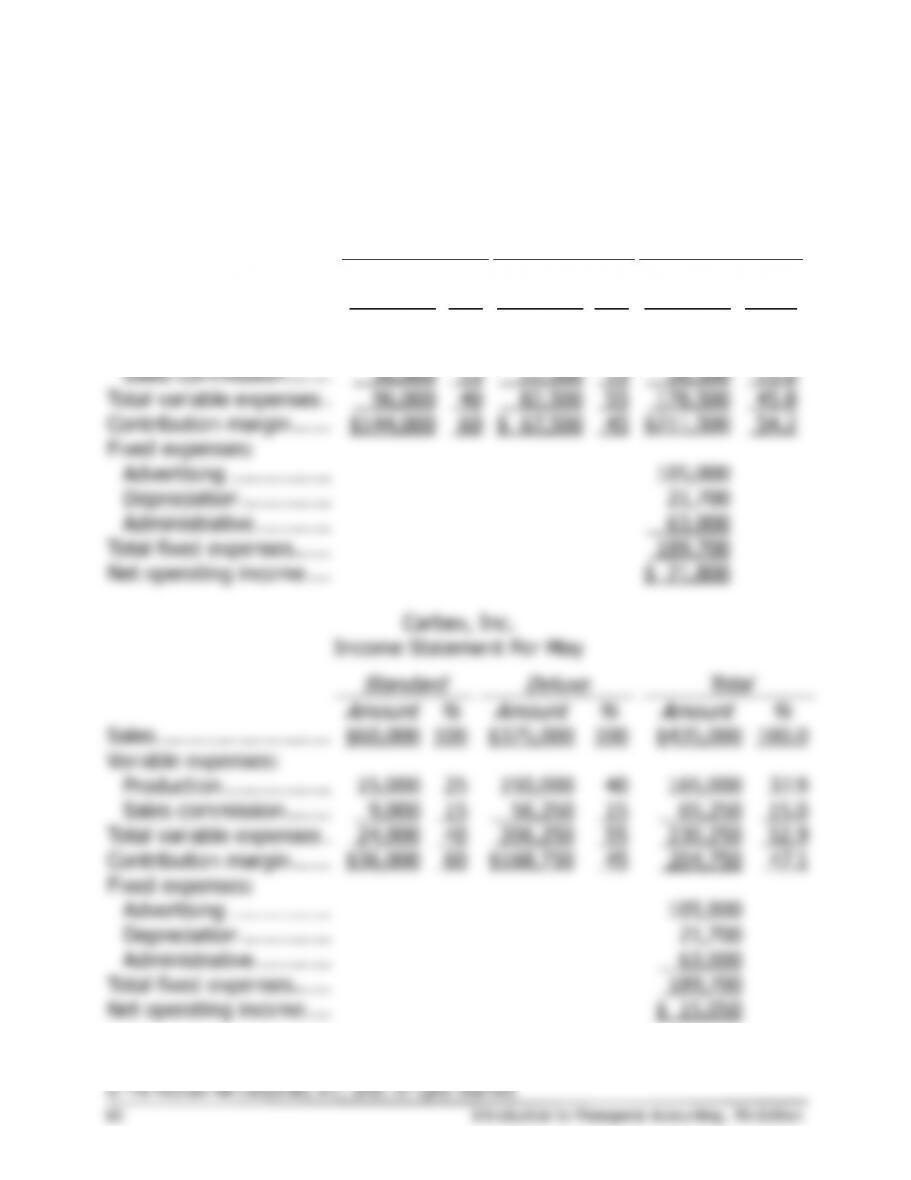
Problem 5-28A (60 minutes)
1.
Carbex, Inc.
Income Statement For April
Standard
Deluxe
Total
Amount
%
Amount
%
Amount
%
Sales ……………………….
$240,000
100
$150,000
100
$390,000
100.0
Variable expenses:
Production ……………..
60,000
25
60,000
40
120,000
30.8
Sales commission …….
36,000
15
22,500
15
58,500
15.0
Total variable expenses .
96,000
40
82,500
55
178,500
45.8
Contribution margin ……
$144,000
60
$ 67,500
45
$211,500
54.2
Fixed expenses:
Advertising …………….
105,000
Depreciation …………..
21,700
Administrative …………
63,000
Total fixed expenses ……
189,700
Net operating income ….
$ 21,800
Carbex, Inc.
Income Statement For May
Standard
Deluxe
Total
Amount
%
Amount
%
Amount
%
Sales ……………………….
$60,000
100
$375,000
100
$435,000
100.0
Variable expenses:
Production ……………..
15,000
25
150,000
40
165,000
37.9
Sales commission …….
9,000
15
56,250
15
65,250
15.0
Total variable expenses .
24,000
40
206,250
55
230,250
52.9
Contribution margin ……
$36,000
60
$168,750
45
204,750
47.1
Fixed expenses:
Advertising …………….
105,000
Depreciation …………..
21,700
Administrative …………
63,000
Total fixed expenses ……
189,700
Net operating income ….
$ 15,050