Problem 5-25B (45 minutes)
1.
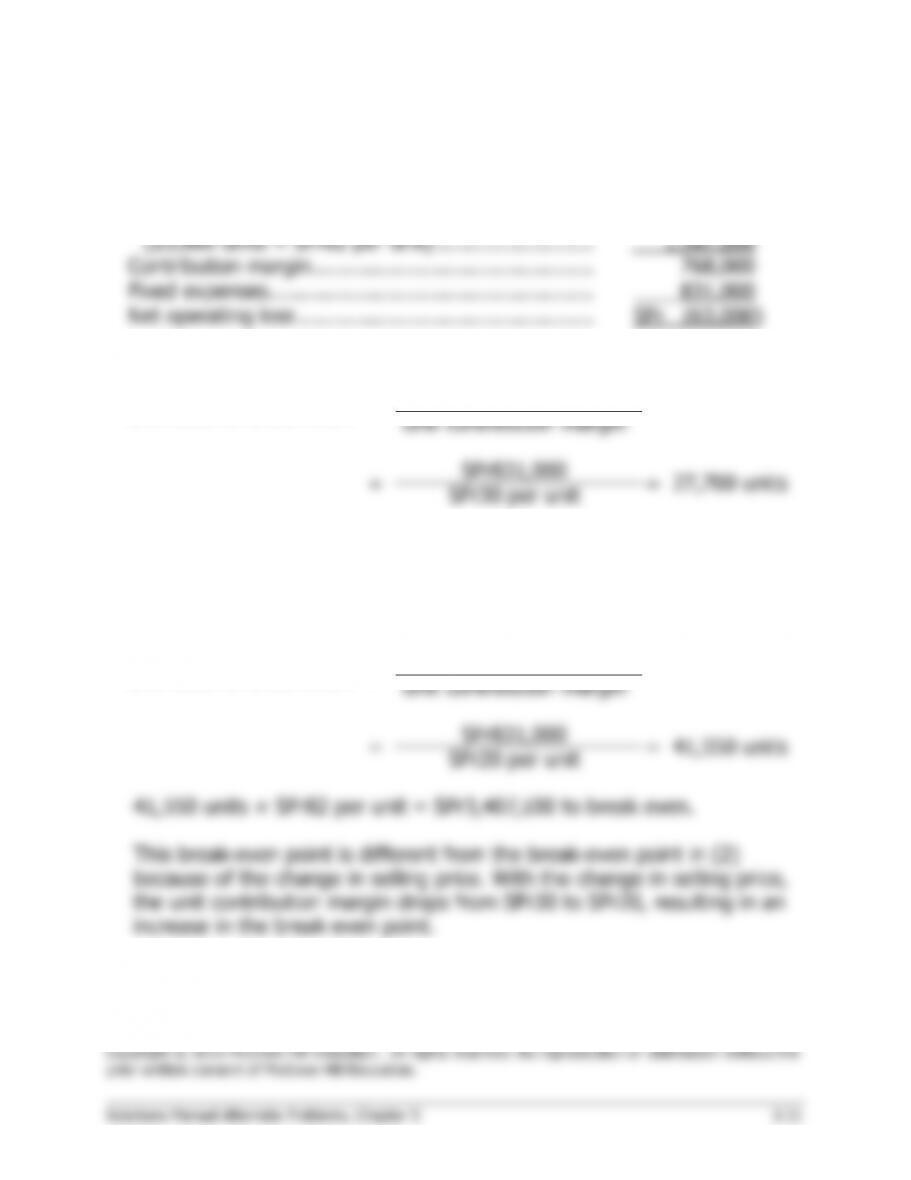
Sales (25,600 units × SFr92 per unit) ……………….
SFr2,355,200
Variable expenses
(25,600 units × SFr62 per unit) …………………….
1,587,200
Contribution margin ………………………………………
768,000
Fixed expenses …………………………………………….
831,000
Net operating loss ………………………………………..
SFr (63,000)
2.
Unit sales to break even
=
Fixed expenses
Unit contribution margin
=
SFr831,000
=
27,700 units
SFr30 per unit
3. See the next page.
4. At a selling price of SFr82 per unit, the contribution margin is SFr20 per
unit. Therefore:
Unit sales to break even
=
Fixed expenses
Unit contribution margin
=
SFr831,000
=
41,550 units
SFr20 per unit
41,550 units × SFr82 per unit = SFr3,407,100 to break even.
This break–even point is different from the break-even point in (2)
because of the change in selling price. With the change in selling price,
the unit contribution margin drops from SFr30 to SFr20, resulting in an
increase in the break-even point.
Problem 5-25B (continued)
3.
Unit
Selling
Price
Unit
Variable
Expense
Unit
Contribution
Margin
Volume
Total
Contribution
Margin
Fixed
Expenses
Net
Operating
Income
(SFrs)
(SFrs)
(SFrs)
(Units)
(SFrs)
(SFrs)
(SFrs)
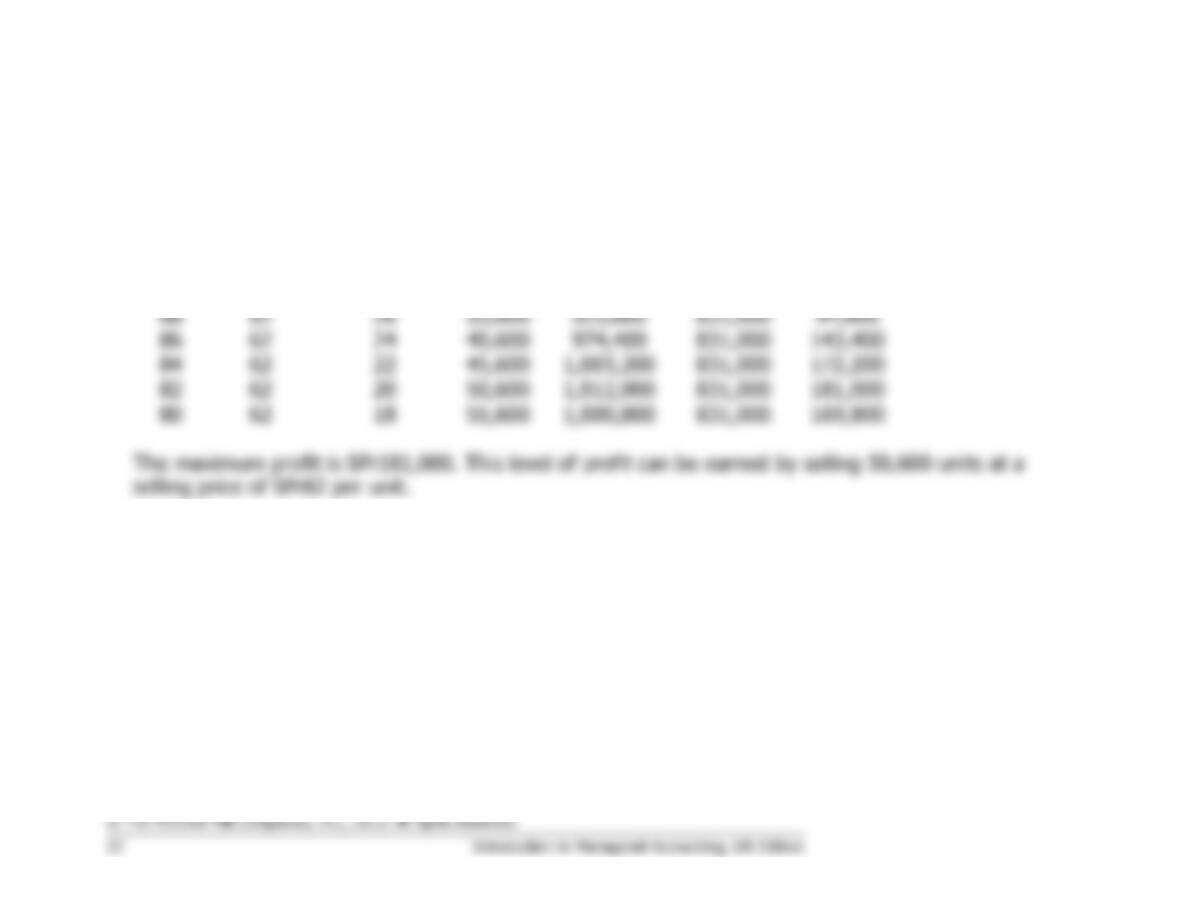
92
62
30
25,600
768,000
831,000
(63,000)
90
62
28
30,600
856,800
831,000
25,800
88
62
26
35,600
925,600
831,000
94,600
86
62
24
40,600
974,400
831,000
143,400
84
62
22
45,600
1,003,200
831,000
172,200
82
62
20
50,600
1,012,000
831,000
181,000
80
62
18
55,600
1,000,800
831,000
169,800
Problem 5-26B (60 minutes)
1. The income statements would be:
Present
Amount
Per Unit
%
Sales …………………………
$1,218,000
$29.00
100%
Variable expenses …………
852,600
20.30
70%
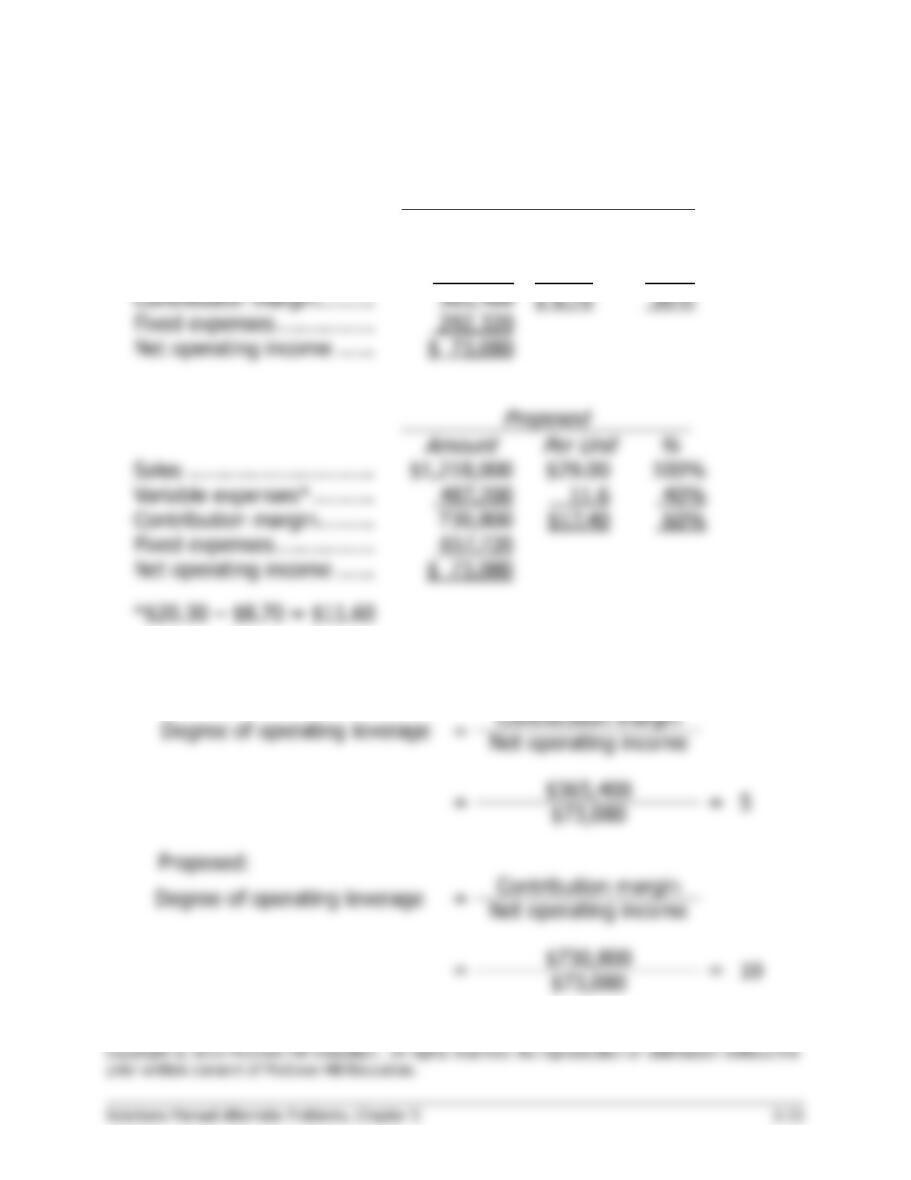
Contribution margin ………
365,400
$ 8.70
30%
Fixed expenses …………….
292,320
Net operating income ……
$ 73,080
Proposed
Amount
Per Unit
%
Sales …………………………
$1,218,000
$29.00
100%
Variable expenses* ……….
487,200
11.6
40%
Contribution margin ………
730,800
$17.40
60%
Fixed expenses …………….
657,720
Net operating income ……
$ 73,080
*$20.30 – $8.70 = $11.60
2. a. Degree of operating leverage:
Present:
Degree of operating leverage
=
Contribution margin
Net operating income
=
$365,400
=
5
$73,080
Proposed:
Degree of operating leverage
=
Contribution margin
Net operating income
=
$730,800
=
10
$73,080
Problem 5-26B (continued)
2. b. Dollar sales to break even:
Present:
Dollar sales to break even
=
Fixed expenses
CM ratio
=
$292,320
=
$974,400
.30
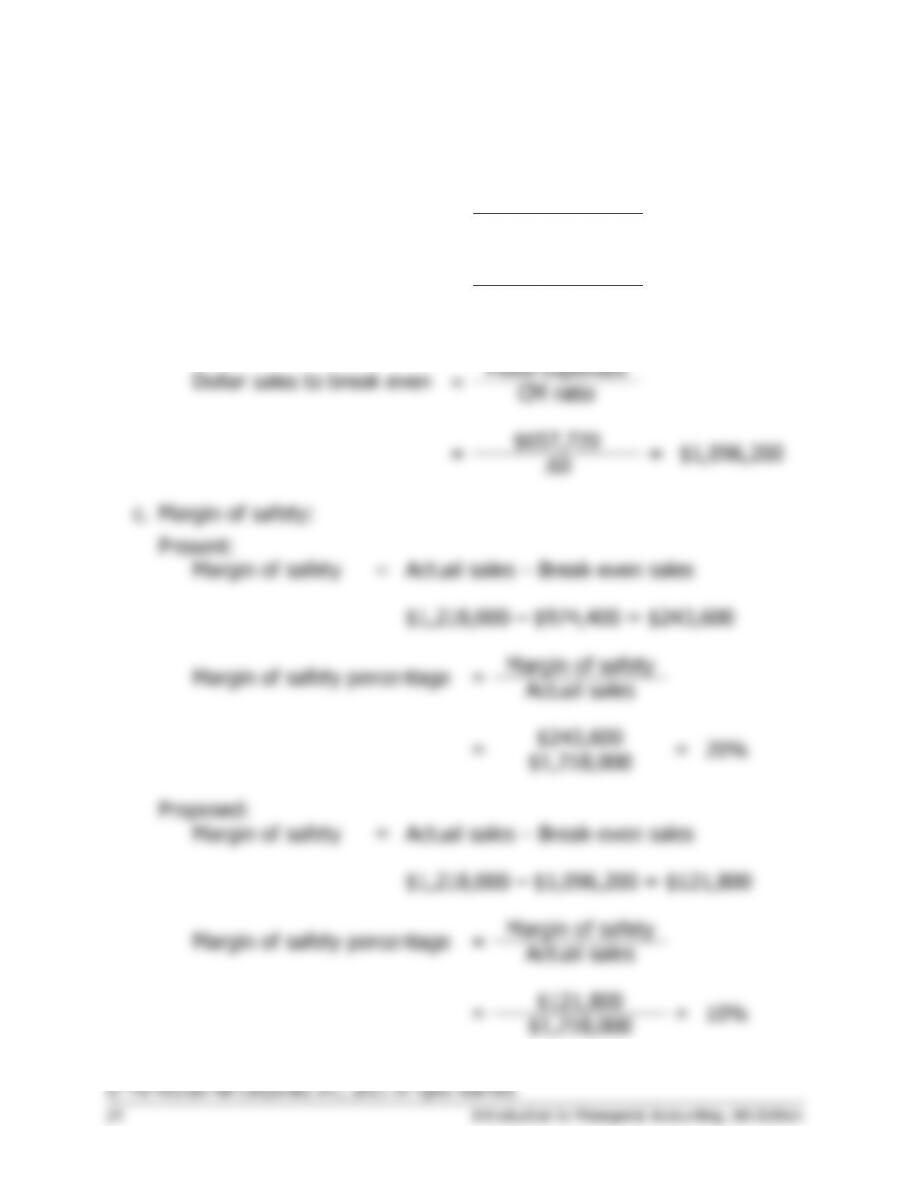
Proposed:
Dollar sales to break even
=
Fixed expenses
CM ratio
=
$657,720
=
$1,096,200
.60
c. Margin of safety:
Present:
Margin of safety
=
Actual sales – Break-even sales
$1,218,000 – $974,400 = $243,600
Margin of safety percentage
=
Margin of safety
Actual sales
=
$243,600
=
20%
$1,218,000
Proposed:
Margin of safety
=
Actual sales – Break-even sales
$1,218,000 – $1,096,200 = $121,800
Margin of safety percentage
=
Margin of safety
Actual sales
=
$121,800
=
10%
$1,218,000
Problem 5-26B (continued)
3. The major factor would be the sensitivity of the company’s operations to
cyclical movements in the economy. Because the new equipment will
increase the CM ratio, in years of strong economic activity, the company
4. No information is given in the problem concerning the new variable
expenses or the new contribution margin ratio. Both of these items must
be determined before the new break-even point can be computed. The
computations are:
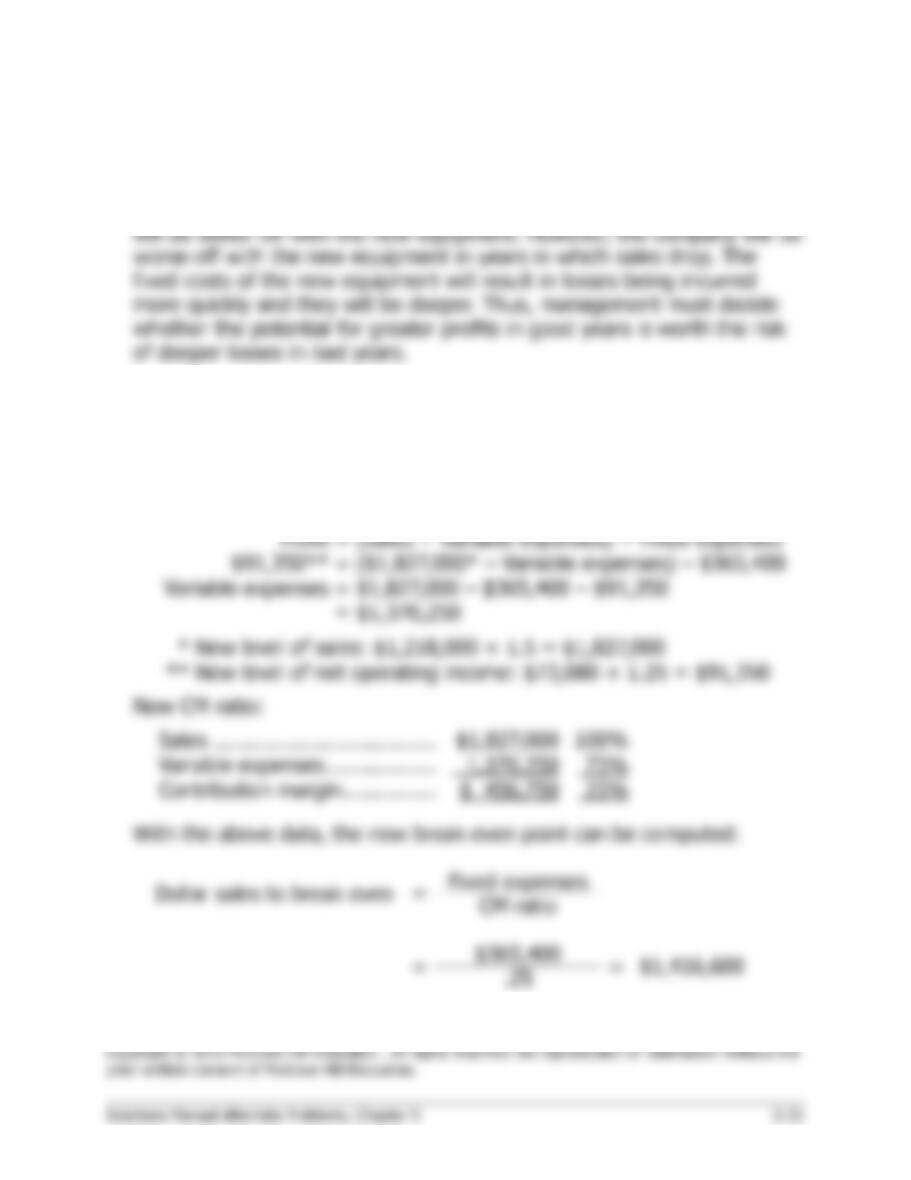
New variable expenses:
Profit
= (Sales − Variable expenses) − Fixed expenses
$91,350**
= ($1,827,000* – Variable expenses) – $365,400
Variable expenses
= $1,827,000 – $365,400 – $91,350
= $1,370,250
*
New level of sales: $1,218,000 × 1.5 = $1,827,000
**
New level of net operating income: $73,080 × 1.25 = $91,350
New CM ratio:
Sales ………………………………
$1,827,000
100%
Variable expenses ………………
1,370,250
75%
Contribution margin ……………
$ 456,750
25%
With the above data, the new break–even point can be computed:
Dollar sales to break even
=
Fixed expenses
CM ratio
=
$365,400
=
$1,416,600
.25

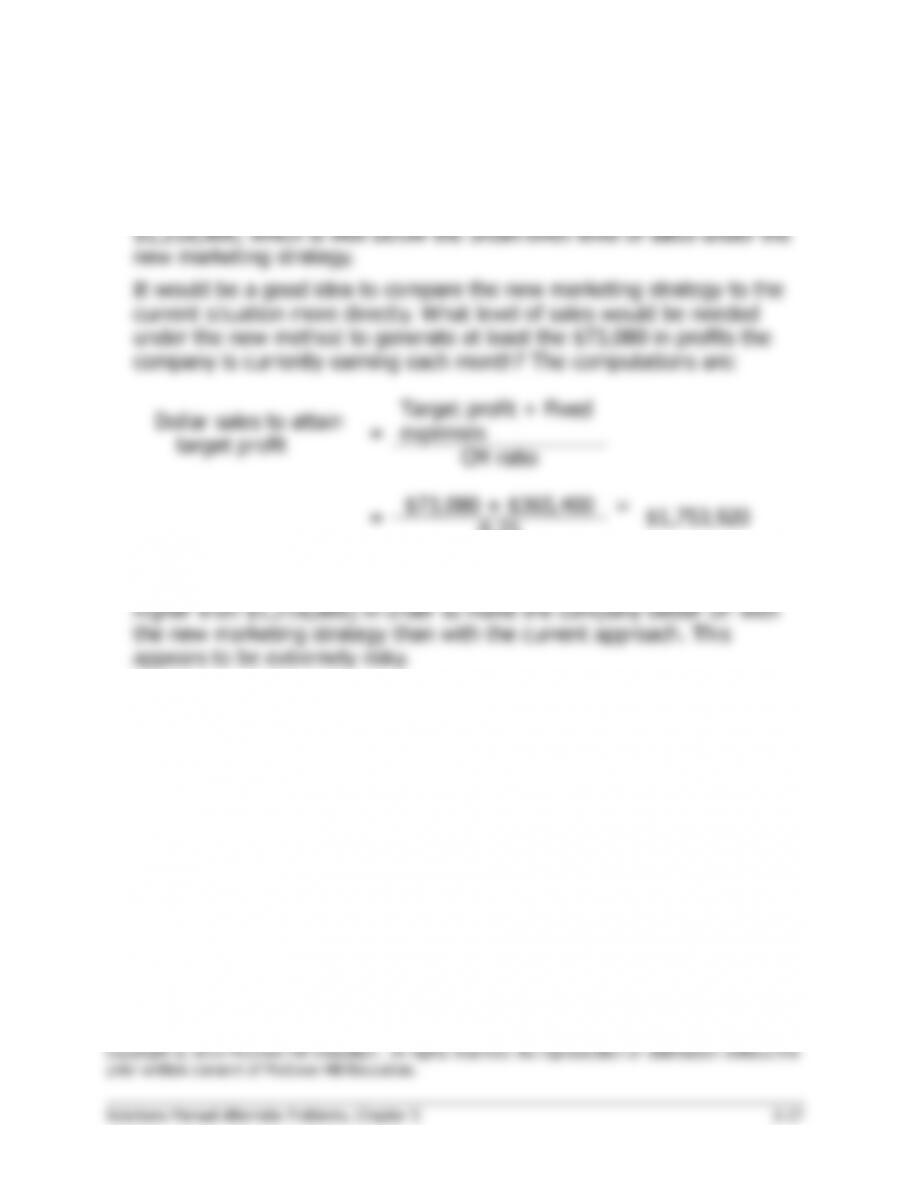
Problem 5-26B (continued)
The greatest risk is that the increases in sales and net operating income
predicted by the marketing manager will not happen and that sales will
remain at their present level. Note that the present level of sales is
Problem 5-27B (30 minutes)
1. The numbered components are as follows:
(1)
Dollars of revenue and costs.
(2)
Volume of output, expressed in units, % of capacity, sales,
or some other measure of activity.
(3)
Total expense line.
(4)
Variable expense area.
(5)
Fixed expense area.
(6)
Break-even point.
(7)
Loss area.
(8)
Profit area.
(9)
Revenue line.
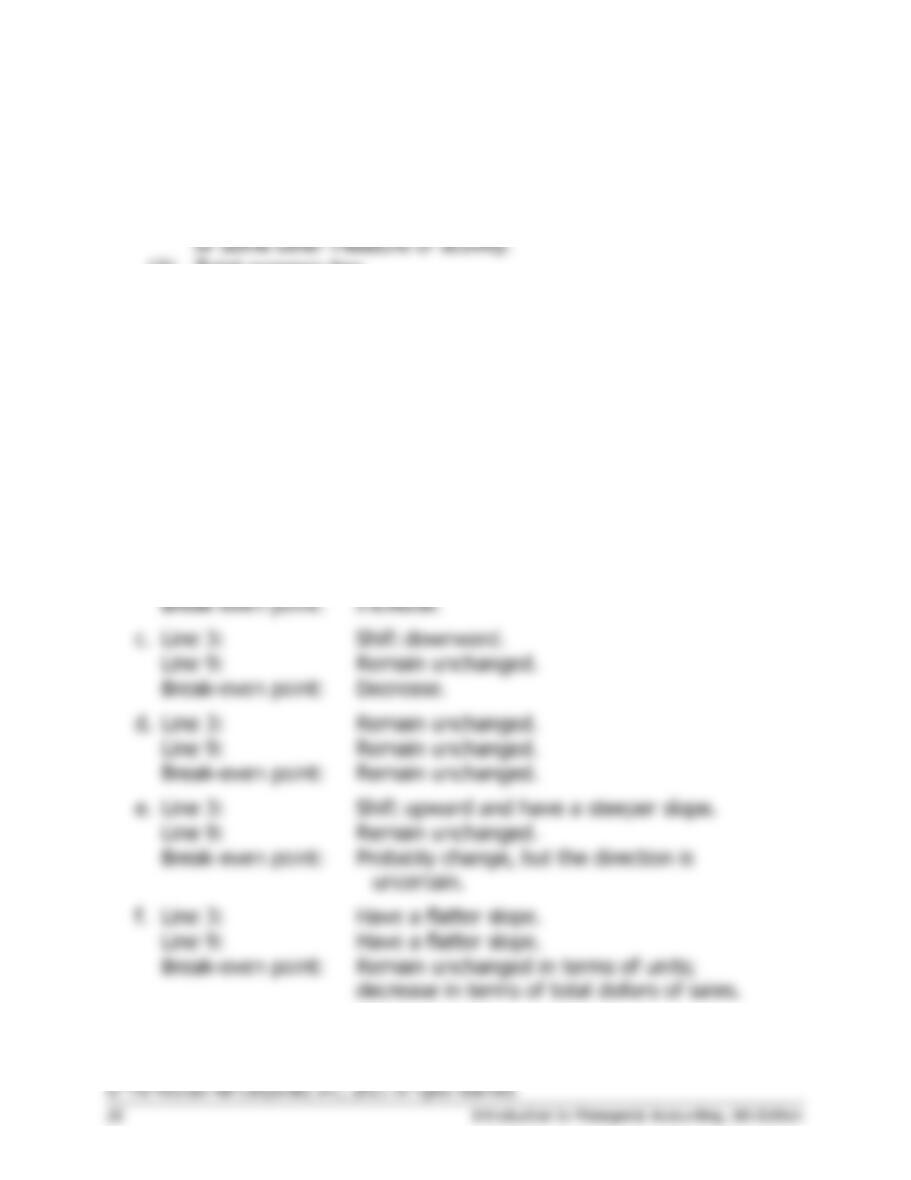
2.
a.
Line 3:
Remain unchanged.
Line 9:
Have a flatter slope.
Break-even point:
Increase.
b.
Line 3:
Have a steeper slope.
Line 9:
Remain unchanged.
Break-even point:
Increase.
c.
Line 3:
Shift downward.
Line 9:
Remain unchanged.
Break-even point:
Decrease.
d.
Line 3:
Remain unchanged.
Line 9:
Remain unchanged.
Break-even point:
Remain unchanged.
e.
Line 3:
Shift upward and have a steeper slope.
Line 9:
Remain unchanged.
Break-even point:
Probably change, but the direction is
uncertain.
f.
Line 3:
Have a flatter slope.
Line 9:
Have a flatter slope.
Break-even point:
Remain unchanged in terms of units;
decrease in terms of total dollars of sales.
Problem 5-27B (continued)
g.
Line 3:
Shift downward.
Line 9:
Remain unchanged.
Break-even point:
Decrease.
h.
Line 3:
Shift upward and have a flatter slope.
Line 9:
Remain unchanged.
Break-even point:
Probably change, but the direction is
uncertain.
Problem 5-28B (60 minutes)
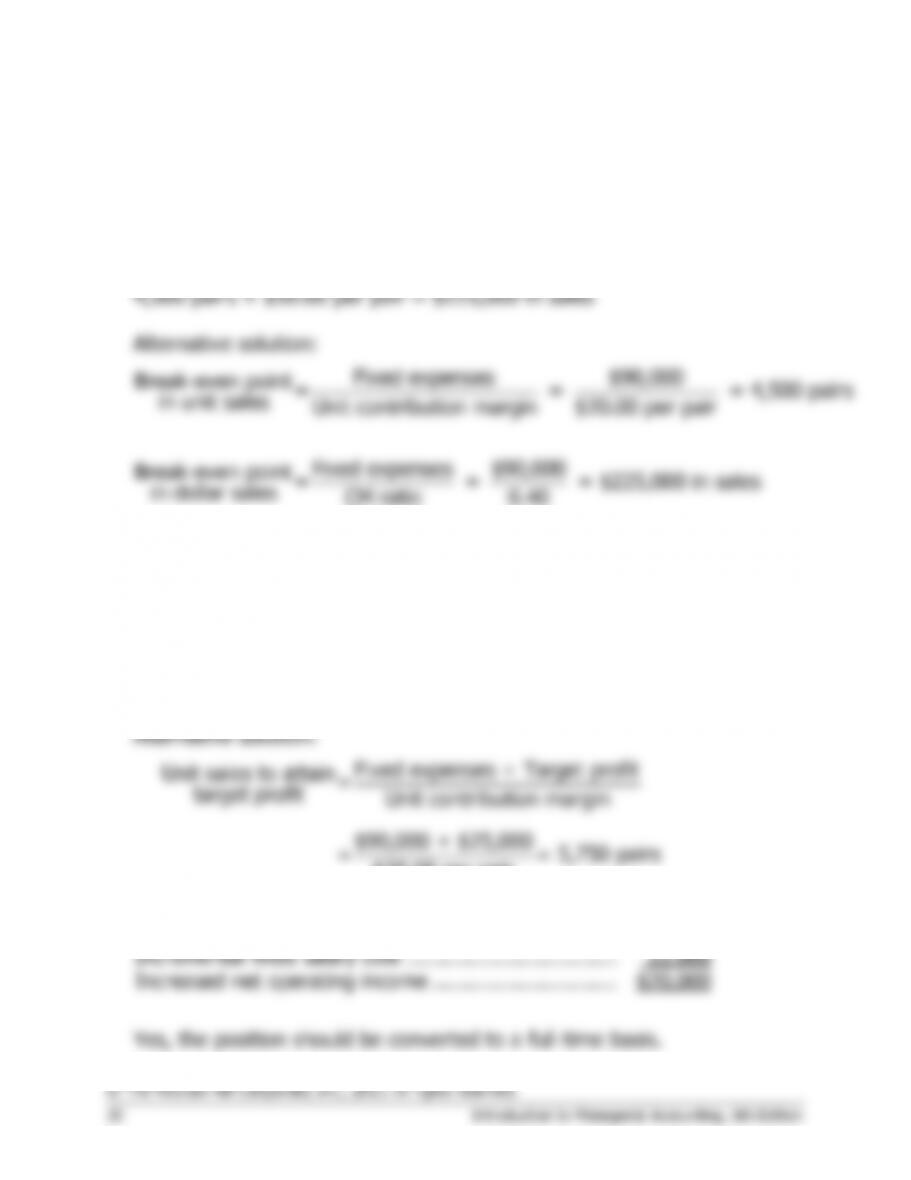
1.
Sales =
Variable expenses + Fixed expenses + Profits
$50.00Q =
$30.00Q + $90,000 + $0
$20.00Q =
$90,000
Q =
$90,000 ÷ $20.00 per pair
Q =
4,500 pairs
in dollar sales CM ratio 0.40
2. See the graph on the following page.
3.
Sales =
Variable expenses + Fixed expenses + Profits
$50.00Q =
$30.00Q + $90,000 + $25,000
$20.00Q =
$115,000
Q =
$115,000 ÷ $20.00 per pair
Q =
5,750 pairs
Incremental fixed salary cost ……………………………………
Increased net operating income …………………………..
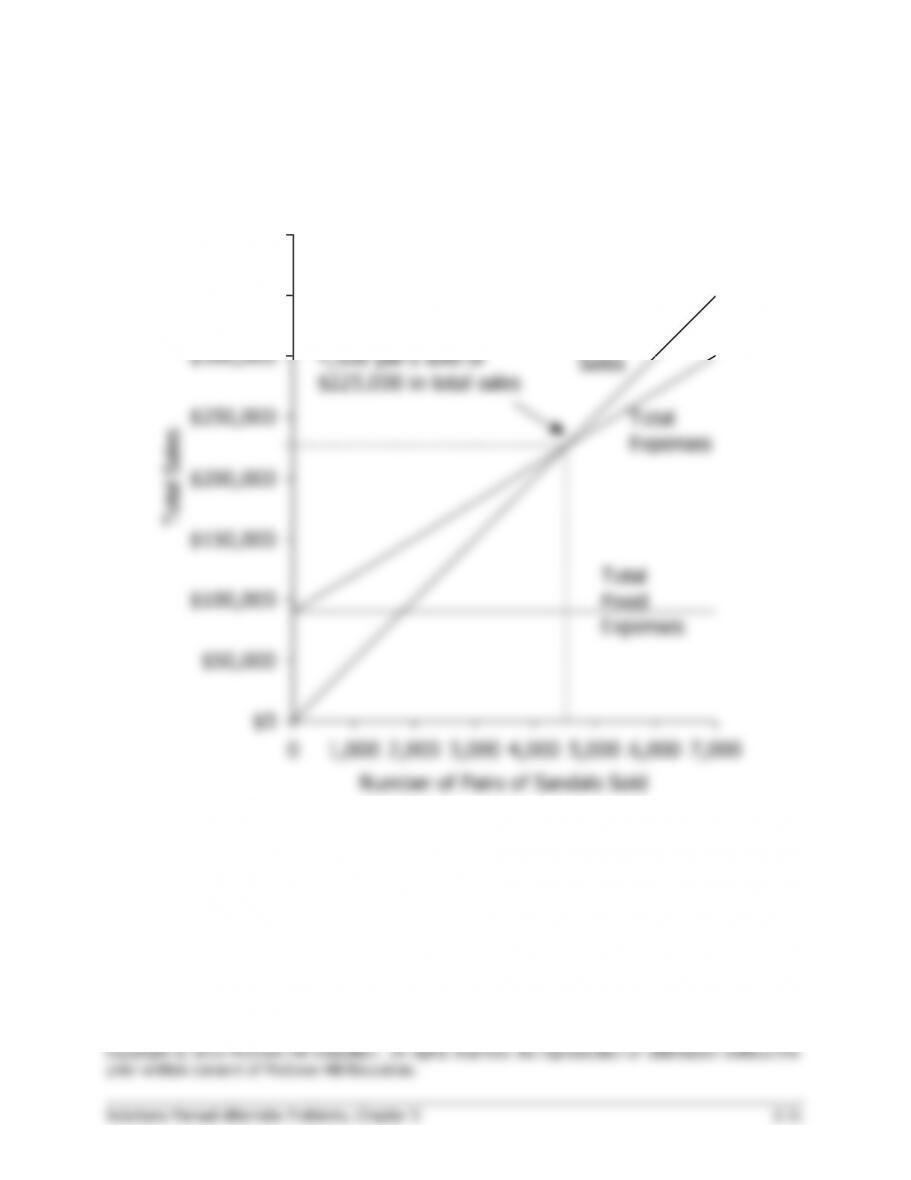
Problem 5-28B (continued)
2. Cost-volume-profit graph:
$0
$50,000
$100,000
$150,000
$200,000
$250,000
$300,000
$350,000
$400,000
0 1,000 2,000 3,000 4,000 5,000 6,000 7,000
Number of Pairs of Sandals Sold
Total Sales
Break-Even Point:
4,500 pairs sold or
$225,000 in total sales
Total
Sales
Total
Expenses
Total
Fixed
Expenses