Problem 13-13B (60 minutes)
This Year
Last Year
1.
a.
Current assets (a) …………………………….
$1,493,000
$1,055,000
Current liabilities (b) ………………………….
803,000
442,000
Working capital (a) − (b) ……………………
$ 690,000
$ 613,000
b.
Current assets (a) …………………………….
$1,493,000
$1,055,000
Current liabilities (b) ………………………….
$803,000
442,000
Current ratio (a) ÷ (b) ……………………….
1.86
2.39
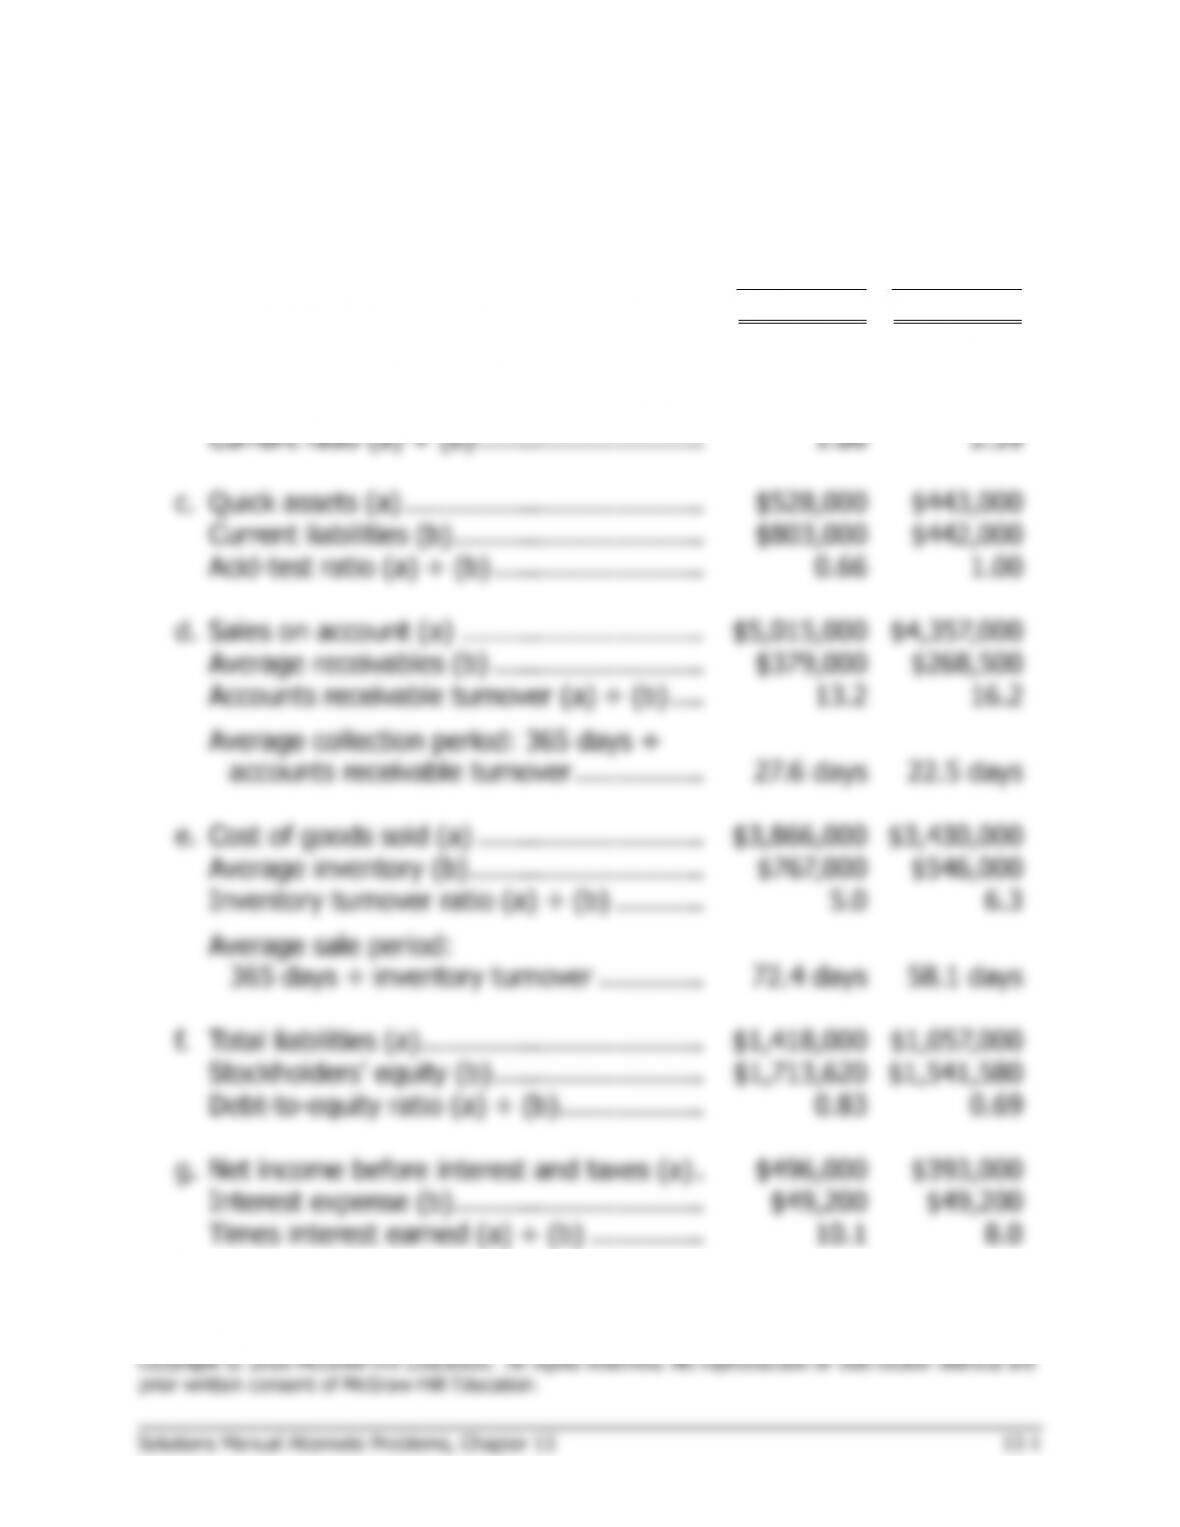
c.
Quick assets (a) ……………………………….
$528,000
$443,000
Current liabilities (b) ………………………….
$803,000
$442,000
Acid-test ratio (a) ÷ (b) ……………………..
0.66
1.00
d.
Sales on account (a) …………………………
$5,015,000
$4,357,000
Average receivables (b) ……………………..
$379,000
$268,500
Accounts receivable turnover (a) ÷ (b) ….
13.2
16.2
Average collection period: 365 days ÷
accounts receivable turnover …………….
27.6 days
22.5 days
e.
Cost of goods sold (a) ……………………….
$3,866,000
$3,430,000
Average inventory (b) ………………………..
$767,000
$546,000
Inventory turnover ratio (a) ÷ (b) ………..
5.0
6.3
Average sale period:
365 days ÷ inventory turnover ………….
72.4 days
58.1 days
f.
Total liabilities (a) ……………………………..
$1,418,000
$1,057,000
Stockholders’ equity (b) ……………………..
$1,713,620
$1,541,580
Debt–to-equity ratio (a) ÷ (b) ………………
0.83
0.69
g.
Net income before interest and taxes (a) .
$496,000
$393,000
Interest expense (b) ………………………….
$49,200
$49,200
Times interest earned (a) ÷ (b) …………..
10.1
8.0
Problem 13-13B (continued)
2.
a.
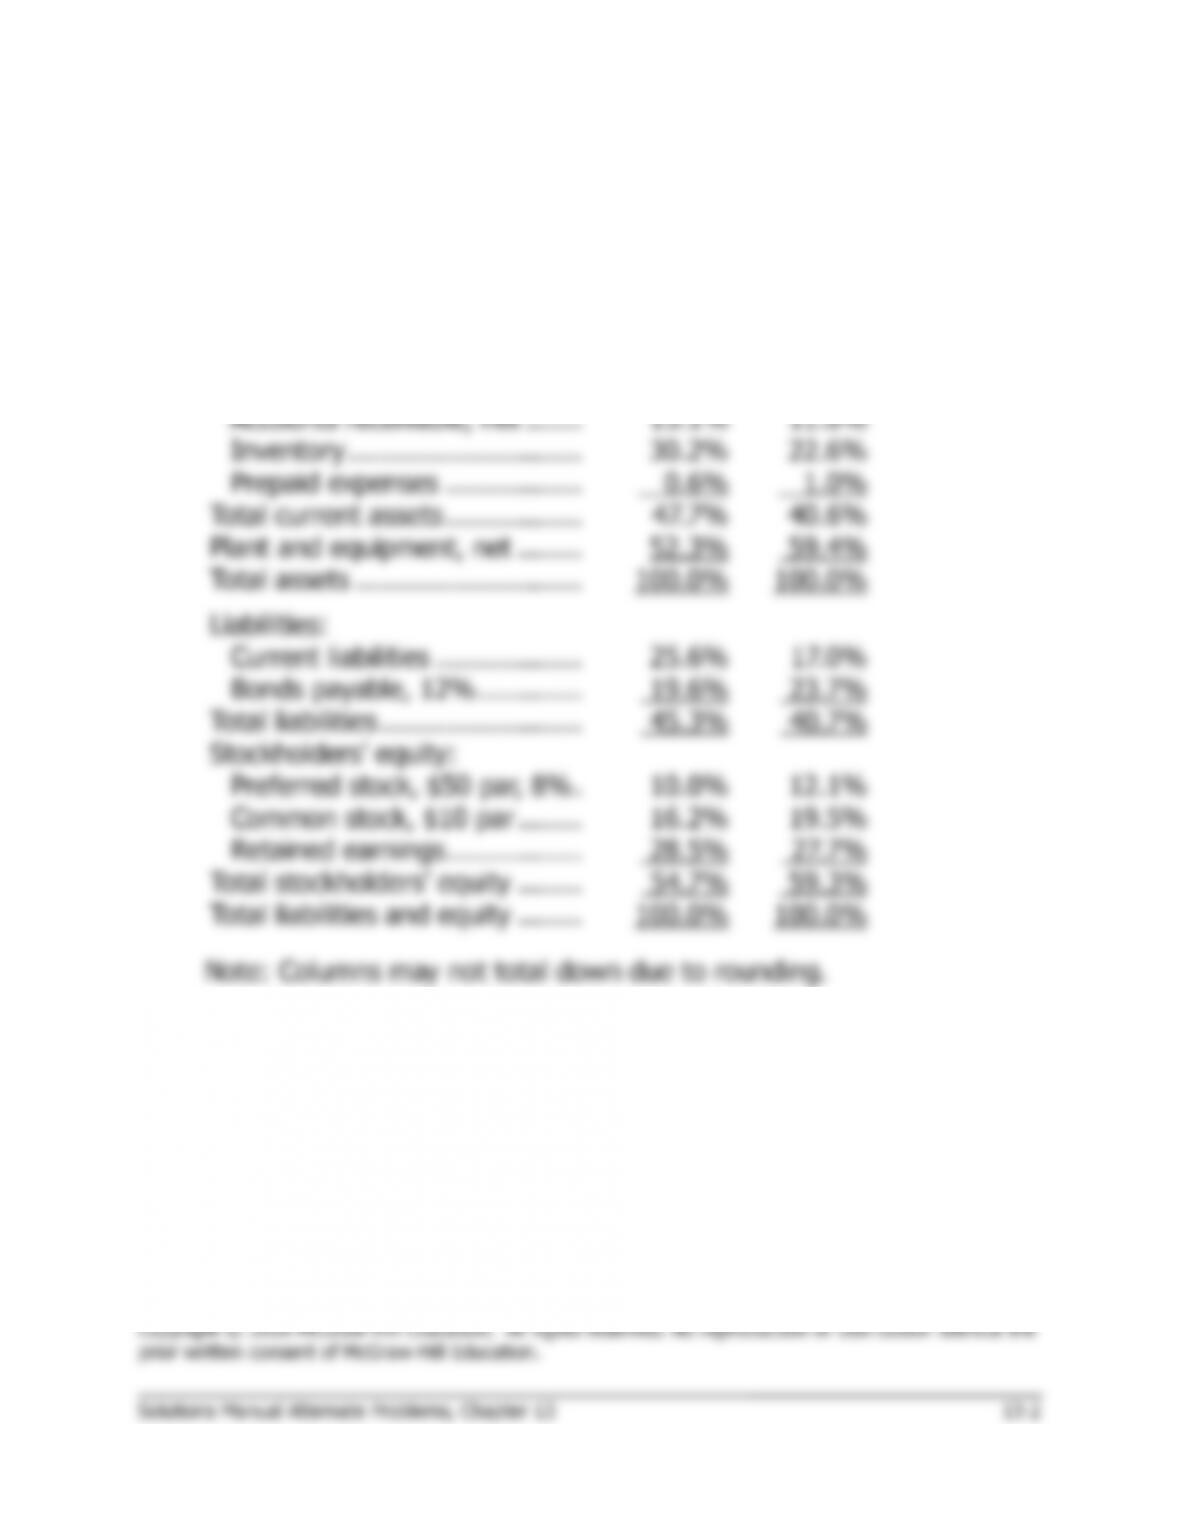
Crowley Building Supply
Common-Size Balance Sheets
This Year
Last Year
Current assets:
Cash ………………………………
1.8%
5.4%
Marketable securities …………
0.0%
0.7%
Accounts receivable, net …….
15.1%
11.0%
Inventory ………………………..
30.2%
22.6%
Prepaid expenses ……………..
0.6%
1.0%
Total current assets ……………..
47.7%
40.6%
Plant and equipment, net ……..
52.3%
59.4%
Total assets ……………………….
100.0%
100.0%
Liabilities:
Current liabilities ………………
25.6%
17.0%
Bonds payable, 12% ………….
19.6%
23.7%
Total liabilities …………………….
45.3%
40.7%
Stockholders’ equity:
Preferred stock, $50 par, 8% .
10.0%
12.1%
Common stock, $10 par ……..
16.2%
19.5%
Retained earnings ……………..
28.5%
27.7%
Total stockholders’ equity ……..
54.7%
59.3%
Total liabilities and equity ……..
100.0%
100.0%
Note: Columns may not total down due to rounding.
Problem 13-13B (continued)
b.
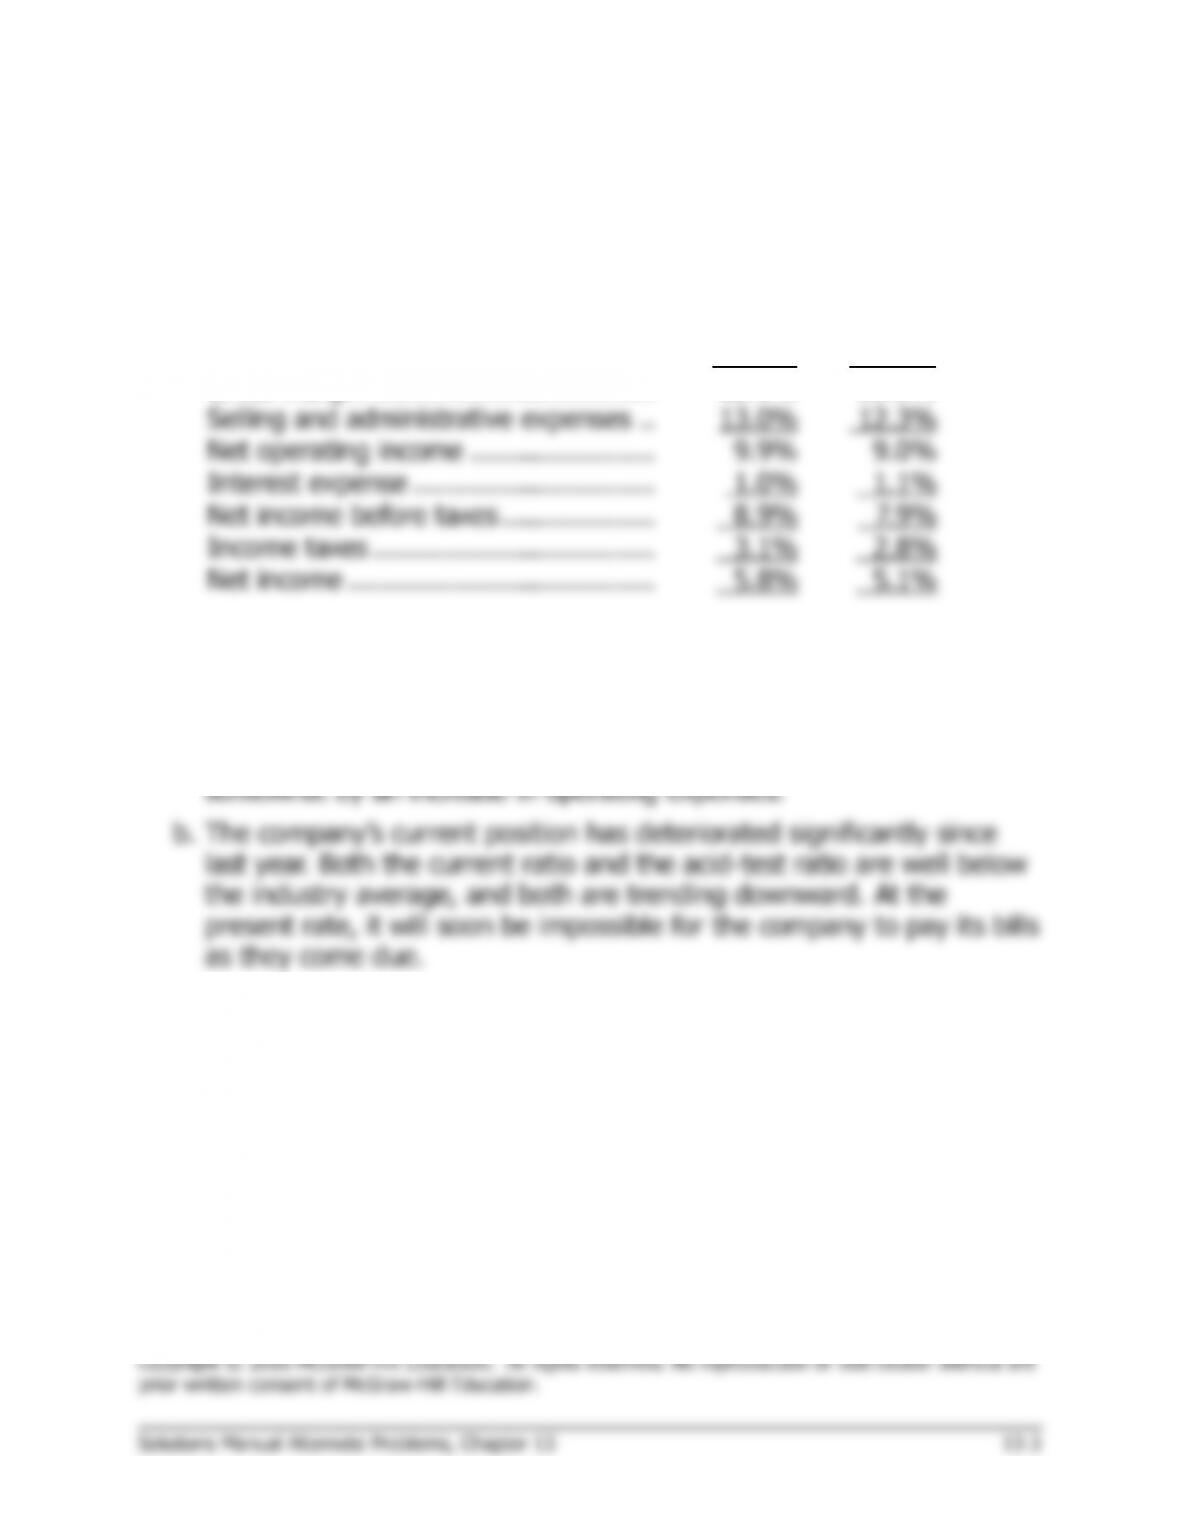
Crowley Building Supply
Common-Size Income Statements
This Year
Last Year
Sales ………………………………………..
100.0%
100.0%
Cost of goods sold ……………………….
77.1%
78.7%
Gross margin …………………………..…
22.9%
21.3%
Selling and administrative expenses ..
13.0%
12.3%
Net operating income …………………..
9.9%
9.0%
Interest expense …………………………
1.0%
1.1%
Net income before taxes ……………….
8.9%
7.9%
Income taxes ……………………………..
3.1%
2.8%
Net income ………………………………..
5.8%
5.1%
3. The following points can be made from the analytical work in parts (1)
and (2) above:
a. The company has improved its profit margin from last year. This is
attributable primarily to an increase in gross margin, which is offset
Problem 13-13B (continued)
c. The drain on the cash account seems to be a result mostly of a large
buildup in accounts receivable and inventory. Notice that the average
collection period has increased by 5.1 days since last year, and that it
is now 9.6 days over the industry average. Many of the company’s
Problem 13-14B (60 minutes)
1.
a.
This Year
Last Year
Net income ……………………………………
$306,040
$222,040
Less preferred dividends …………………..
19,425
19,425
Net income remaining for common (a) …
$286,615
$202,615
Average number of common shares (b) .
50,400
50,400
Earnings per share (a) ÷ (b) ……………..
$5.69
$4.02
b.
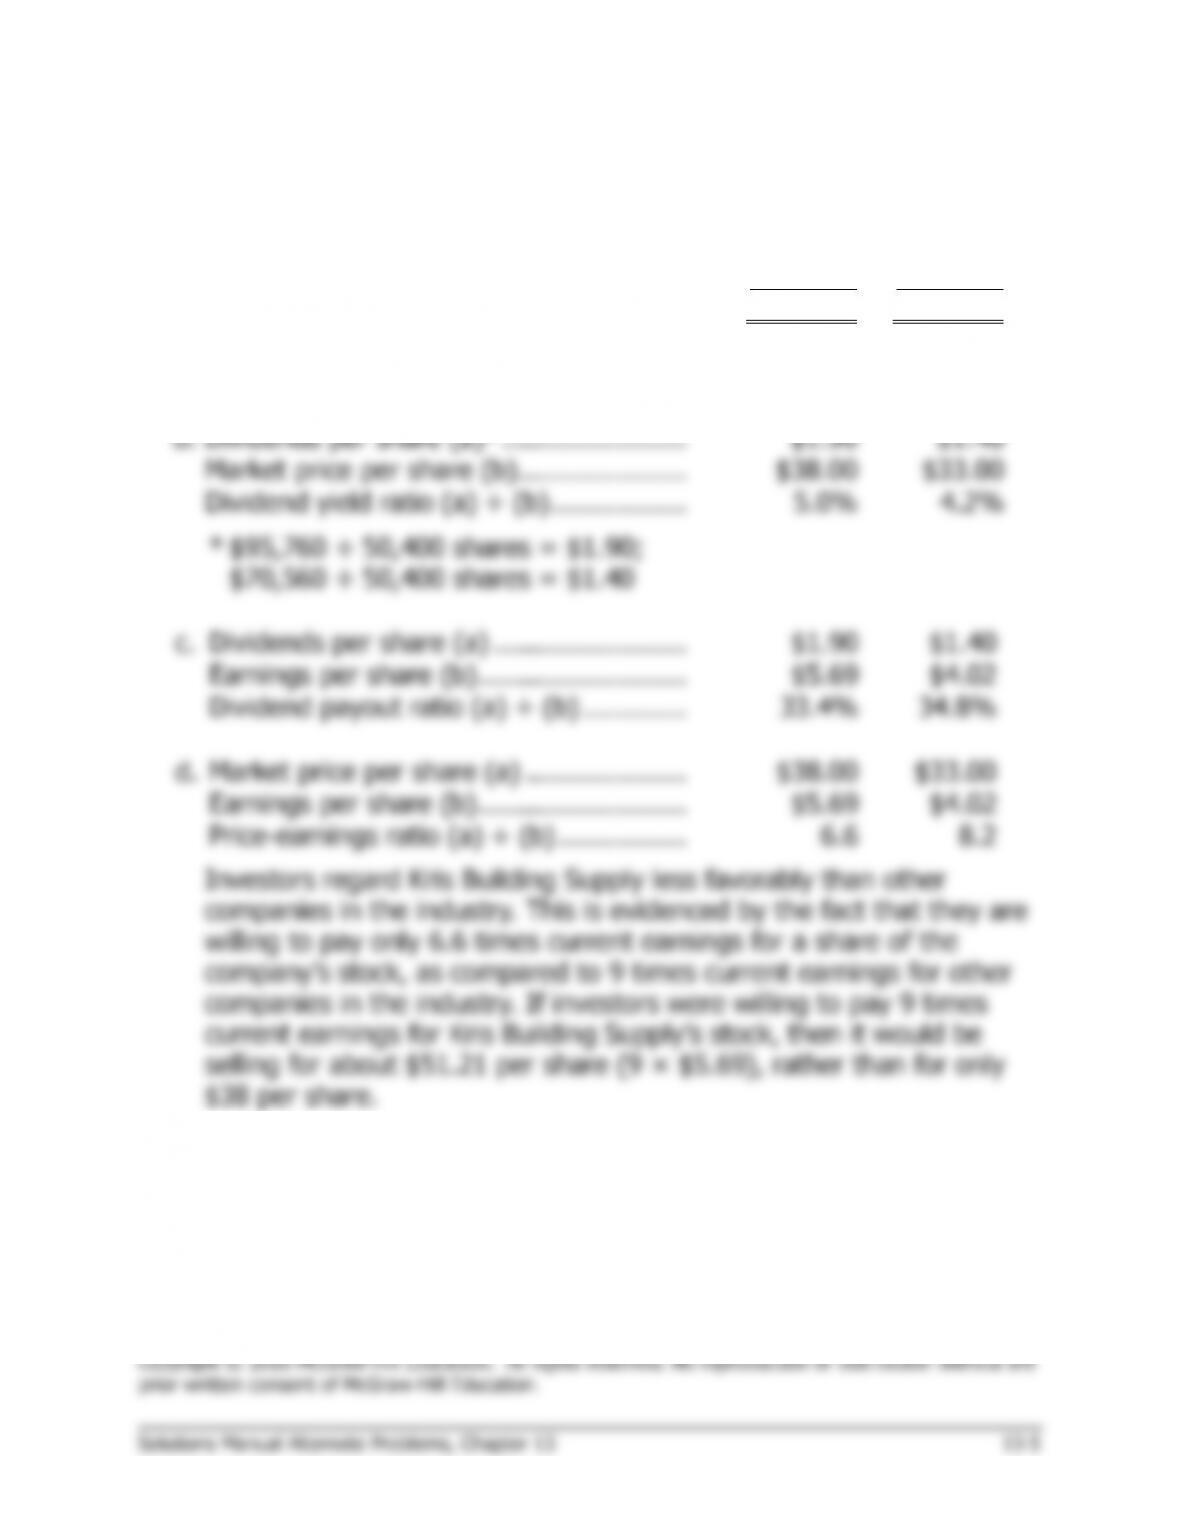
Dividends per share (a)* …………………..
$1.90
$1.40
Market price per share (b) …………………
$38.00
$33.00
Dividend yield ratio (a) ÷ (b) ……………..
5.0%
4.2%
* $95,760 ÷ 50,400 shares = $1.90;
$70,560 ÷ 50,400 shares = $1.40
c.
Dividends per share (a) ……………………
$1.90
$1.40
Earnings per share (b) ……………………..
$5.69
$4.02
Dividend payout ratio (a) ÷ (b) ………….
33.4%
34.8%
d.
Market price per share (a) ………………..
$38.00
$33.00
Earnings per share (b) ……………………..
$5.69
$4.02
Price-earnings ratio (a) ÷ (b) …………….
6.6
8.2
Investors regard Kris Building Supply less favorably than other
companies in the industry. This is evidenced by the fact that they are
willing to pay only 6.6 times current earnings for a share of the
company’s stock, as compared to 9 times current earnings for other
companies in the industry. If investors were willing to pay 9 times
current earnings for Kris Building Supply’s stock, then it would be
selling for about $51.21 per share (9 × $5.69), rather than for only
$38 per share.
Problem 13-14B (continued)
This Year
Last Year
e.
Total stockholders’ equity ……………….
$1,687,410
$1,496,555
Less preferred stock ………………………
277,500
277,500
Common stockholders’ equity (a) ……..
$1,409,910
$1,219,055
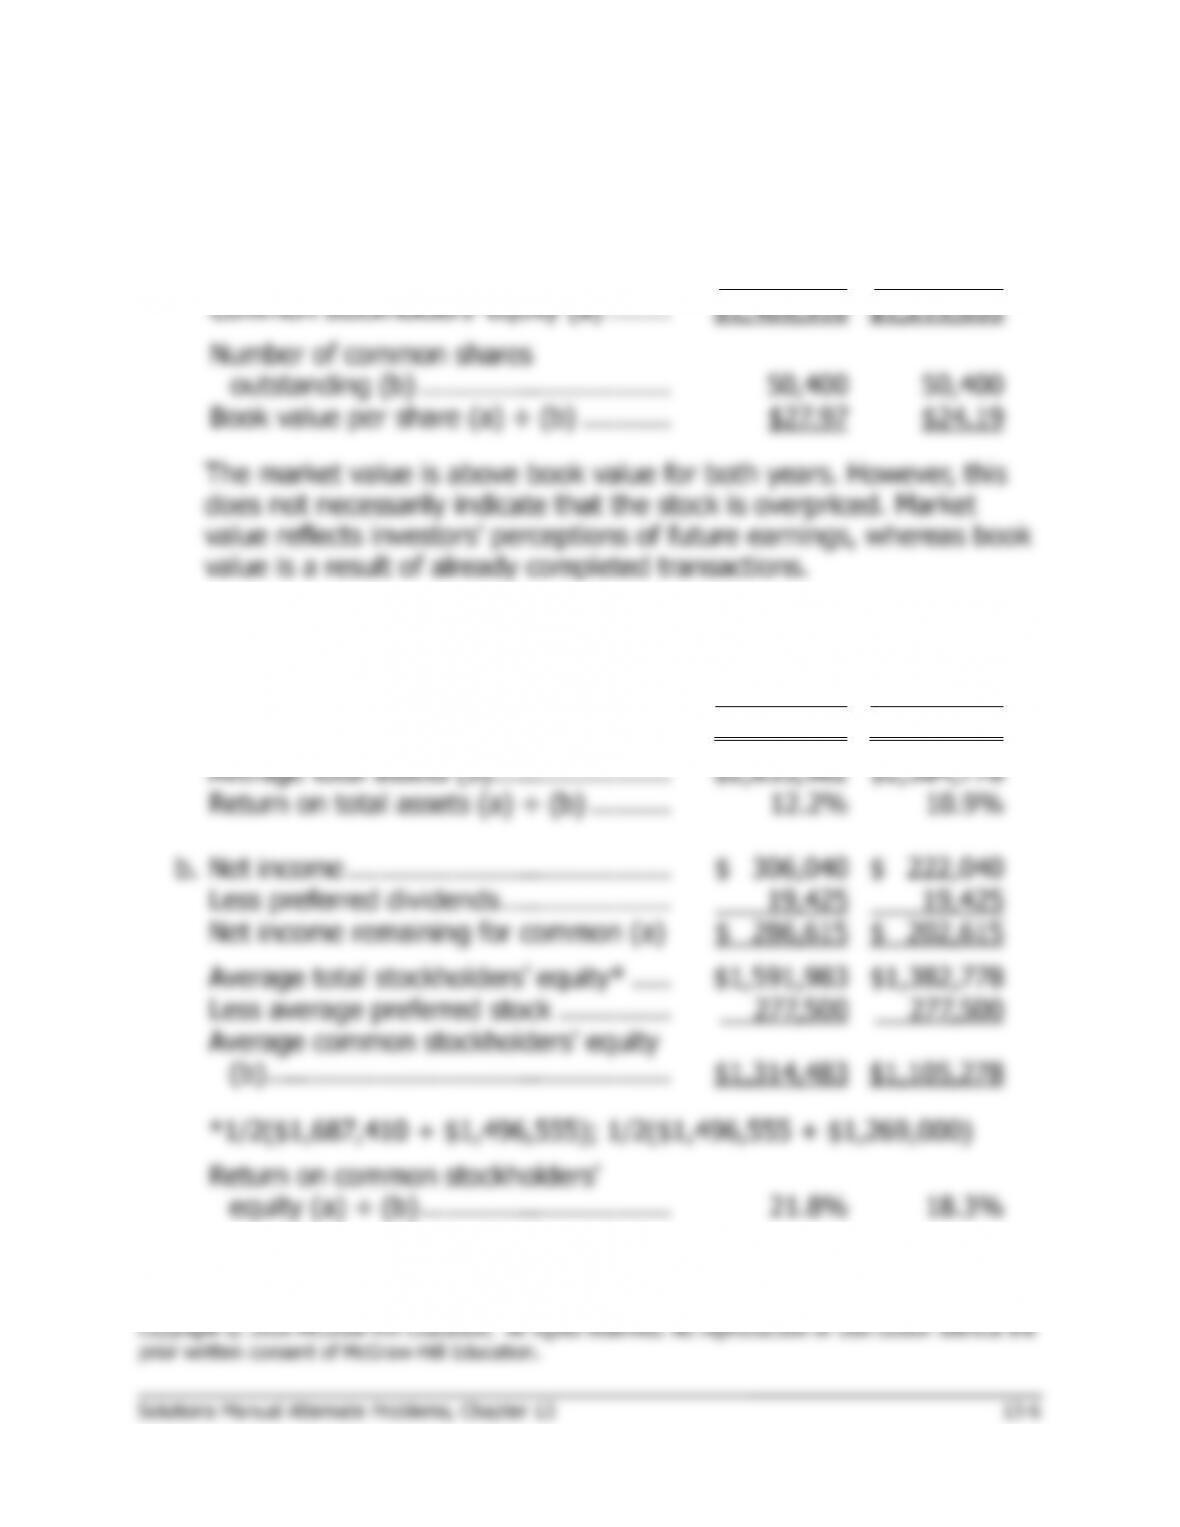
Number of common shares
outstanding (b) ………………………….
50,400
50,400
Book value per share (a) ÷ (b) ………..
$27.97
$24.19
2.
a.
Net income ………………………………….
$ 306,040
$ 222,040
Add after-tax cost of interest paid:
[$55,800 × (1 – 0.30)] ………………..
39,060
39,060
Total (a) ……………………………………..
$ 345,100
$ 261,100
Average total assets (b) ………………….
$2,835,982
$2,384,778
Return on total assets (a) ÷ (b) ……….
12.2%
10.9%
b.
Net income ………………………………….
$ 306,040
$ 222,040
Less preferred dividends …………………
19,425
19,425
Net income remaining for common (a)
$ 286,615
$ 202,615
Average total stockholders’ equity* …..
$1,591,983
$1,382,778
Less average preferred stock …………..
277,500
277,500
Average common stockholders’ equity
(b) …………………………………………..
$1,314,483
$1,105,278
*1/2($1,687,410 + $1,496,555); 1/2($1,496,555 + $1,269,000)
Return on common stockholders’
equity (a) ÷ (b) ………………………….
21.8%
18.3%
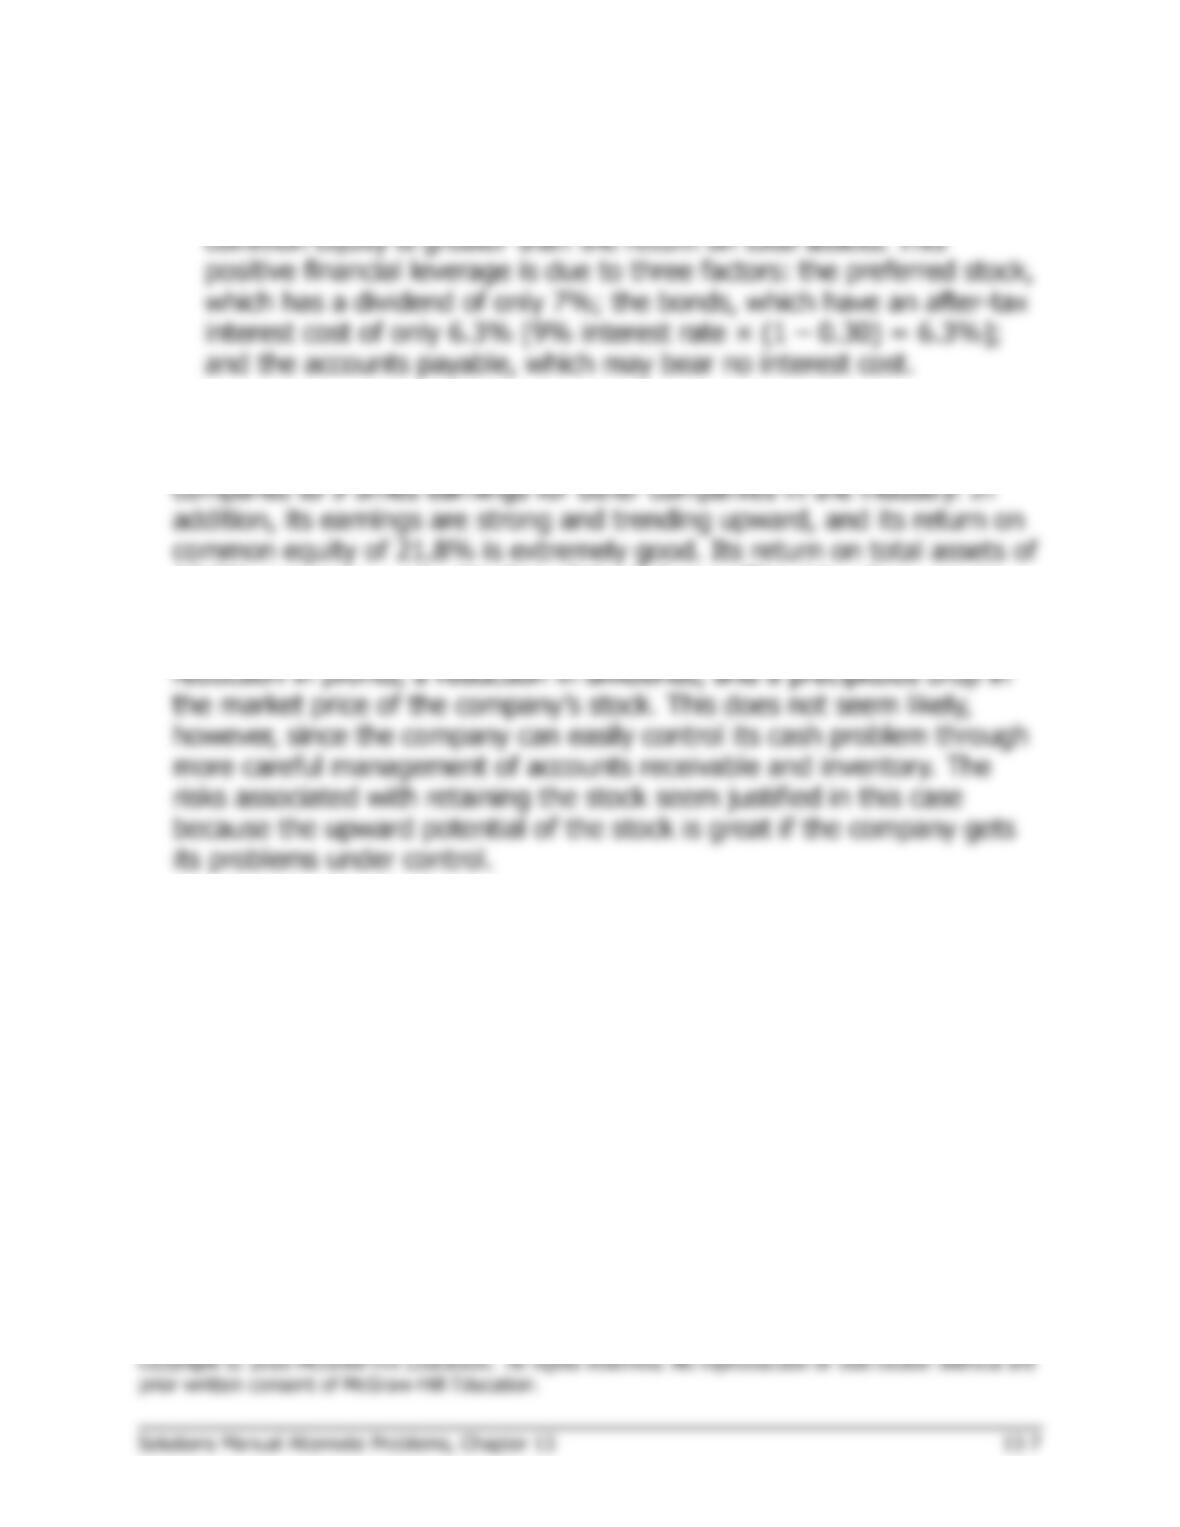
Problem 13-14B (continued)
c. Financial leverage is positive in both years because the return on
3. We would recommend keeping the stock. The stock’s downside risk
seems small because it is selling for only 6.6 times current earnings as
12.2% compares well with that of the industry. The risk, of course, is
whether the company can get its cash problem under control.
Conceivably, the cash problem could worsen, leading to an eventual
Problem 13-15B (30 minutes)
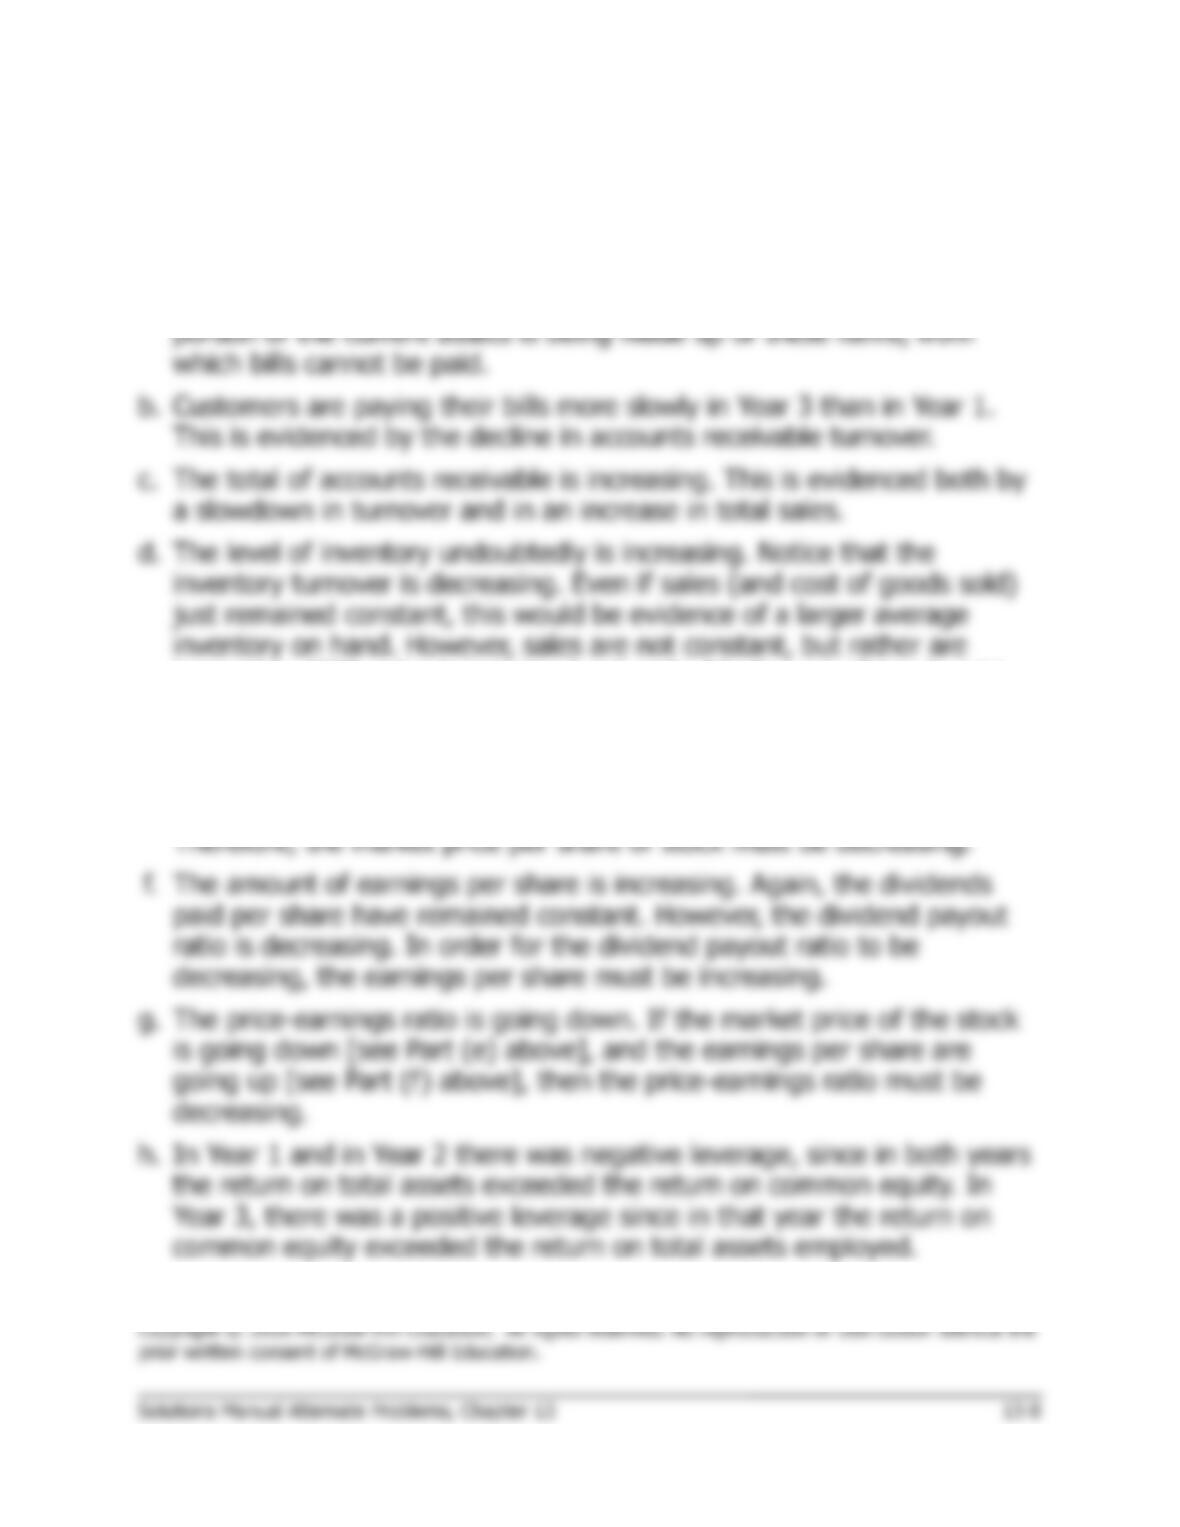
a. It is becoming more difficult for the company to pay its bills as they
come due. Although the current ratio has improved over the three years,
the acid-test ratio is down. Also notice that the accounts receivable and
inventory are both turning more slowly, indicating that an increasing
increasing. With sales increasing (and undoubtedly cost of goods sold
also increasing), the average level of inventory must be increasing as
well to service the larger volume of sales.
e. The market price is going down. The dividends paid per share over the
three-year period are unchanged, but the dividend yield is going up.
Problem 13-16B (30 minutes)
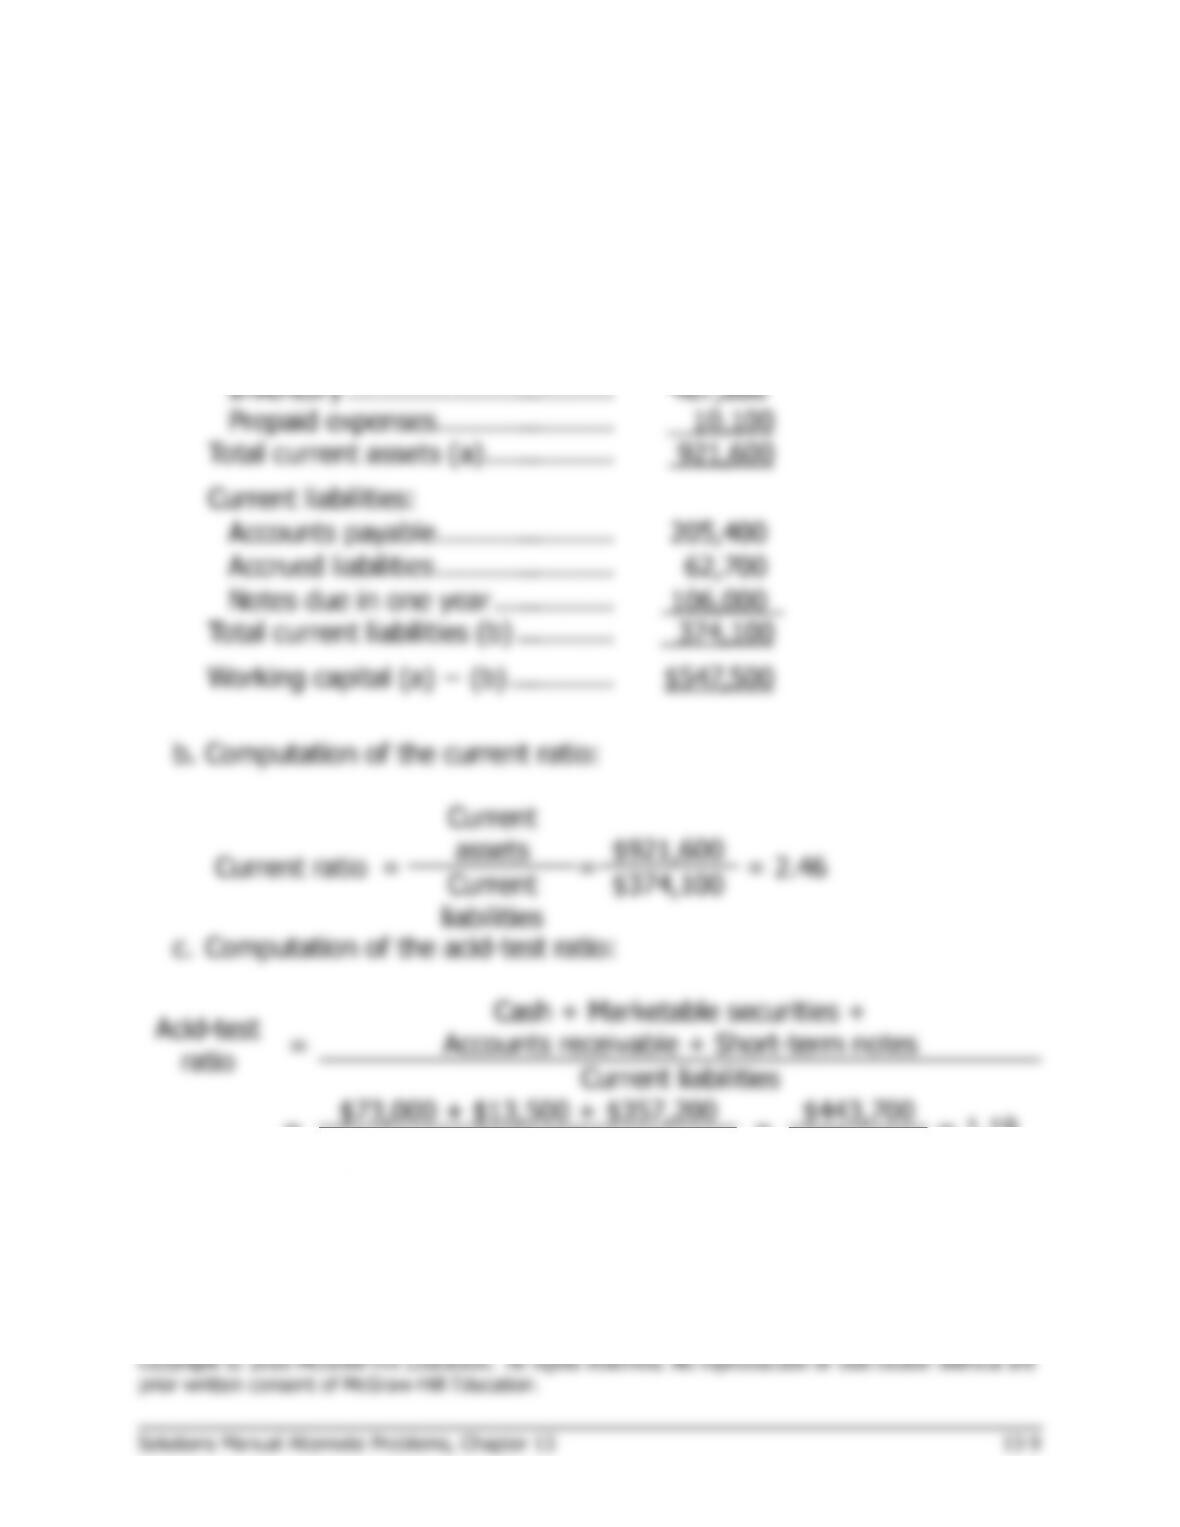
1. a. Computation of working capital:
Current assets:
Cash ………………………………….
$ 73,000
Marketable securities …………….
13,500
Accounts receivable, net…………
357,200
Inventory …………………………...
467,800
Prepaid expenses ………………….
10,100
Total current assets (a) …………….
921,600
Current liabilities:
Accounts payable ………………….
205,400
Accrued liabilities ………………….
62,700
Notes due in one year ……………
106,000
Total current liabilities (b) …………
374,100
Working capital (a) − (b) ………….
$547,500
b. Computation of the current ratio:
Current ratio
=
Current
assets
=
$921,600
= 2.46
Current
liabilities
$374,100
c. Computation of the acid-test ratio:
Acid-test
ratio
=
Cash + Marketable securities +
Accounts receivable + Short-term notes
Current liabilities
=
$73,000 + $13,500 + $357,200
=
$443,700
= 1.19
$374,100
$374,100
Problem 13-16B (continued)
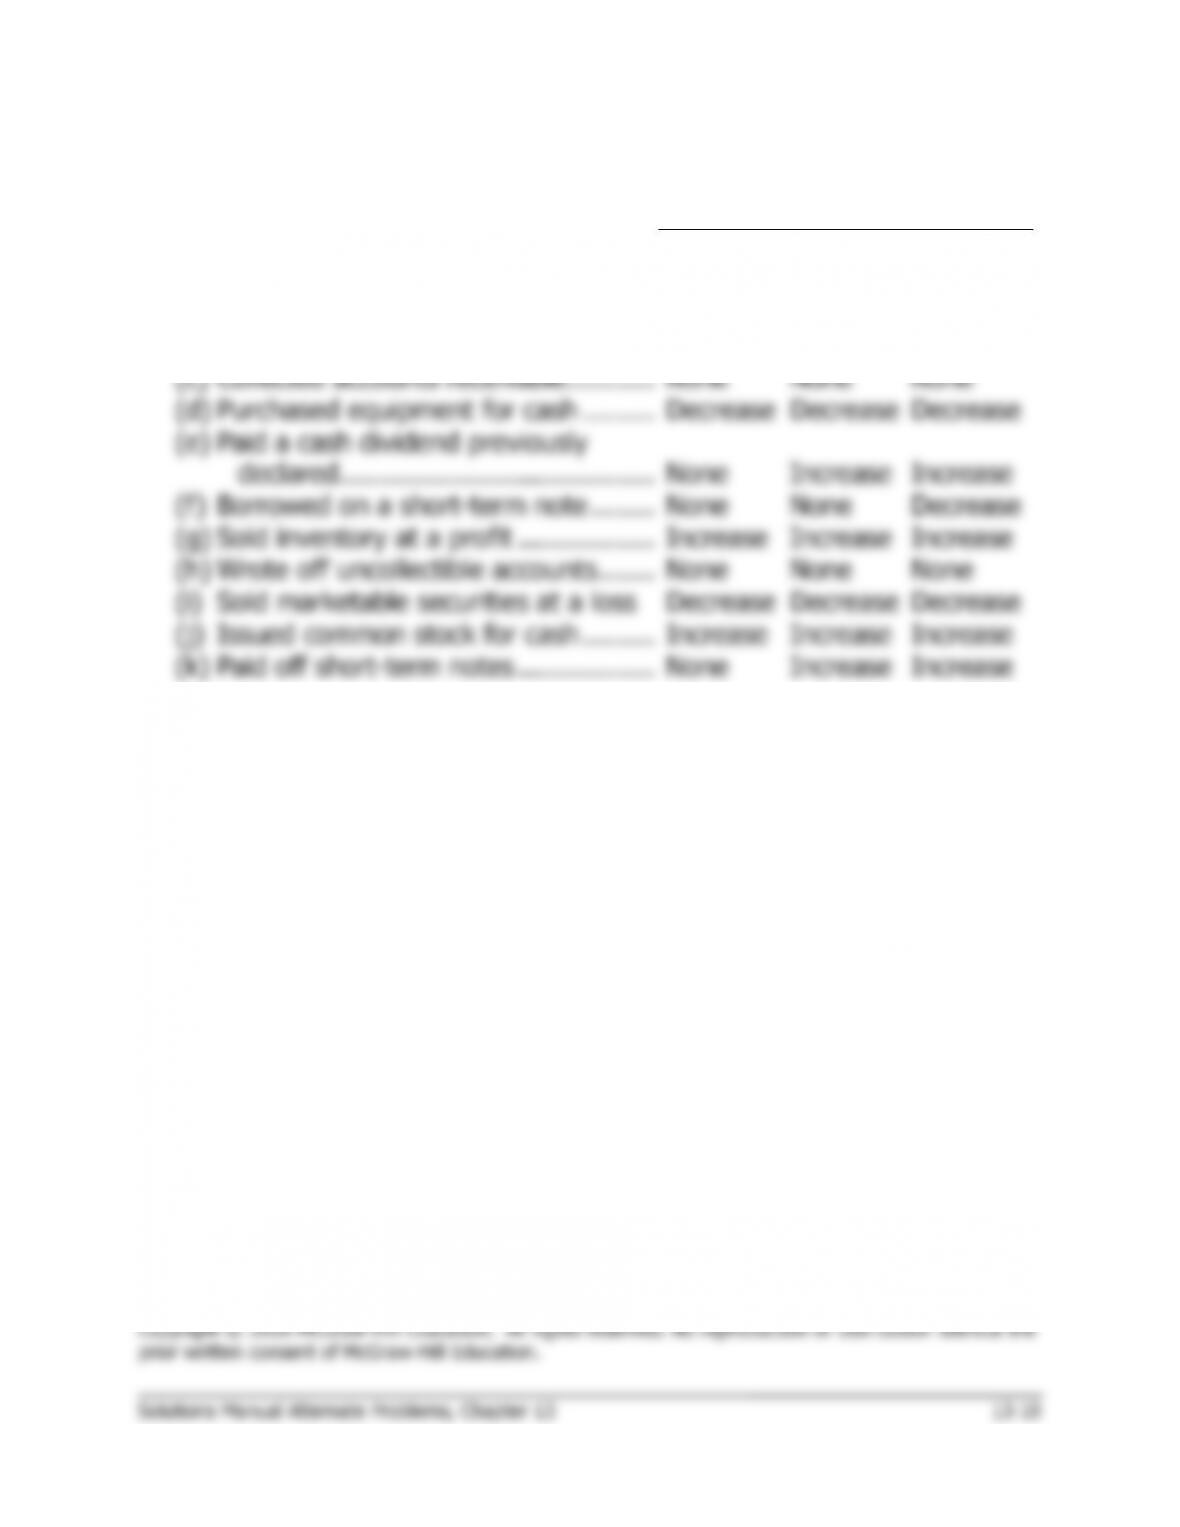
2.
The Effect on
Working
Current
Acid-Test
Transaction
Capital
Ratio
Ratio
(a)
Declared a cash dividend ……………..
Decrease
Decrease
Decrease
(b)
Paid accounts payable …………………
None
Increase
Increase
(c)
Collected accounts receivable ………..
None
None
None
(d)
Purchased equipment for cash ………
Decrease
Decrease
Decrease
(e)
Paid a cash dividend previously
declared …………………………………
None
Increase
Increase
(f)
Borrowed on a short-term note ……..
None
None
Decrease
(g)
Sold inventory at a profit ……………..
Increase
Increase
Increase
(h)
Wrote off uncollectible accounts …….
None
None
None
(i)
Sold marketable securities at a loss
Decrease
Decrease
Decrease
(j)
Issued common stock for cash ………
Increase
Increase
Increase
(k)
Paid off short-term notes ……………..
None
Increase
Increase
Problem 13-17B (45 minutes)
Effect on
Ratio
Reason for Increase, Decrease, or No Effect
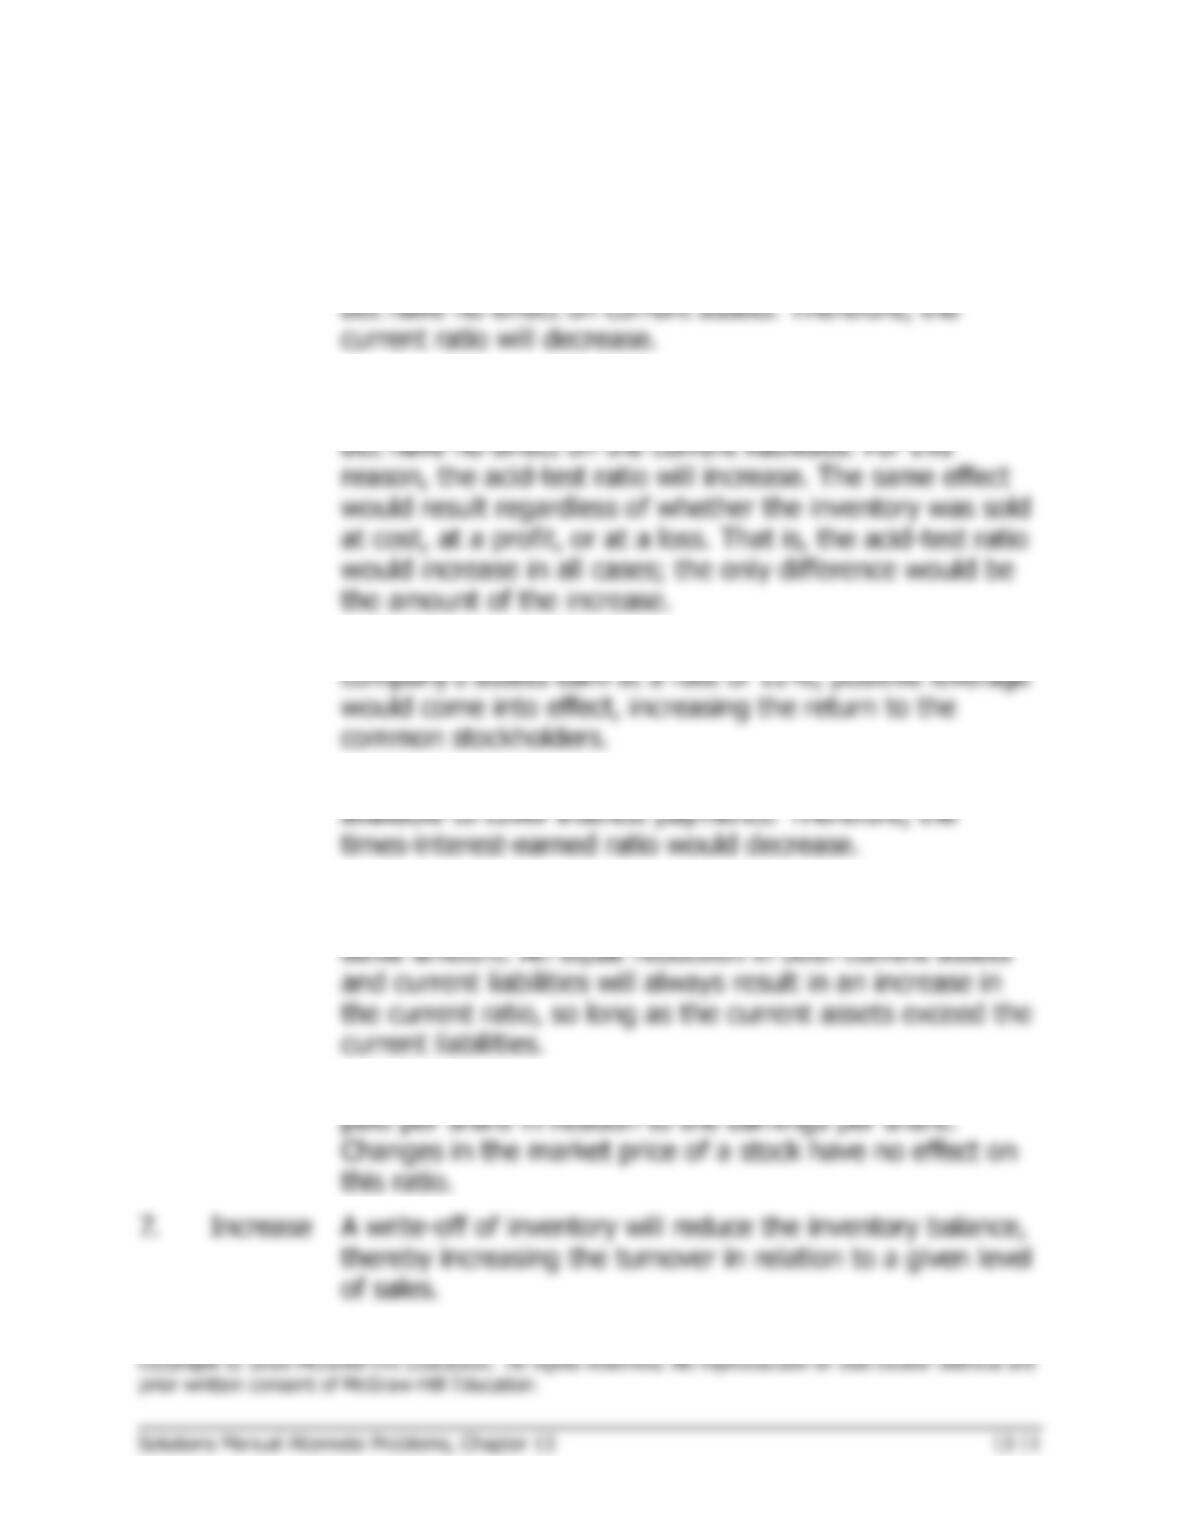
1.
Decrease
Declaring a cash dividend will increase current liabilities,
but have no effect on current assets. Therefore, the
current ratio will decrease.
2.
Increase
A sale of inventory on account will increase the quick
assets (cash, accounts receivable, marketable securities)
but have no effect on the current liabilities. For this
reason, the acid-test ratio will increase. The same effect
would result regardless of whether the inventory was sold
at cost, at a profit, or at a loss. That is, the acid-test ratio
would increase in all cases; the only difference would be
the amount of the increase.
3.
Increase
The interest rate on the bonds is only 9%. Since the
company’s assets earn at a rate of 12%, positive leverage
would come into effect, increasing the return to the
common stockholders.
4.
Decrease
A decrease in net income would mean less income
available to cover interest payments. Therefore, the
times-interest-earned ratio would decrease.
5.
Increase
Payment of a previously declared cash dividend will
reduce both current assets and current liabilities by the
same amount. An equal reduction in both current assets
and current liabilities will always result in an increase in
the current ratio, so long as the current assets exceed the
current liabilities.
6.
No Effect
The dividend payout ratio is a function of the dividends
paid per share in relation to the earnings per share.
Changes in the market price of a stock have no effect on
this ratio.
7.
Increase
A write-off of inventory will reduce the inventory balance,
thereby increasing the turnover in relation to a given level
of sales.
Problem 13-17B (continued)
Effect on
Ratio
Reason for Increase, Decrease, or No Effect
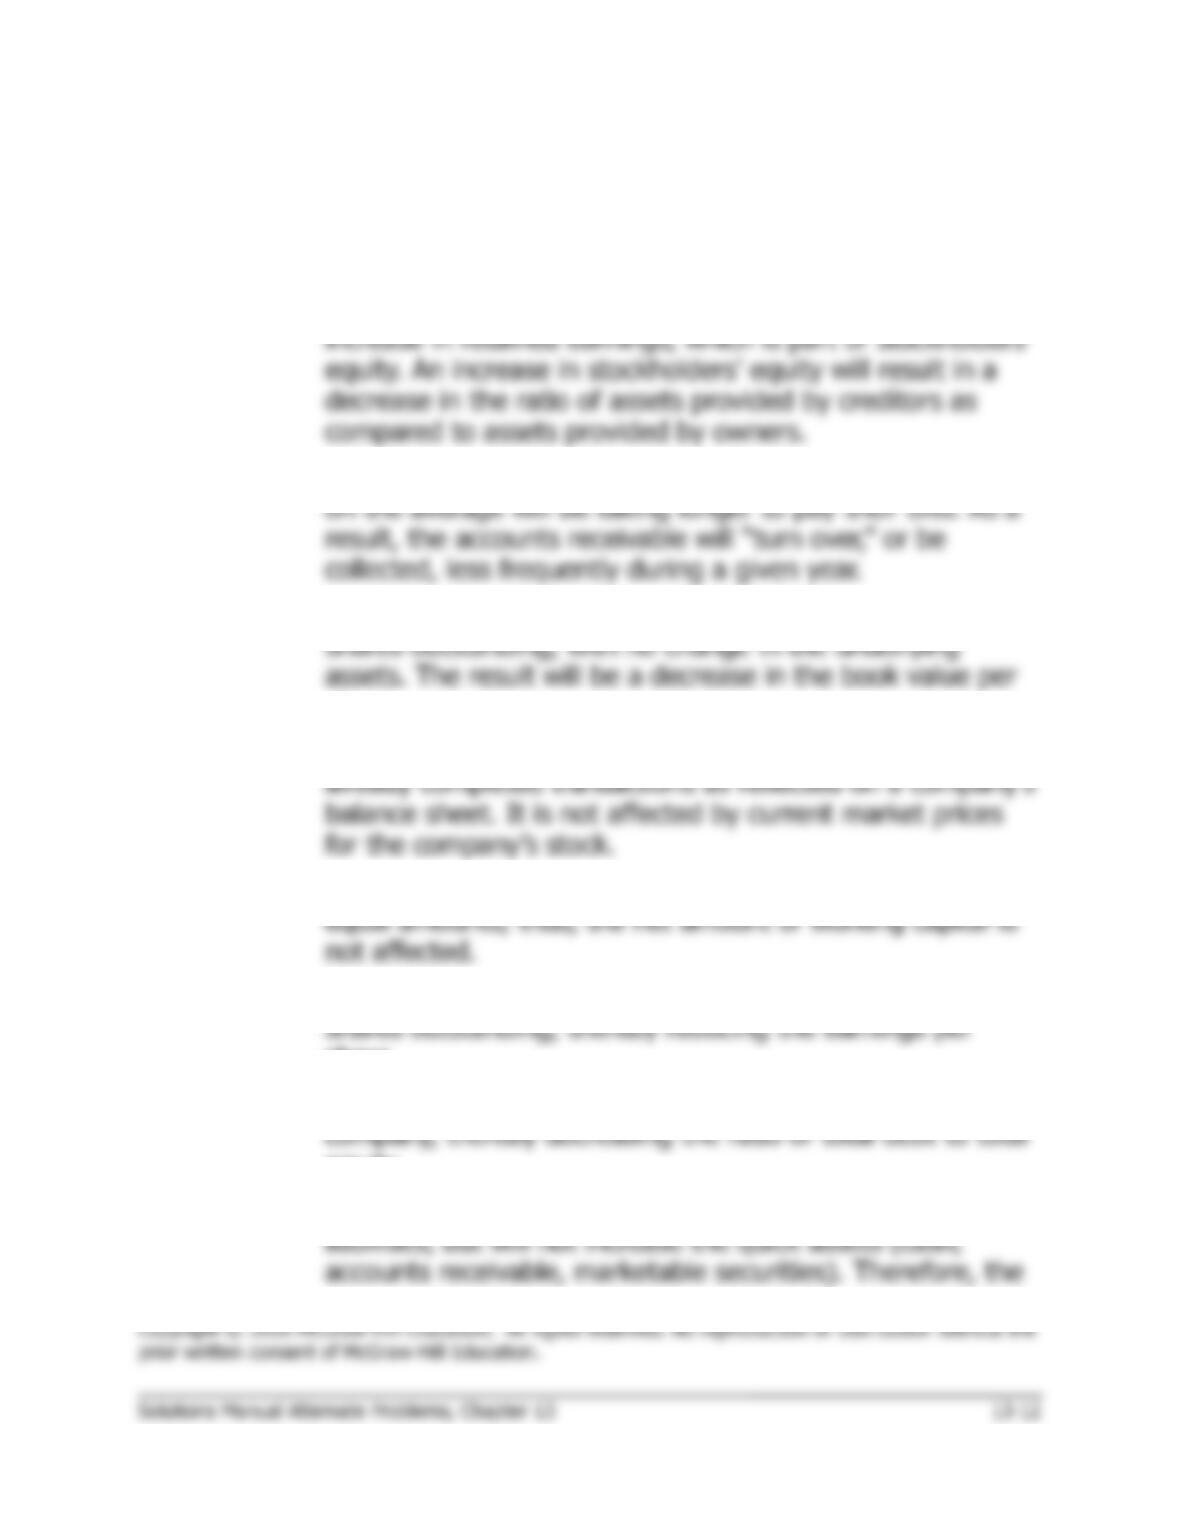
8.
Decrease
Sale of inventory at a profit will increase the assets of a
company. The increase in assets will be reflected in an
increase in retained earnings, which is part of stockholders’
equity. An increase in stockholders’ equity will result in a
decrease in the ratio of assets provided by creditors as
compared to assets provided by owners.
9.
Decrease
Extended credit terms for customers means that customers
on the average will be taking longer to pay their bills. As a
result, the accounts receivable will “turn over,” or be
collected, less frequently during a given year.
10.
Decrease
A common stock dividend will result in a greater number of
shares outstanding, with no change in the underlying
assets. The result will be a decrease in the book value per
share.
11.
No Effect
Book value per share is dependent on historical costs of
already completed transactions as reflected on a company’s
balance sheet. It is not affected by current market prices
for the company’s stock.
12.
No Effect
Payments on account reduce cash and accounts payable by
equal amounts; thus, the net amount of working capital is
not affected.
13.
Decrease
The stock dividend will increase the number of common
shares outstanding, thereby reducing the earnings per
share.
14.
Decrease
Payments to creditors will reduce the total liabilities of a
company, thereby decreasing the ratio of total debt to total
equity.
15.
Decrease
A purchase of inventory on account will increase current
liabilities, but will not increase the quick assets (cash,
accounts receivable, marketable securities). Therefore, the
ratio of quick assets to current liabilities will decrease.
Problem 13-17B (continued)
Effect on
Ratio
Reason for Increase, Decrease, or No Effect
16.
No Effect
Write-off of an uncollectible account against the Allowance
for Bad Debts will have no effect on total current assets.
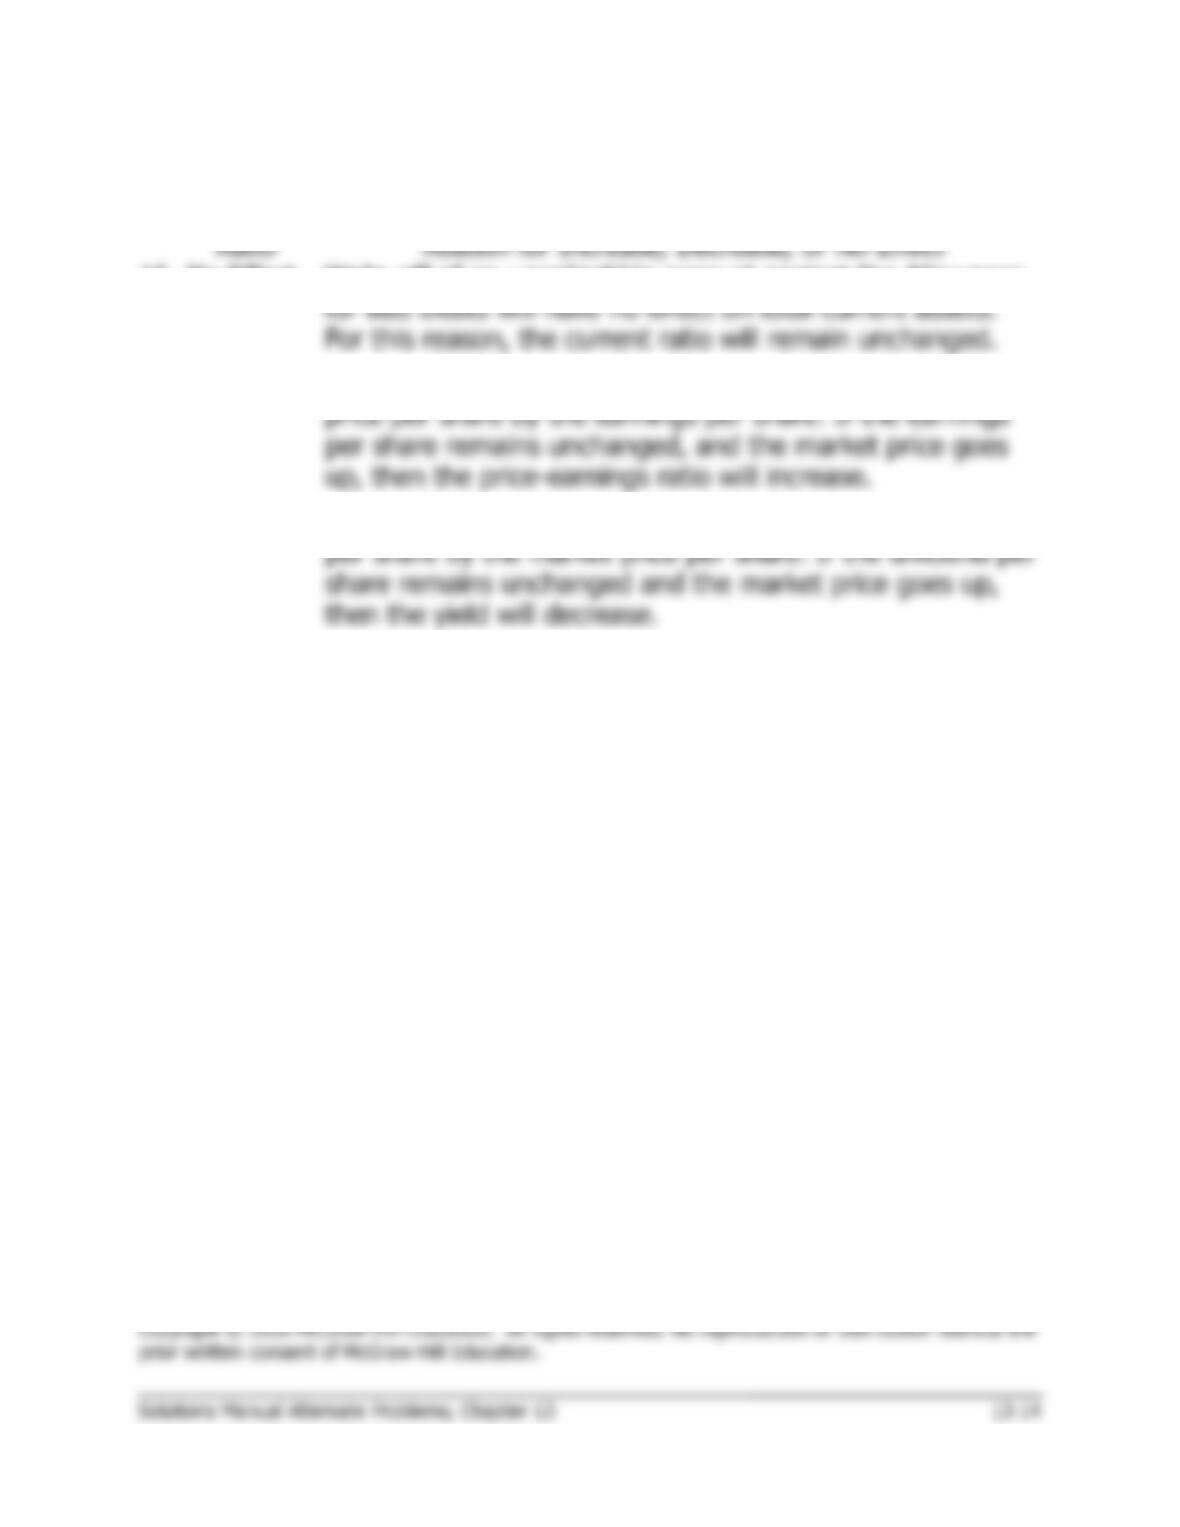
For this reason, the current ratio will remain unchanged.
17.
Increase
The price-earnings ratio is obtained by dividing the market
price per share by the earnings per share. If the earnings
per share remains unchanged, and the market price goes
up, then the price-earnings ratio will increase.
18.
Decrease
The dividend yield ratio is obtained by dividing the dividend
per share by the market price per share. If the dividend per
share remains unchanged and the market price goes up,
then the yield will decrease.
Problem 13-18B (90 minutes)
1.
a.
This Year
Last Year
Net income ……………………………………
$ 470,400
$ 309,400
Add after-tax cost of interest:
$128,000 × (1 – 0.30) …………………..
89,600
$108,000 × (1 – 0.30) …………………..
75,600
Total (a) ……………………………………….
$ 560,000
$ 385,000
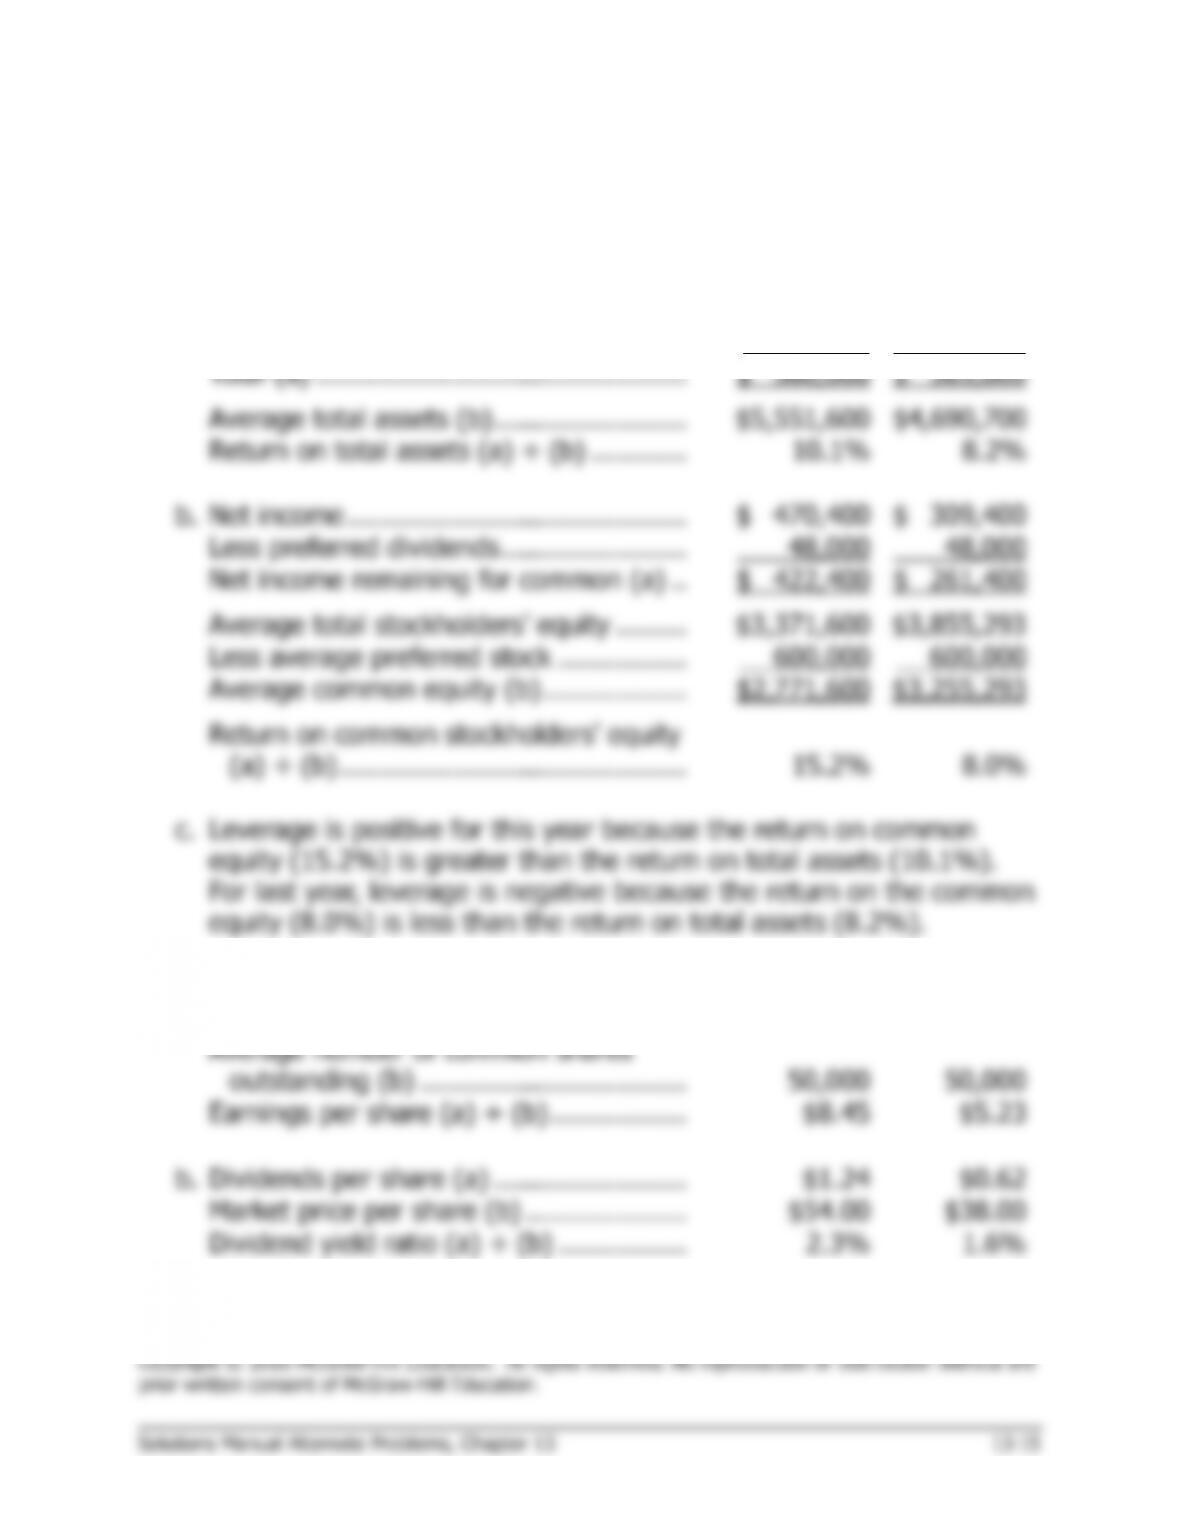
Average total assets (b) ……………………
$5,551,600
$4,690,700
Return on total assets (a) ÷ (b) …………
10.1%
8.2%
b.
Net income ……………………………………
$ 470,400
$ 309,400
Less preferred dividends …………………..
48,000
48,000
Net income remaining for common (a) ..
$ 422,400
$ 261,400
Average total stockholders’ equity ………
$3,371,600
$3,855,293
Less average preferred stock …………….
600,000
600,000
Average common equity (b) ………………
$2,771,600
$3,255,293
Return on common stockholders’ equity
(a) ÷ (b) …………………………………….
15.2%
8.0%
c.
Leverage is positive for this year because the return on common
equity (15.2%) is greater than the return on total assets (10.1%).
For last year, leverage is negative because the return on the common
equity (8.0%) is less than the return on total assets (8.2%).
2.
a.
Net income remaining for common [see
above] (a) …………………………………..
$422,400
$261,400
Average number of common shares
outstanding (b) …………………………...
50,000
50,000
Earnings per share (a) ÷ (b) ……………..
$8.45
$5.23
b.
Dividends per share (a) ……………………
$1.24
$0.62
Market price per share (b) ………………..
$54.00
$38.00
Dividend yield ratio (a) ÷ (b) …………….
2.3%
1.6%
Problem 13-18B (continued)
This Year
Last Year
c.
Dividends per share (a) ……………………
$1.24
$0.62
Earnings per share (b) ……………………..
$8.45
$5.23
Dividend payout ratio (a) ÷ (b) ………….
14.7%
11.9%
d.
Market price per share (a) ………………….
$54.00
$38.00
Earnings per share (b) ……………………….
$8.45
$5.23
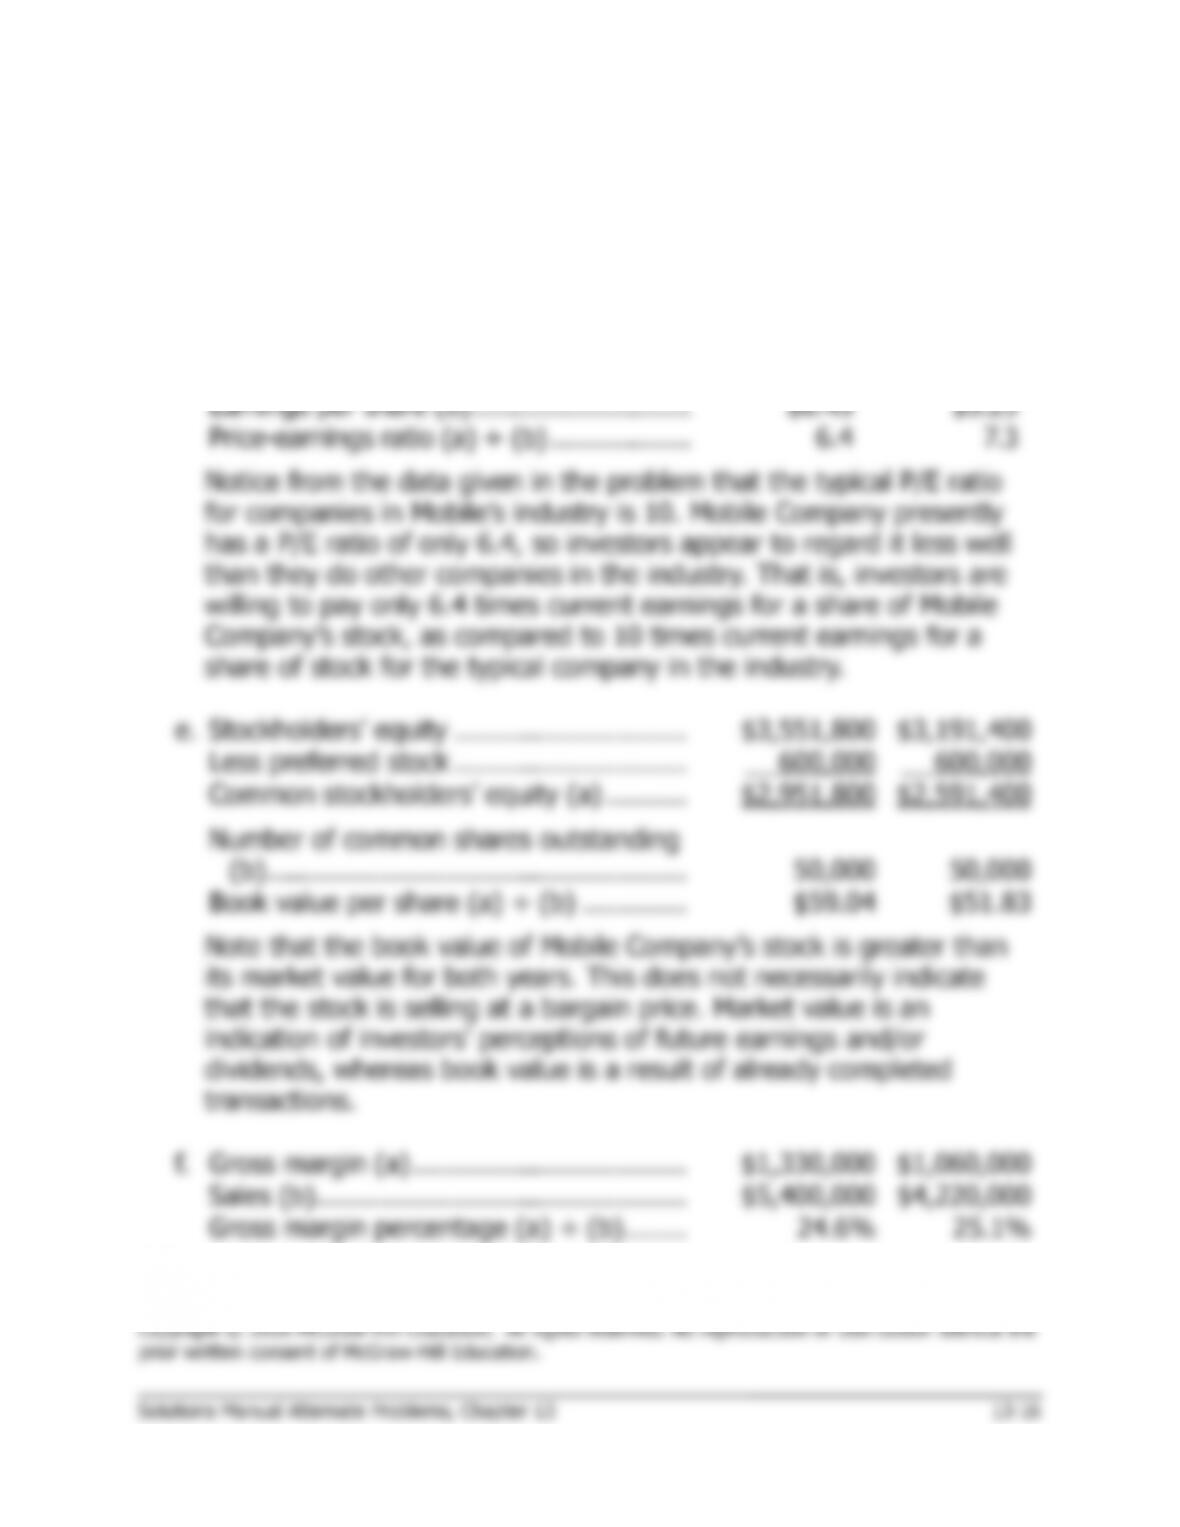
Price-earnings ratio (a) ÷ (b) ………………
6.4
7.3
Notice from the data given in the problem that the typical P/E ratio
for companies in Mobile’s industry is 10. Mobile Company presently
has a P/E ratio of only 6.4, so investors appear to regard it less well
than they do other companies in the industry. That is, investors are
willing to pay only 6.4 times current earnings for a share of Mobile
Company’s stock, as compared to 10 times current earnings for a
share of stock for the typical company in the industry.
e.
Stockholders’ equity ………………………..
$3,551,800
$3,191,400
Less preferred stock ………………………..
600,000
600,000
Common stockholders’ equity (a) ……….
$2,951,800
$2,591,400
Number of common shares outstanding
(b) …………………………………………….
50,000
50,000
Book value per share (a) ÷ (b) ………….
$59.04
$51.83
f.
Gross margin (a) …………………………….
$1,330,000
$1,060,000
Sales (b) ……………………………………….
$5,400,000
$4,220,000
Gross margin percentage (a) ÷ (b) ……..
24.6%
25.1%
Problem 13-18B (continued)
This Year
Last Year
3.
a.
Current assets (a) …………………………….
$2,646,000
$1,930,000
Current liabilities (b) ………………………….
1,250,000
750,000
Working capital (a) − (b) ……………………
$1,396,000
$1,180,000
b.
Current assets (a) …………………………….
$2,646,000
$1,930,000
Current liabilities (b) ………………………….
$1,250,000
$750,000
Current ratio (a) ÷ (b) ……………………….
2.12
2.57
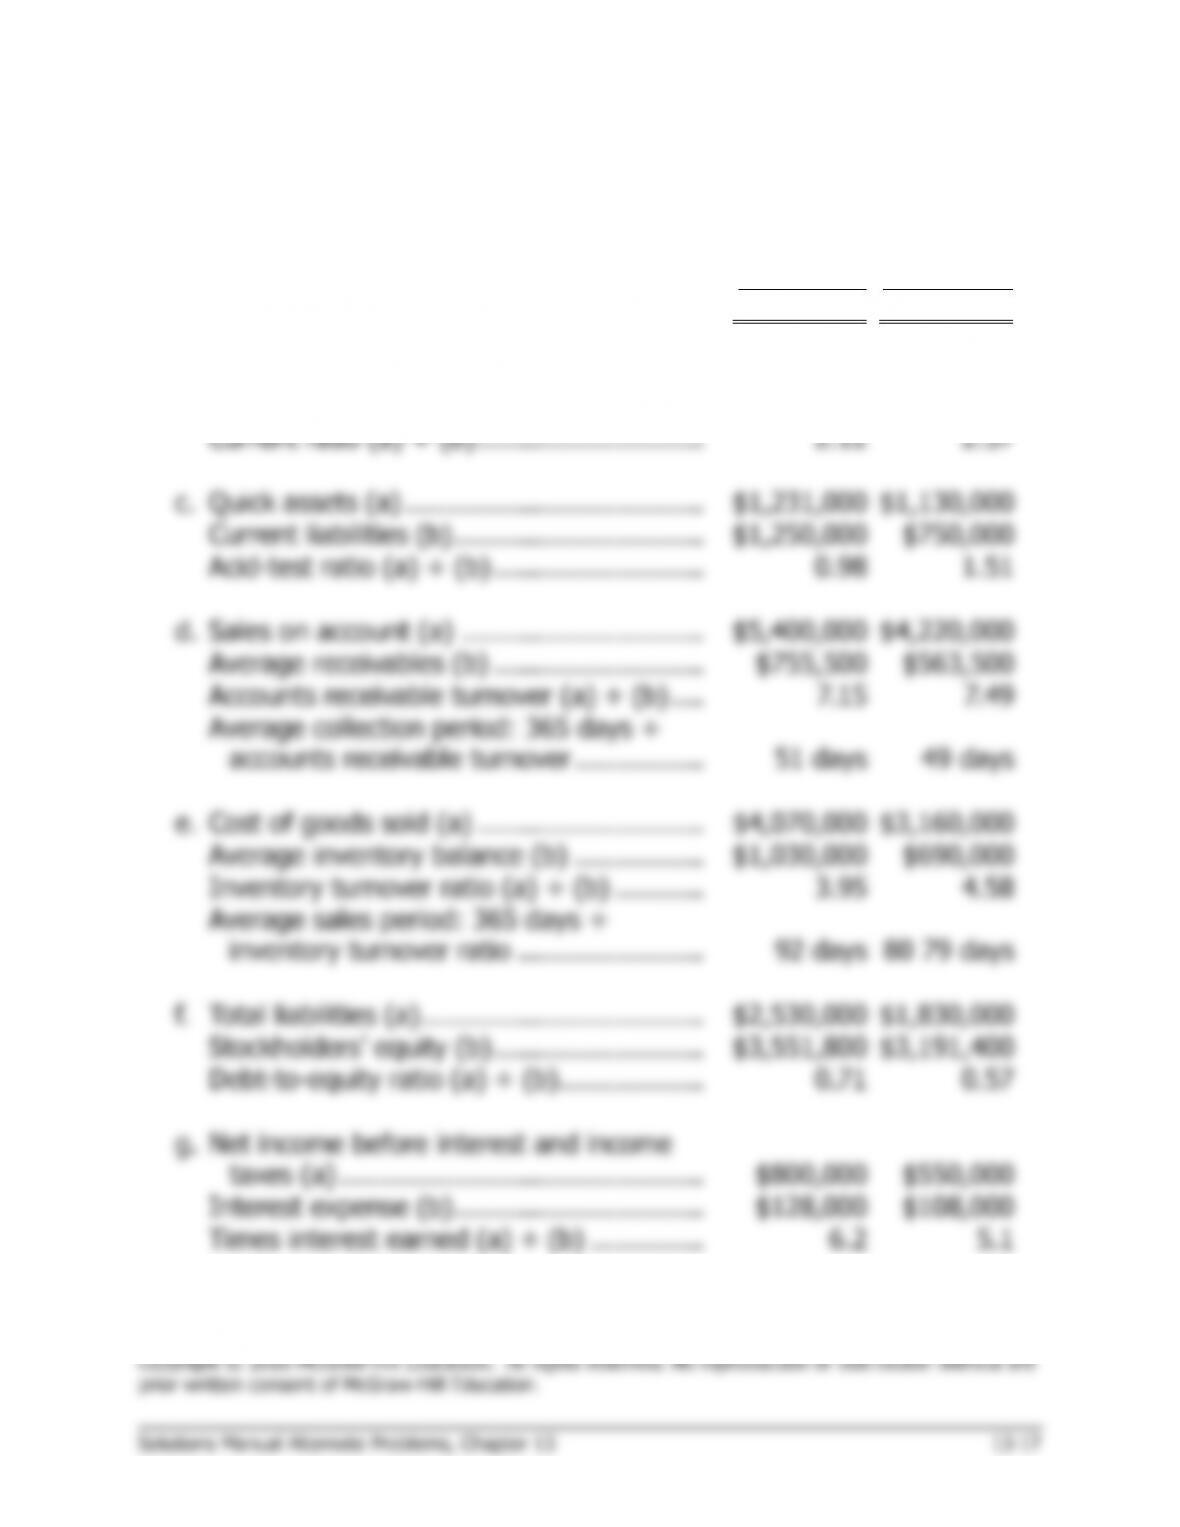
c.
Quick assets (a) ……………………………….
$1,231,000
$1,130,000
Current liabilities (b) ………………………….
$1,250,000
$750,000
Acid-test ratio (a) ÷ (b) ……………………..
0.98
1.51
d.
Sales on account (a) …………………………
$5,400,000
$4,220,000
Average receivables (b) ……………………..
$755,500
$563,500
Accounts receivable turnover (a) ÷ (b) ….
7.15
7.49
Average collection period: 365 days ÷
accounts receivable turnover …………….
51 days
49 days
e.
Cost of goods sold (a) ……………………….
$4,070,000
$3,160,000
Average inventory balance (b) …………….
$1,030,000
$690,000
Inventory turnover ratio (a) ÷ (b) ………..
3.95
4.58
Average sales period: 365 days ÷
inventory turnover ratio …………………..
92 days
80 79 days
f.
Total liabilities (a) ……………………………..
$2,530,000
$1,830,000
Stockholders’ equity (b) ……………………..
$3,551,800
$3,191,400
Debt–to-equity ratio (a) ÷ (b) ………………
0.71
0.57
g.
Net income before interest and income
taxes (a) ………………………………………
$800,000
$550,000
Interest expense (b) ………………………….
$128,000
$108,000
Times interest earned (a) ÷ (b) …………..
6.2
5.1
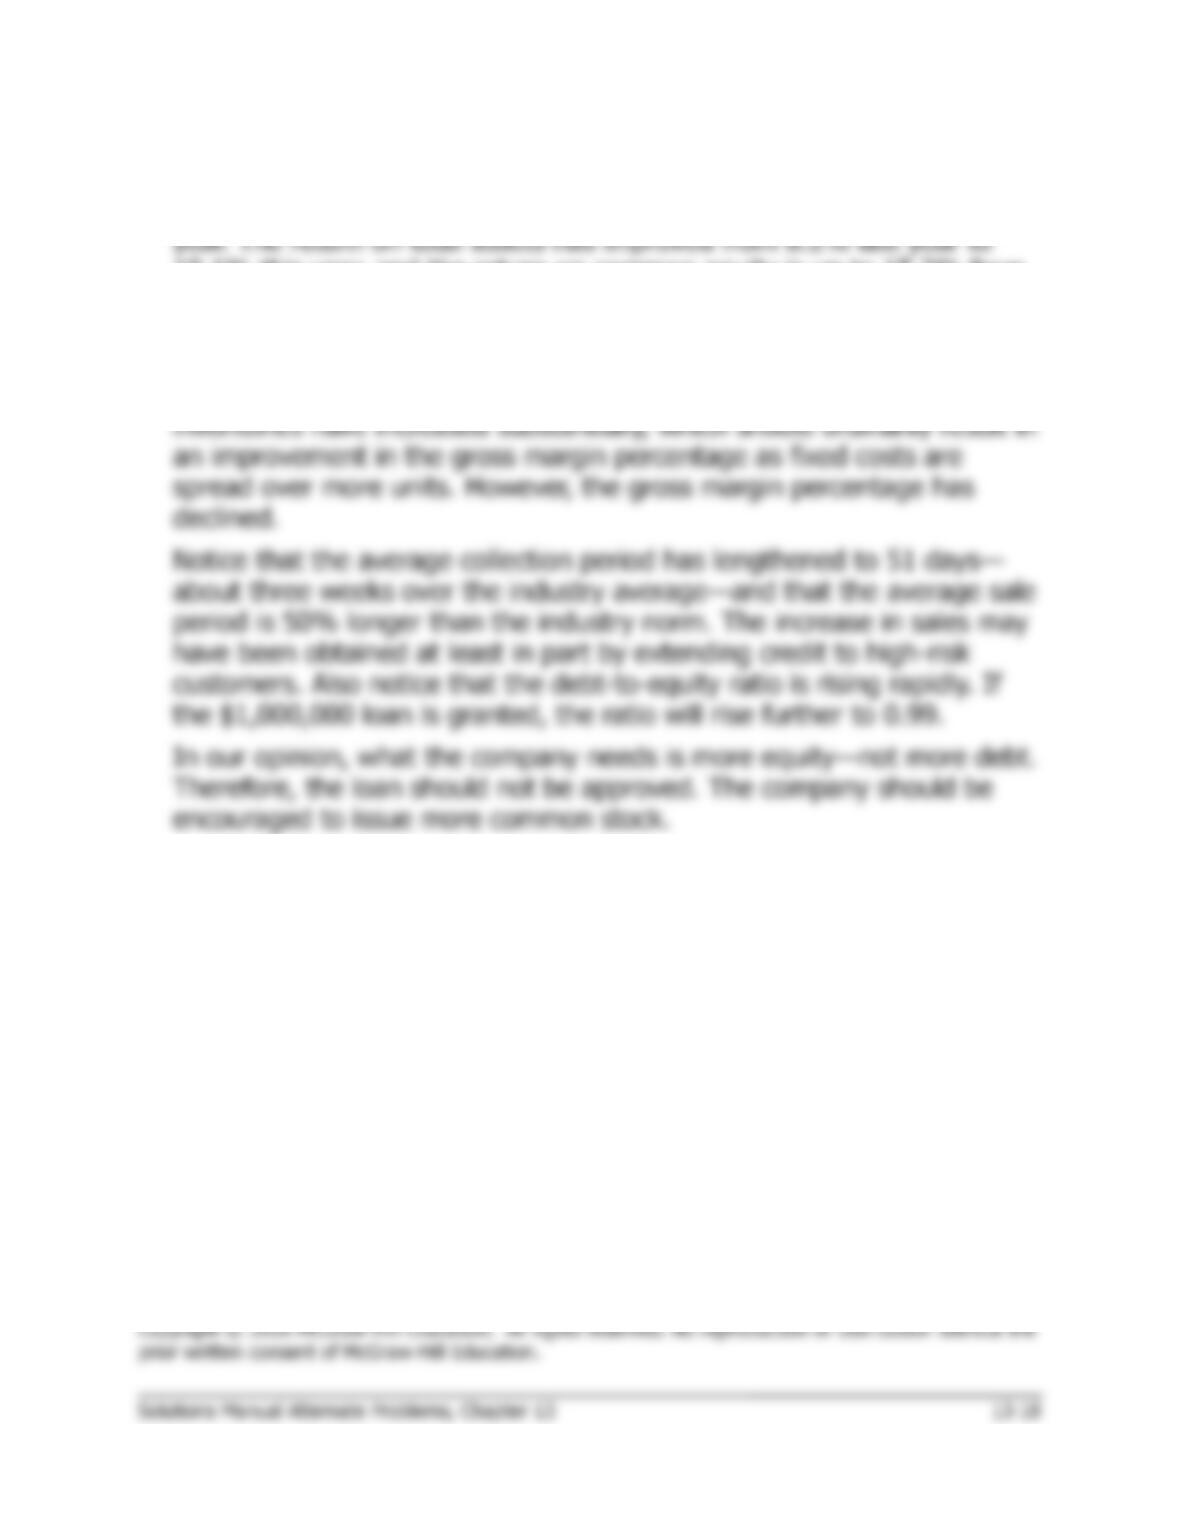
Problem 13-18B (continued)
4. As stated by Loretta Young, both net income and sales are up from last
10.1% this year, and the return on common equity is up to 15.2% from
8.0% the year before. But this appears to be the only bright spot.
Virtually all other ratios are below what is typical for the industry, and,
more important, they are trending downward. The deterioration in the
gross margin percentage, while not large, is worrisome. Sales and
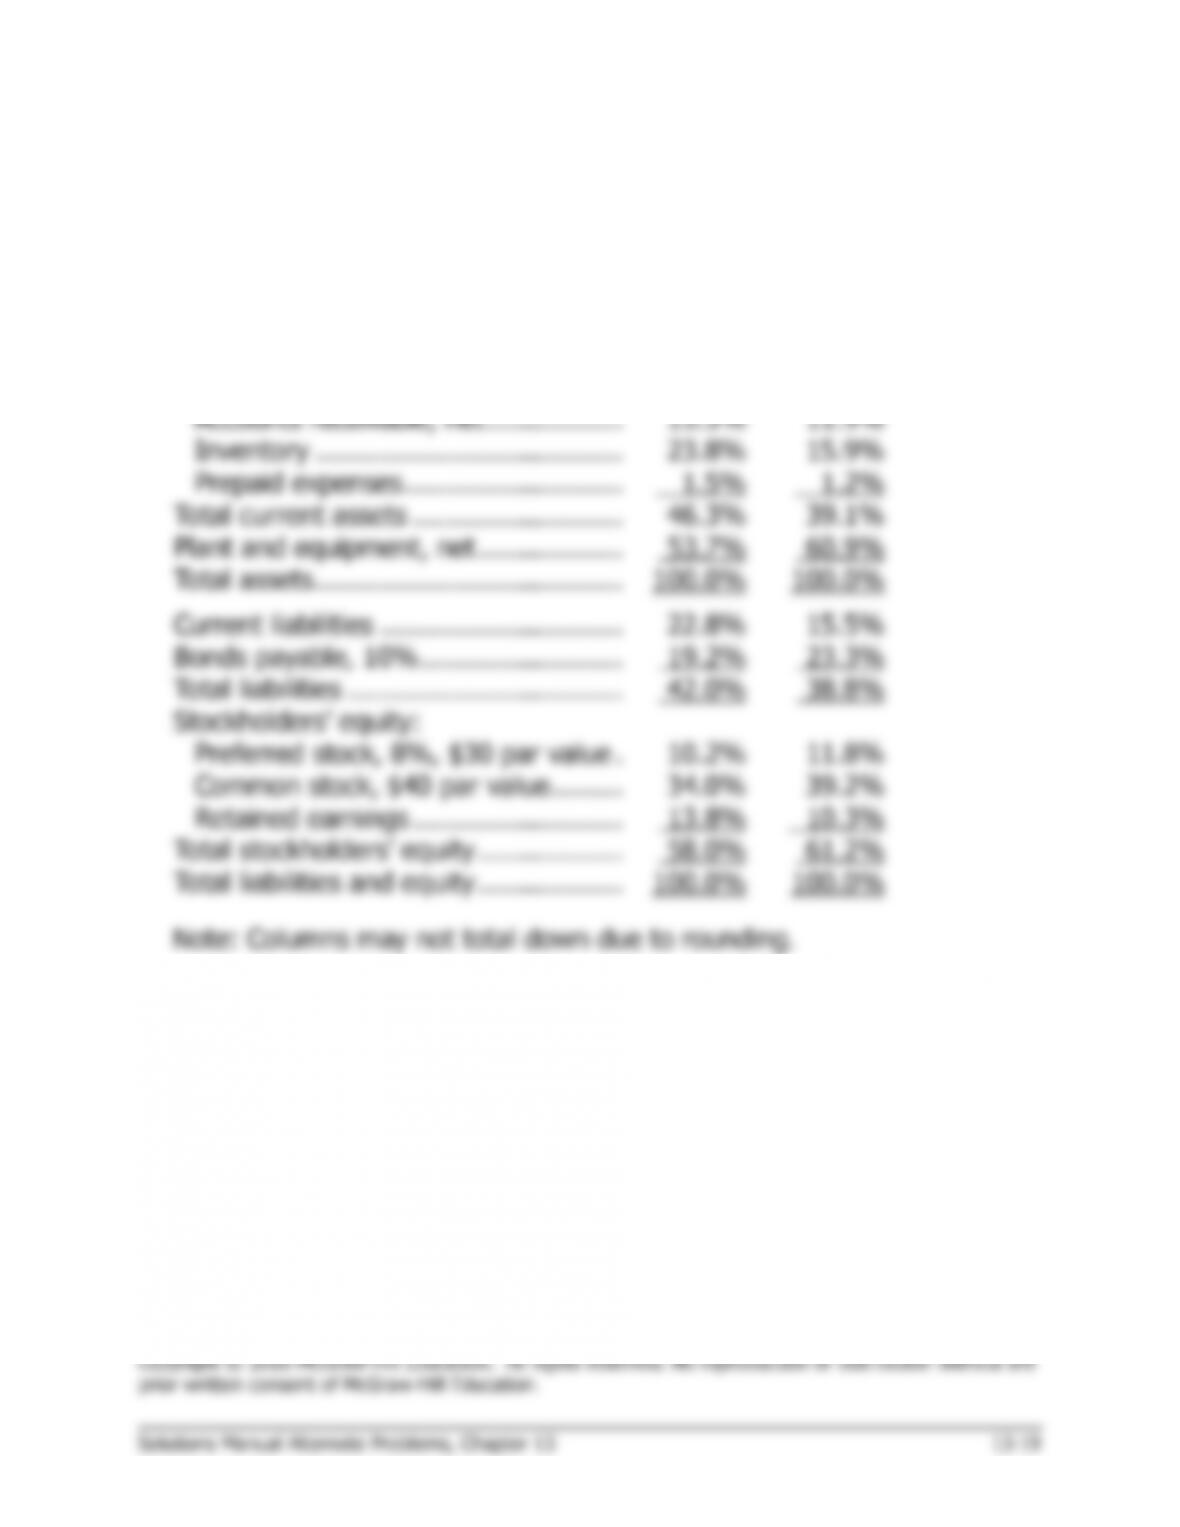
Problem 13-19B (30 minutes)
1.
Automart Company
Comparative Balance Sheets
This Year
Last Year
Current assets:
Cash ………………………………………
5.7%
8.3%
Marketable securities ………………….
0.0%
1.9%
Accounts receivable, net ……………..
15.3%
11.9%
Inventory ………………………………..
23.8%
15.9%
Prepaid expenses ………………………
1.5%
1.2%
Total current assets ……………………..
46.3%
39.1%
Plant and equipment, net ………………
53.7%
60.9%
Total assets ………………………………..
100.0%
100.0%
Current liabilities …………………………
22.8%
15.5%
Bonds payable, 10% …………………….
19.2%
23.3%
Total liabilities …………………………….
42.0%
38.8%
Stockholders’ equity:
Preferred stock, 8%, $30 par value .
10.2%
11.8%
Common stock, $40 par value ………
34.0%
39.2%
Retained earnings ……………………..
13.8%
10.3%
Total stockholders’ equity ………………
58.0%
61.2%
Total liabilities and equity ………………
100.0%
100.0%
Note: Columns may not total down due to rounding.
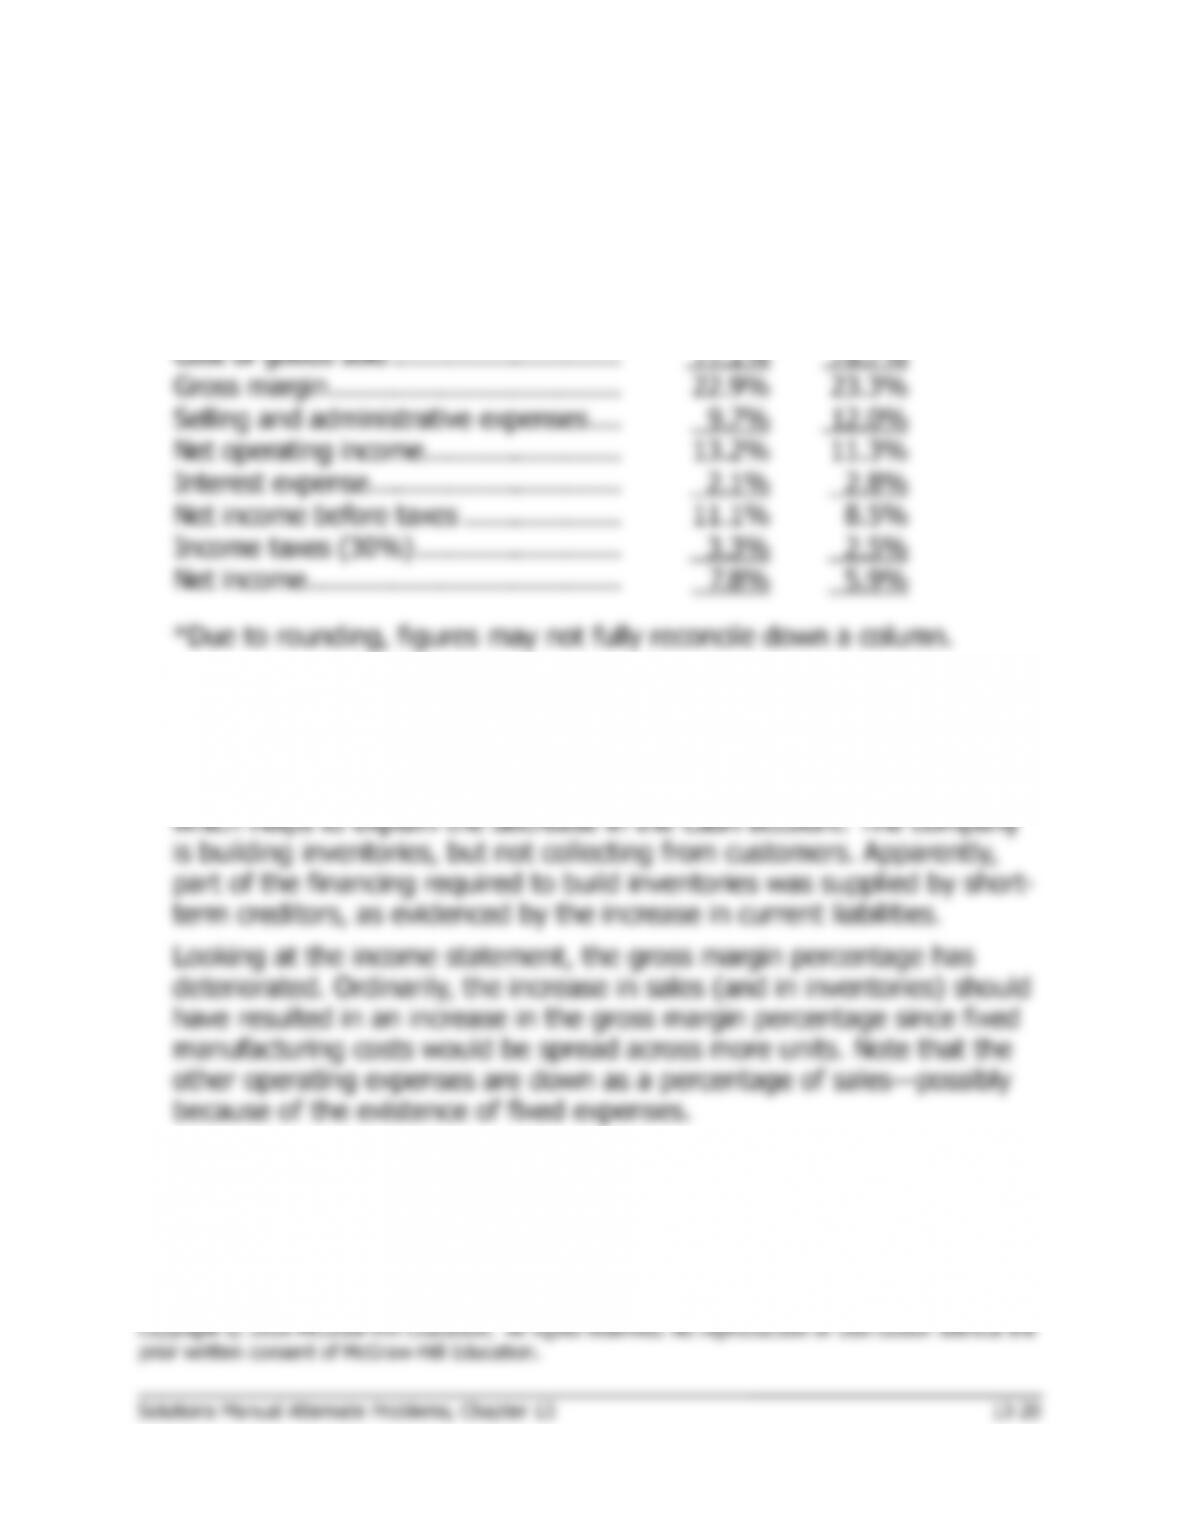
Problem 13-19B (continued)
2.
Automart Company
Comparative Income Statements
This Year
Last Year
Sales ………………………………………..
100.0%
100.0%
Cost of goods sold ………………………..
77.1%
76.7%
Gross margin ……………………………….
22.9%
23.3%
Selling and administrative expenses ….
9.7%
12.0%
Net operating income …………………….
13.2%
11.3%
Interest expense …………………………..
2.1%
2.8%
Net income before taxes ………………..
11.1%
8.5%
Income taxes (30%) ……………………..
3.3%
2.5%
Net income ………………………………….
7.8%
5.9%
*Due to rounding, figures may not fully reconcile down a column.
3. The company’s current position has declined substantially between the
two years. Cash this year represents only 5.7% of total assets, whereas
it represented 10.2% last year (Cash + Marketable Securities). In
addition, both accounts receivable and inventory are up from last year,