Comprehensive Problem, Colo Company (Continued)
Part 2—continued
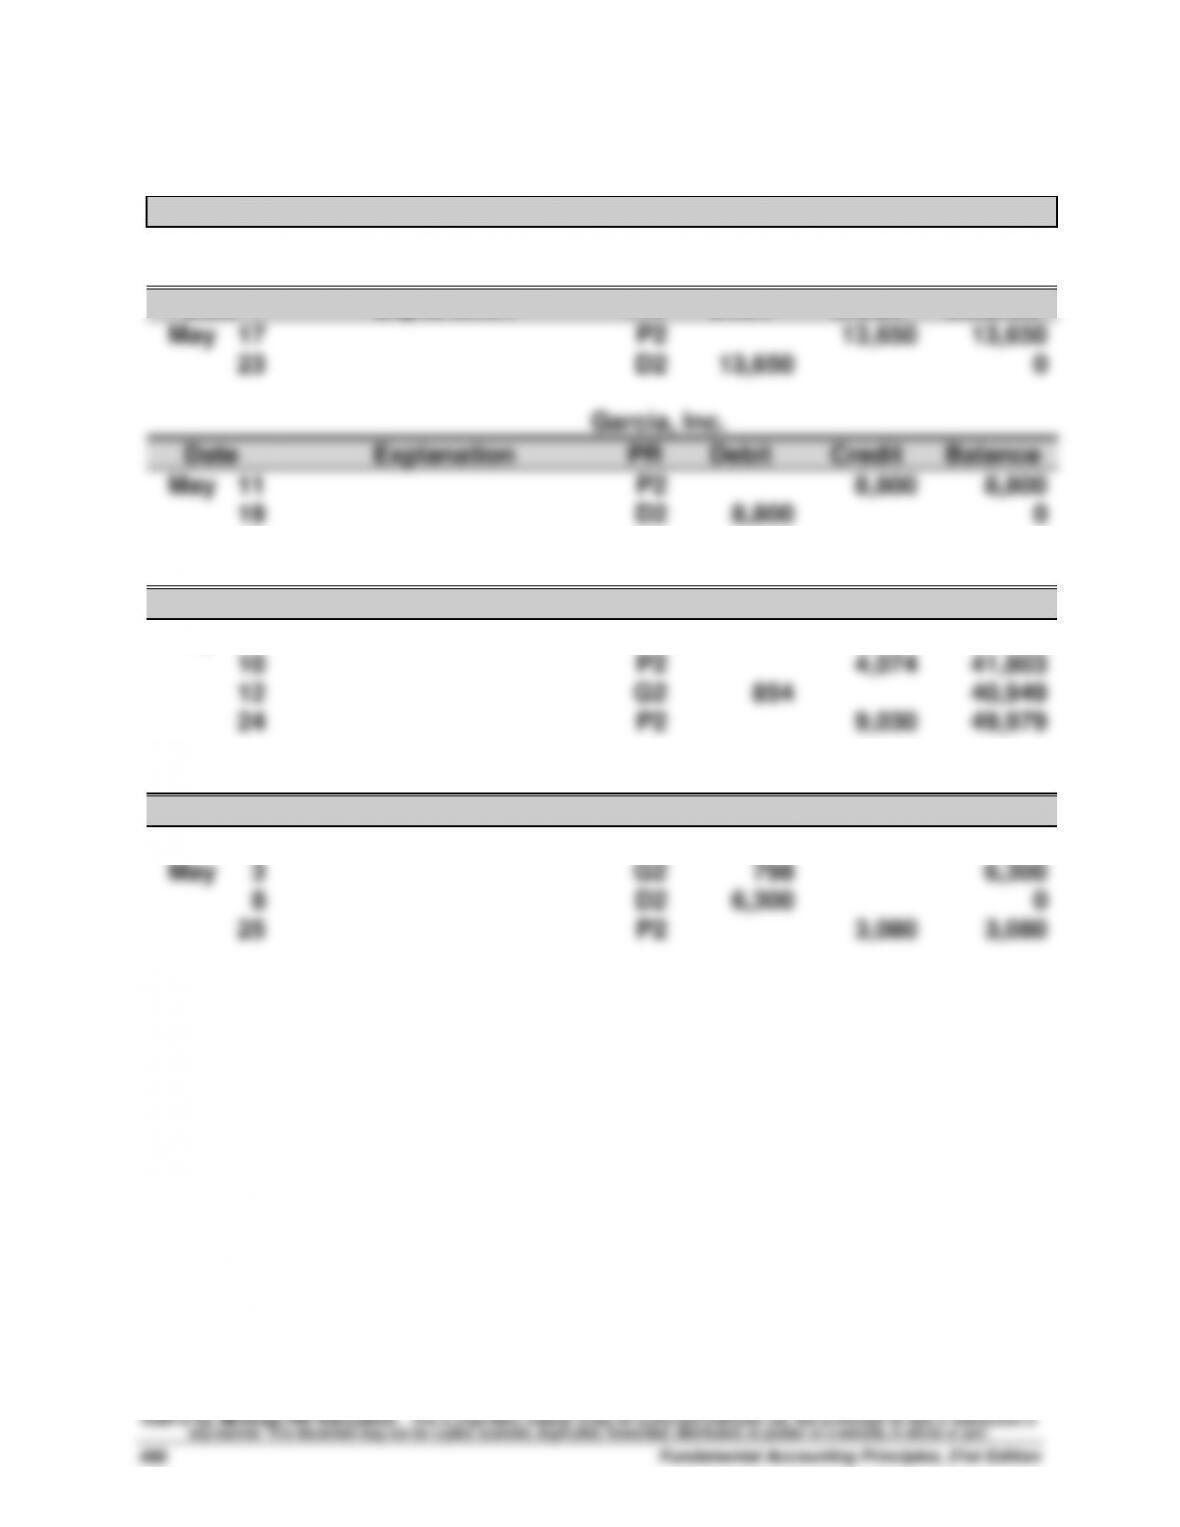
ACCOUNTS PAYABLE LEDGER
Fink Corp.
Date
Explanation
PR
Debit
Credit
Balance
May 17
P2
13,650
13,650
23
D2
13,650
0
Garcia, Inc.
Date
Explanation
PR
Debit
Credit
Balance
May 11
P2
8,800
8,800
19
D2
8,800
0
Gear Supply Co.
Date
Explanation
PR
Debit
Credit
Balance
May 4
P2
37,729
37,729
10
P2
4,074
41,803
12
G2
854
40,949
24
P2
9,030
49,979
Peyton Products
Date
Explanation
PR
Debit
Credit
Balance
Apr. 29
P2
7,098
7,098
May 3
G2
798
6,300
8
D2
6,300
0
25
P2
3,080
3,080
Comprehensive Problem, Colo Company (Continued)
Part 3
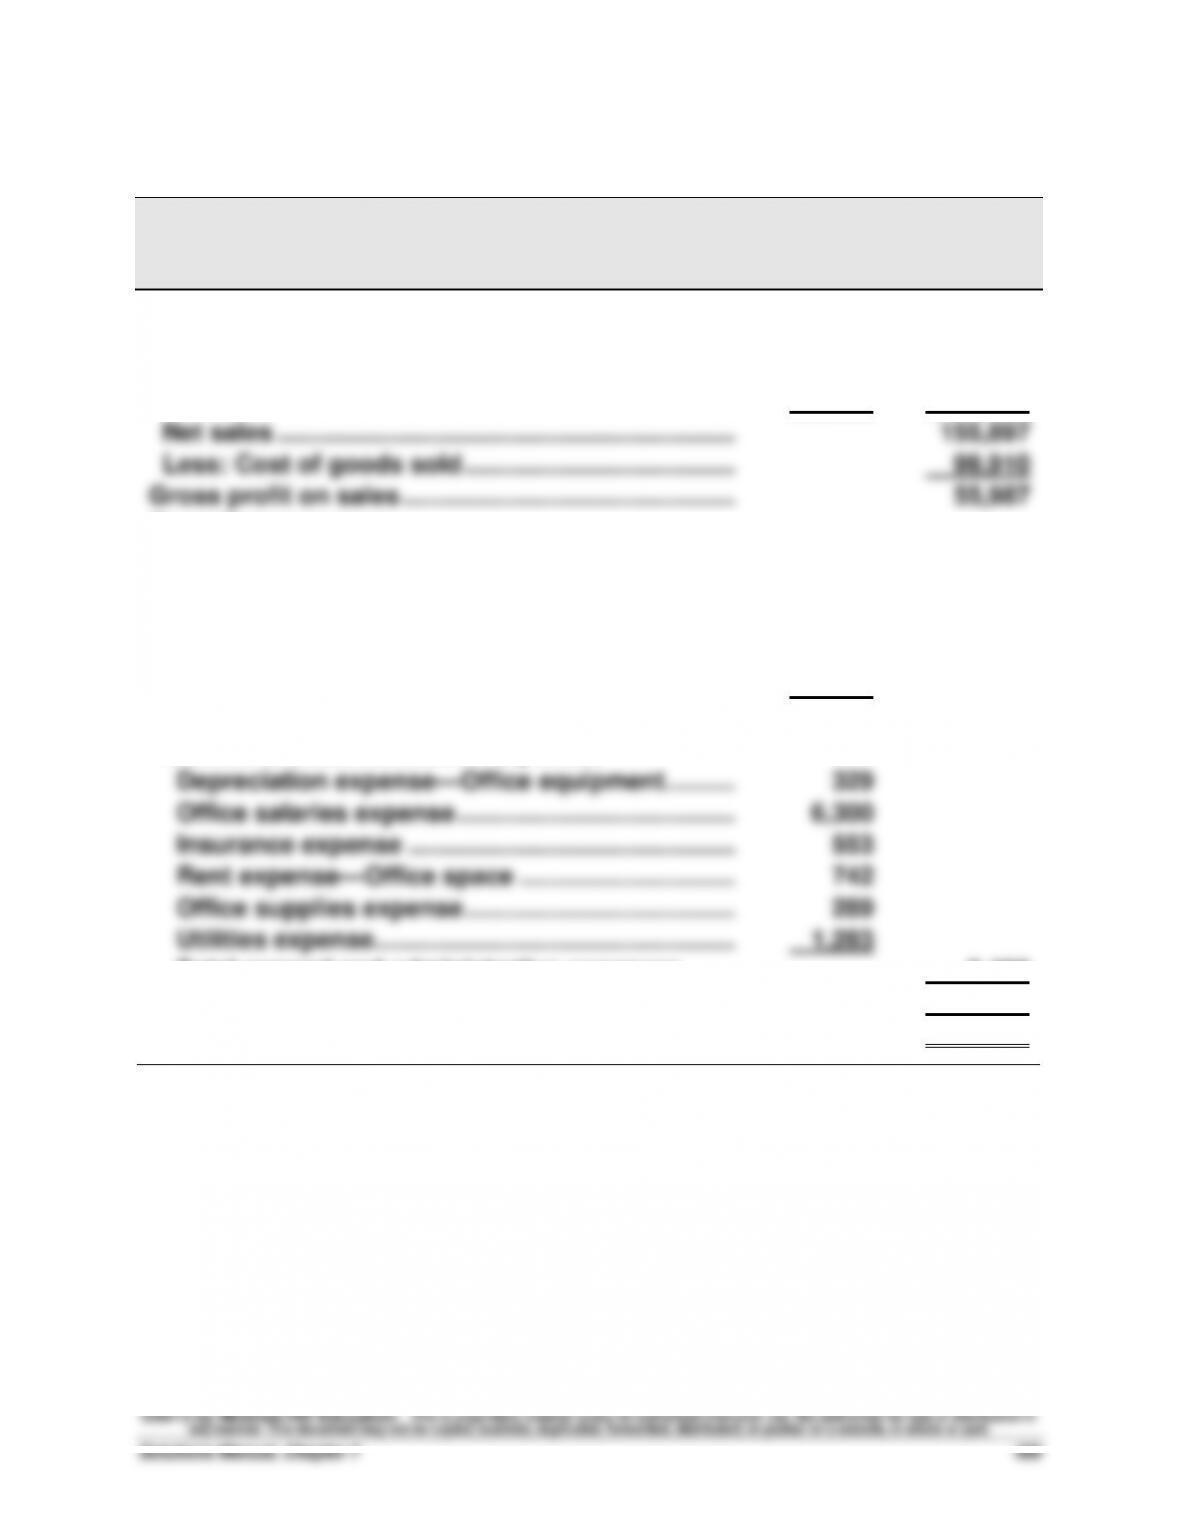
COLO COMPANY
Income Statement
For Month Ended May 31, 2013
Revenue
Sales ………………………………………………………………...
$156,422
Less: Sales discounts ……………………………………..
$ 350
Sales returns and allowances ………………...
175
525
Net sales …………………………………………………………..
155,897
Less: Cost of goods sold …………………………………..
99,910
Gross profit on sales …………………………………………..
55,987
Operating expenses
Selling expenses
Depreciation expense—Store equipment ………….
567
Sales salaries expense …………………………………….
10,640
Rent expense—Selling space …………………………..
2,968
Store supplies expense …………………………………...
669
Total selling expenses …………………………………….
14,844
General and administrative expenses
Depreciation expense—Office equipment ………...
329
Office salaries expense …………………………………...
6,300
Insurance expense ………………………………………….
553
Rent expense—Office space …………………………..
742
Office supplies expense …………………………………..
289
Utilities expense……………………………………………...
1,283
Total general and administrative expenses ……...
9,496
Total operating expenses ………………………………….
24,340
Net income ………………………………………………………….
$ 31,647
Comprehensive Problem, Colo Company (Continued)
Part 3—continued
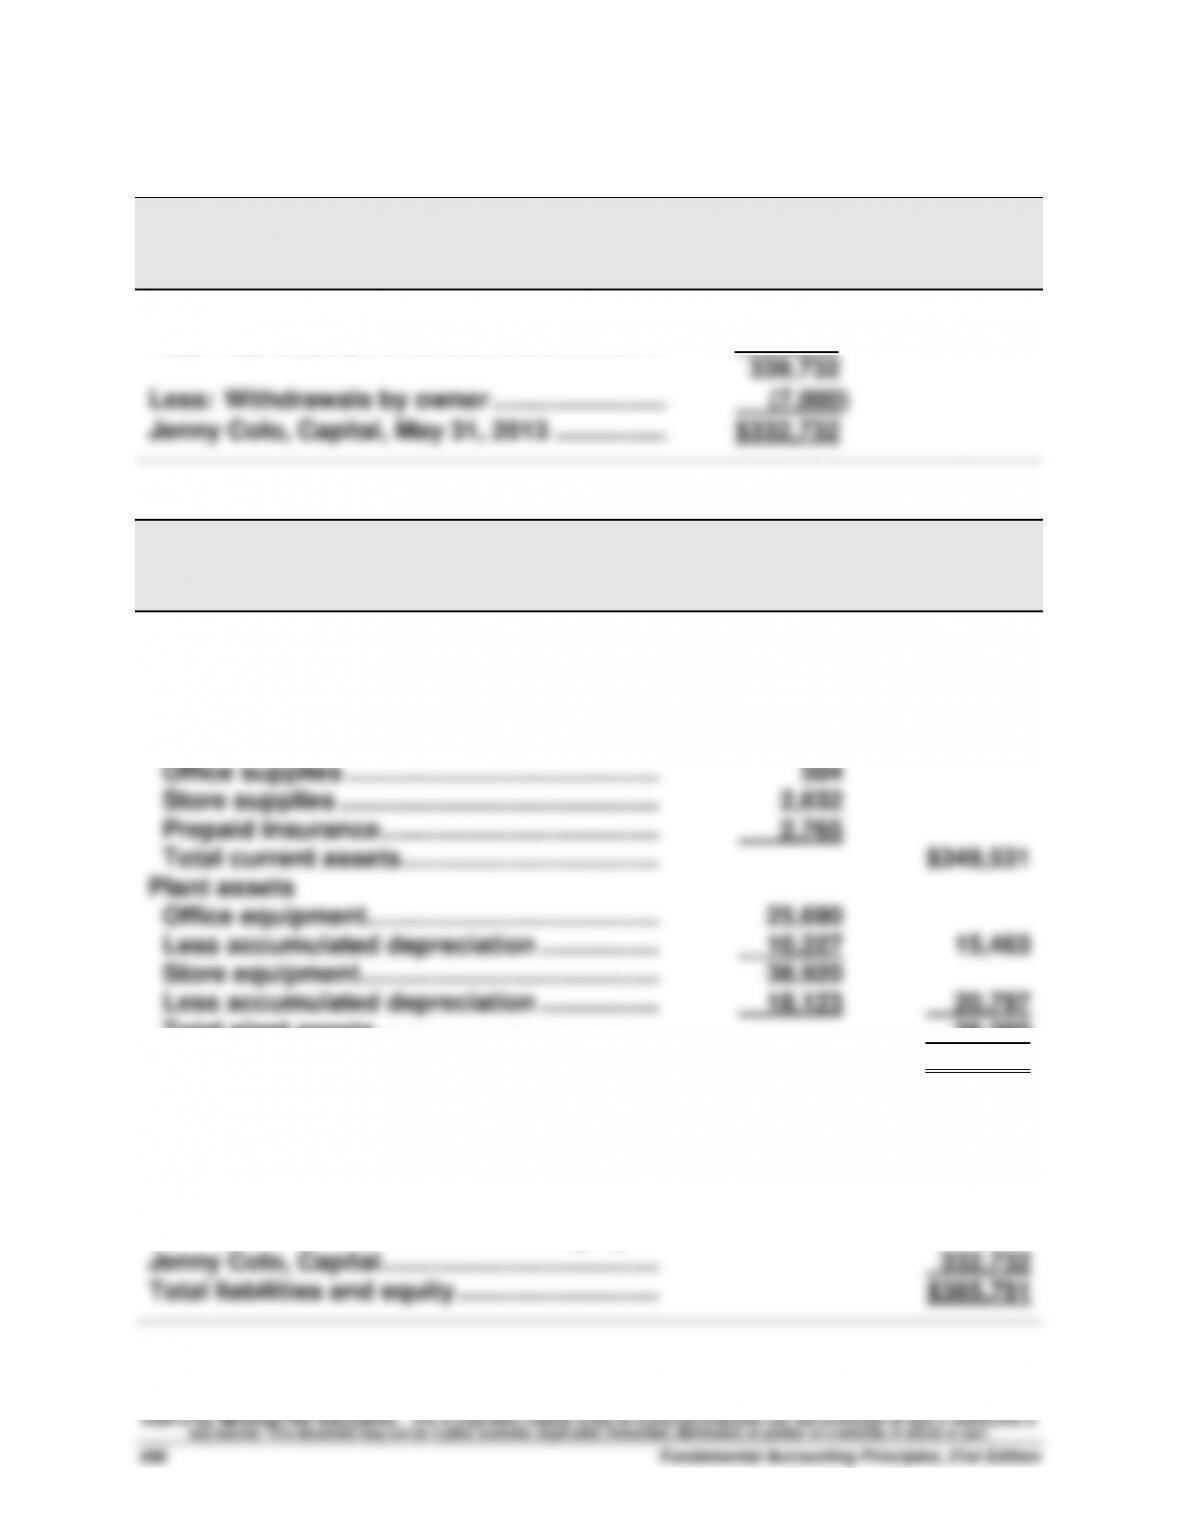
COLO COMPANY
Statement of Owner’s Equity
For Month Ended May 31, 2013
Jenny Colo, Capital, April 30, 2013 …………….
$308,085
Plus: Net income ………………………………………
31,647
339,732
Less: Withdrawals by owner ……………………..
(7,000)
Jenny Colo, Capital, May 31, 2013 ……………..
$332,732
COLO COMPANY
Balance Sheet
May 31, 2013
Assets
Current assets
Cash ……………………………………………………..
$135,911
Accounts receivable ………………………………
18,200
Merchandise inventory …………………………..
189,519
Office supplies …………………………..………….
504
Store supplies …………………………..…………..
2,632
Prepaid insurance ………………………………….
2,765
Total current assets ……………………………….
$349,531
Plant assets
Office equipment……………………………………
25,690
Less accumulated depreciation ……………..
10,227
15,463
Store equipment…………………………………….
38,920
Less accumulated depreciation ……………..
18,123
20,797
Total plant assets…………………………………..
36,260
Total assets …………………………………………….
$385,791
Liabilities
Current liabilities
Accounts payable ………………………………….
$ 53,059
Equity
Jenny Colo, Capital………………………………….
332,732
Total liabilities and equity ………………………..
$385,791
Comprehensive Problem, Colo Company (Concluded)
Part 4
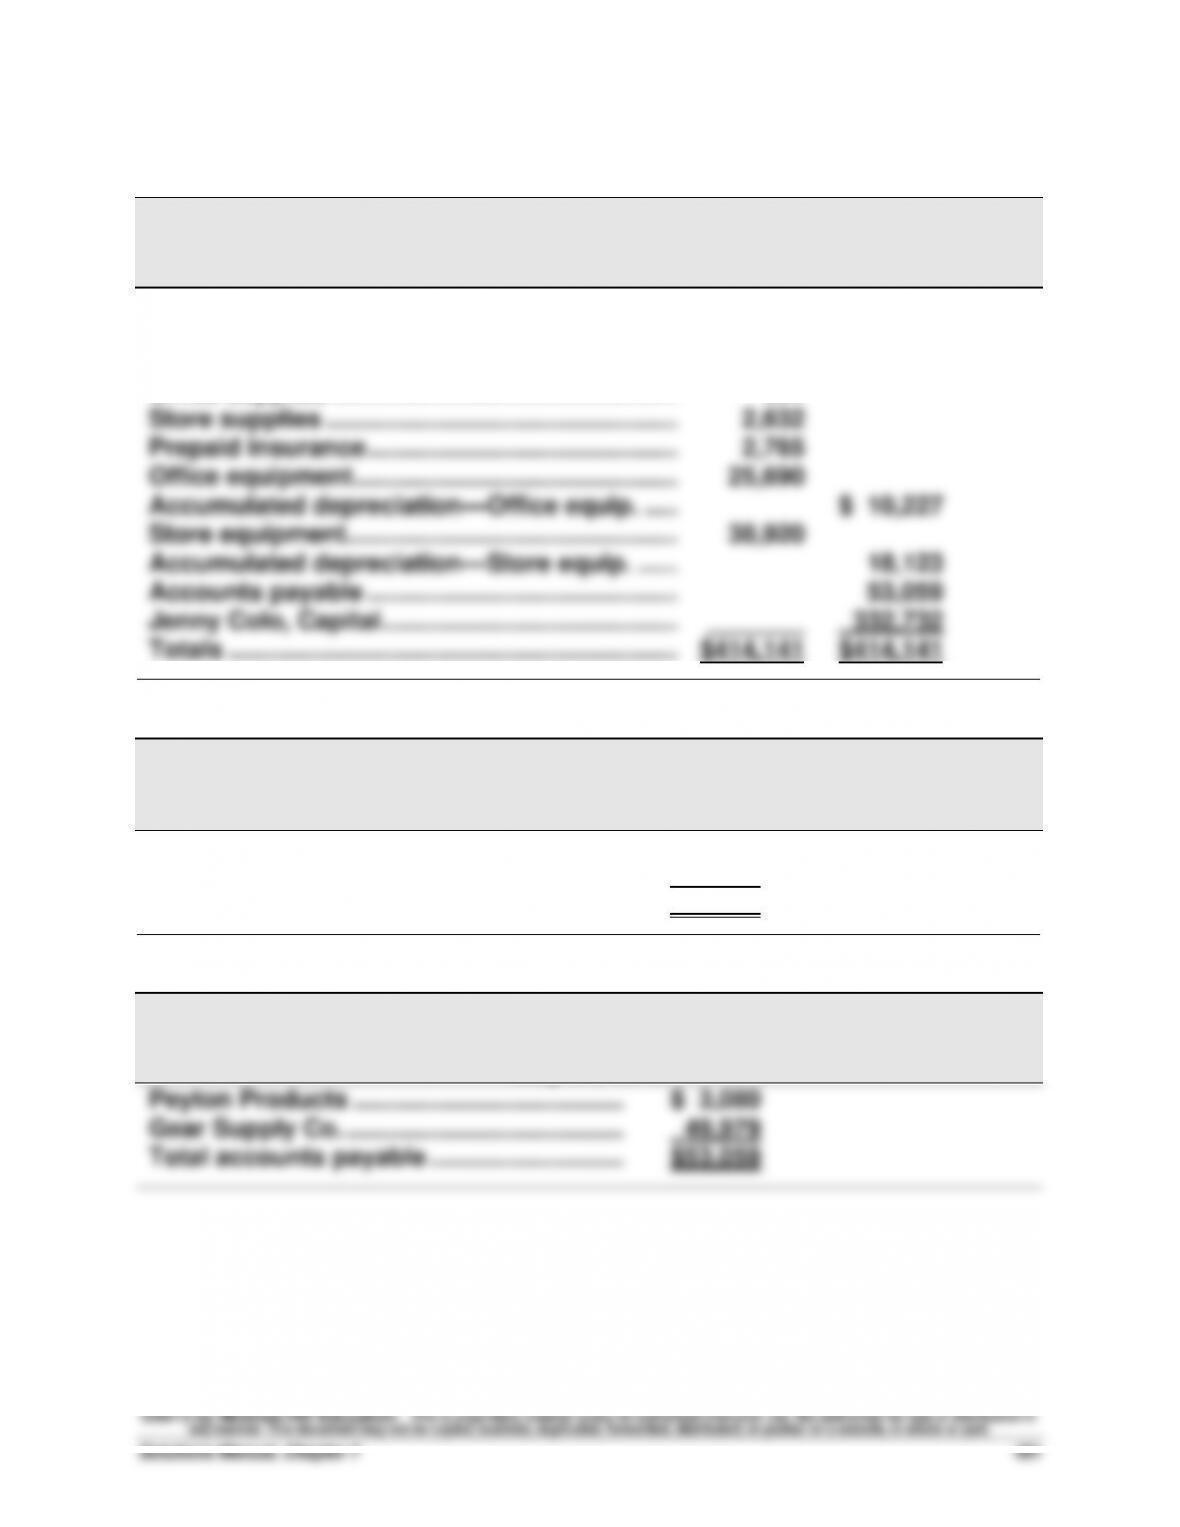
COLO COMPANY
Post-Closing Trial Balance
May 31, 2013
Cash ………………………………………………………….…
$135,911
Accounts receivable …………………………………..…
18,200
Merchandise inventory ……………………………….…
189,519
Office supplies …………………………………………..…
504
Store supplies ………………………………………………
2,632
Prepaid insurance …………………………………………
2,765
Office equipment………………………………………..…
25,690
Accumulated depreciation—Office equip. …..…
$ 10,227
Store equipment……………………………………………
38,920
Accumulated depreciation—Store equip. ………
18,123
Accounts payable …………………………………………
53,059
Jenny Colo, Capital…………………………………….…
_______
332,732
Totals ………………………………………………………..…
$414,141
$414,141
COLO COMPANY
Schedule of Accounts Receivable
May 31, 2013
Crane Corp. ………………………………………..…
$14,210
Hensel Company ………………………………..…
3,990
Total accounts receivable ………………………
$18,200
COLO COMPANY
Schedule of Accounts Payable
May 31, 2013
Peyton Products …………………………..…….…
$ 3,080
Gear Supply Co. ………………………………….…
49,979
Total accounts payable ……………………….…
$53,059
Reporting in Action — BTN 7-1
1. Polaris’s Note 12 identifies its single reported business segment.
2. Polaris identifies and describes its single reportable segment in its
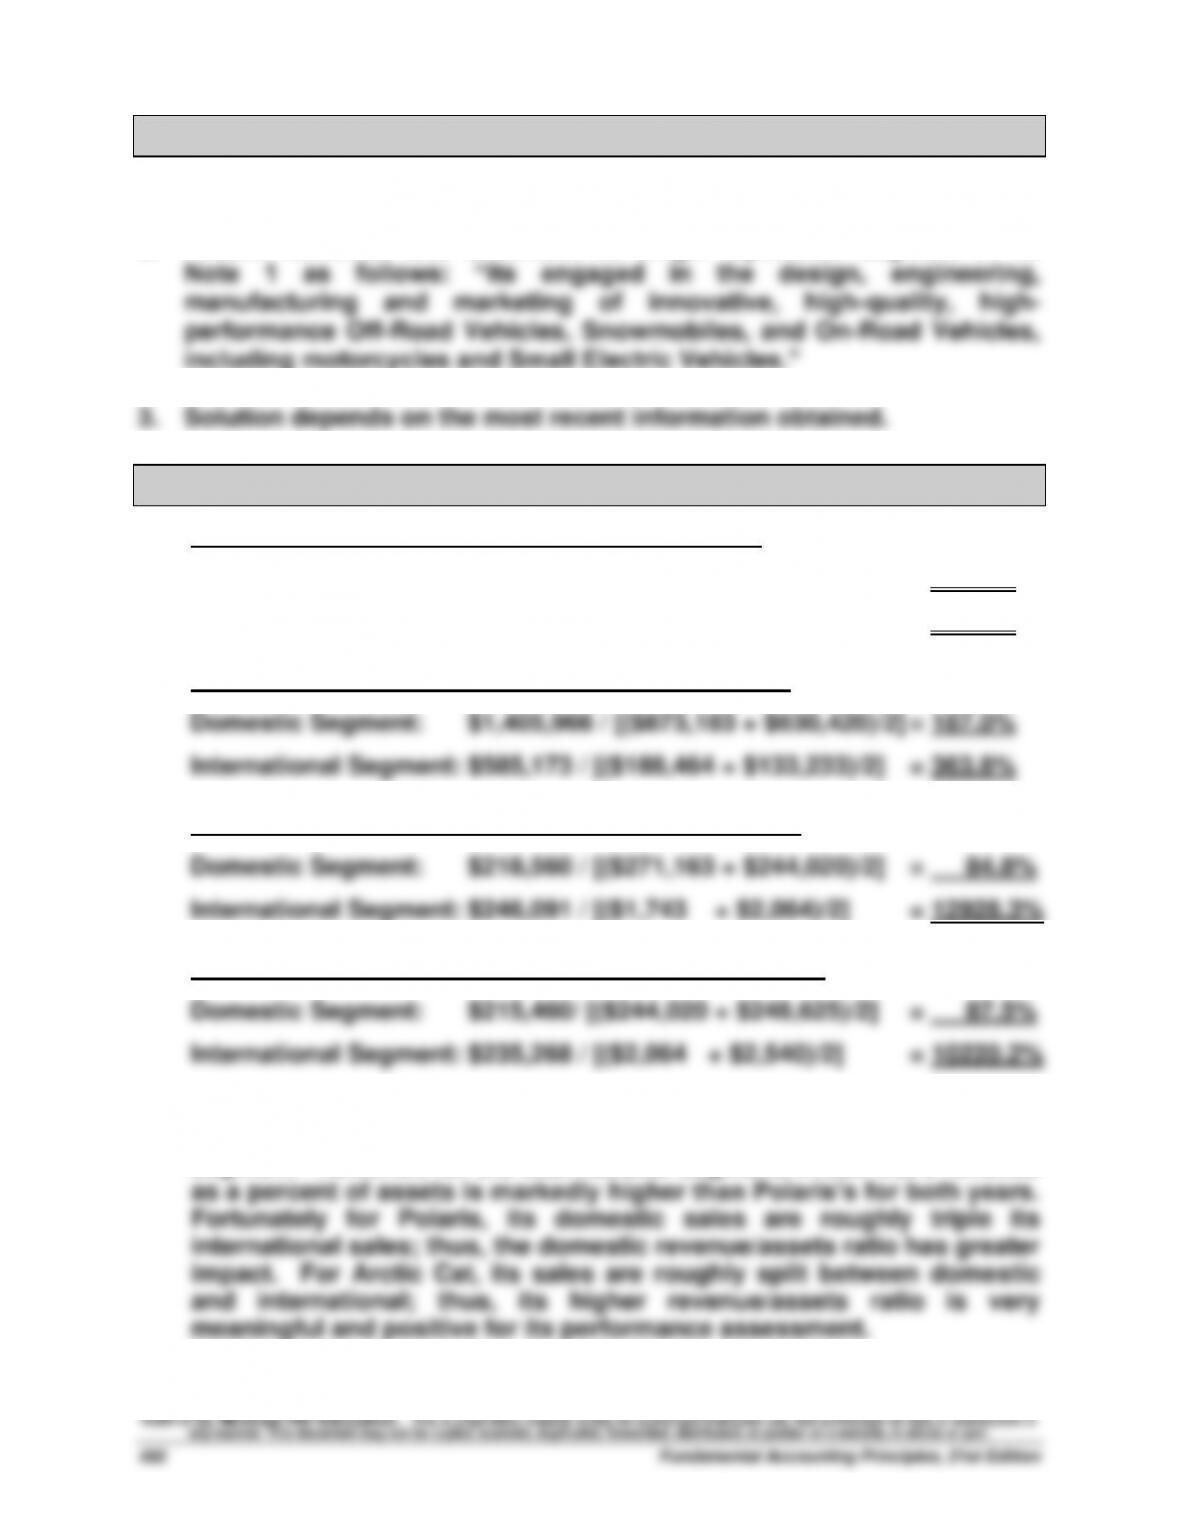
Comparative Analysis — BTN 7-2
1. Polaris – Current Year Revenue/Segment Assets
Domestic segment: $1,864,099 / [($957,497 + $873,183)/2] = 203.7%
International segment: $792,850 / [($270,527 + $188,464)/2] = 345.5%
Polaris – One Year Prior Revenue/Segment Assets
Arctic Cat – Current Year Revenue/Segment Assets
Arctic Cat – One Year Prior Revenue/Segment Assets
2. Polaris’s domestic revenue as a percent of its domestic assets is
markedly higher than of Arctic Cat’s for both years for the domestic
segment. However, for the international segment, Arctic Cat’s revenue
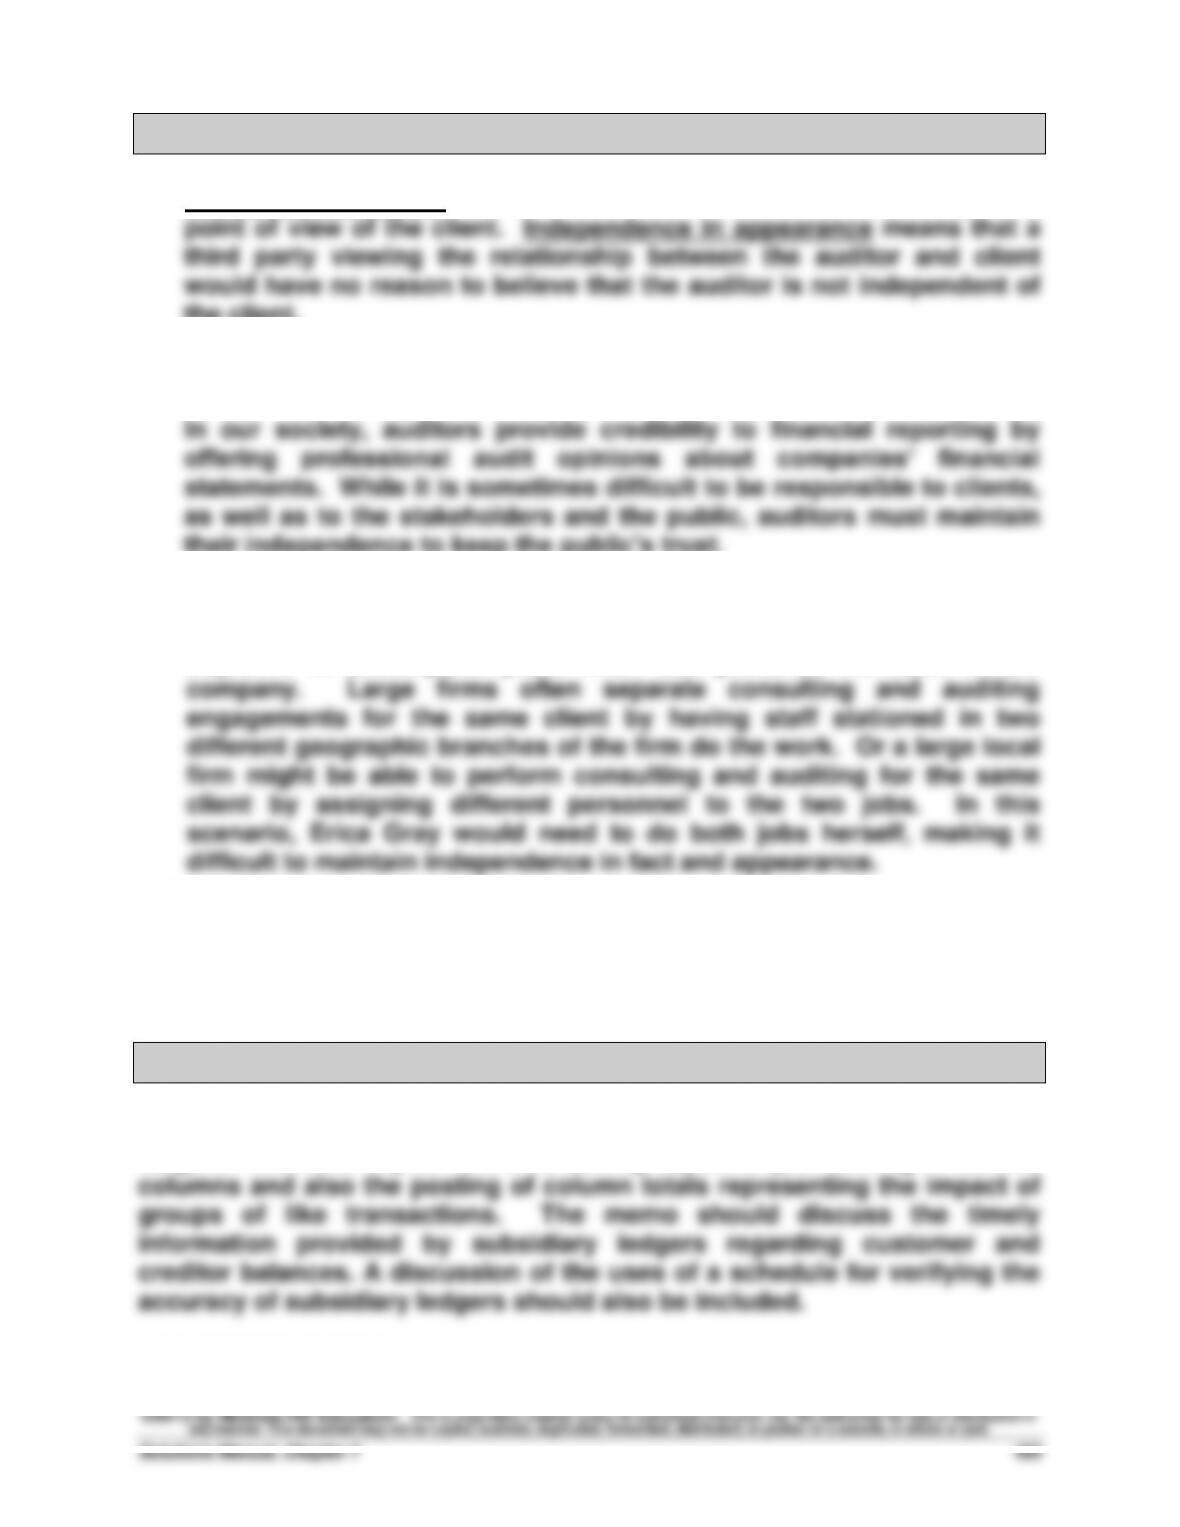
Ethics Challenge — BTN 7-3
1. Independence in fact means that the auditor maintains an objective
the client.
2. While auditors are hired by their clients to perform audits, auditors
have a responsibility to the company’s “stakeholders” and the public.
their independence to keep the public’s trust.
3. Since Erica Gray is a sole practitioner it is questionable whether she
can consult on the client’s accounting system and then remain
objective in subsequent years when she performs the audit of the
(Note to instructors: The Sarbanes–Oxley Act specifically prohibits auditors
from providing financial information and system designs for their SEC audit
clients. This was codified by the SEC [Final Ruling 68].)
Communicating in Practice — BTN 7–4
The memo should recommend the use of special journals and subsidiary
ledgers. It should explain the time-saving aspect of journalizing in labeled
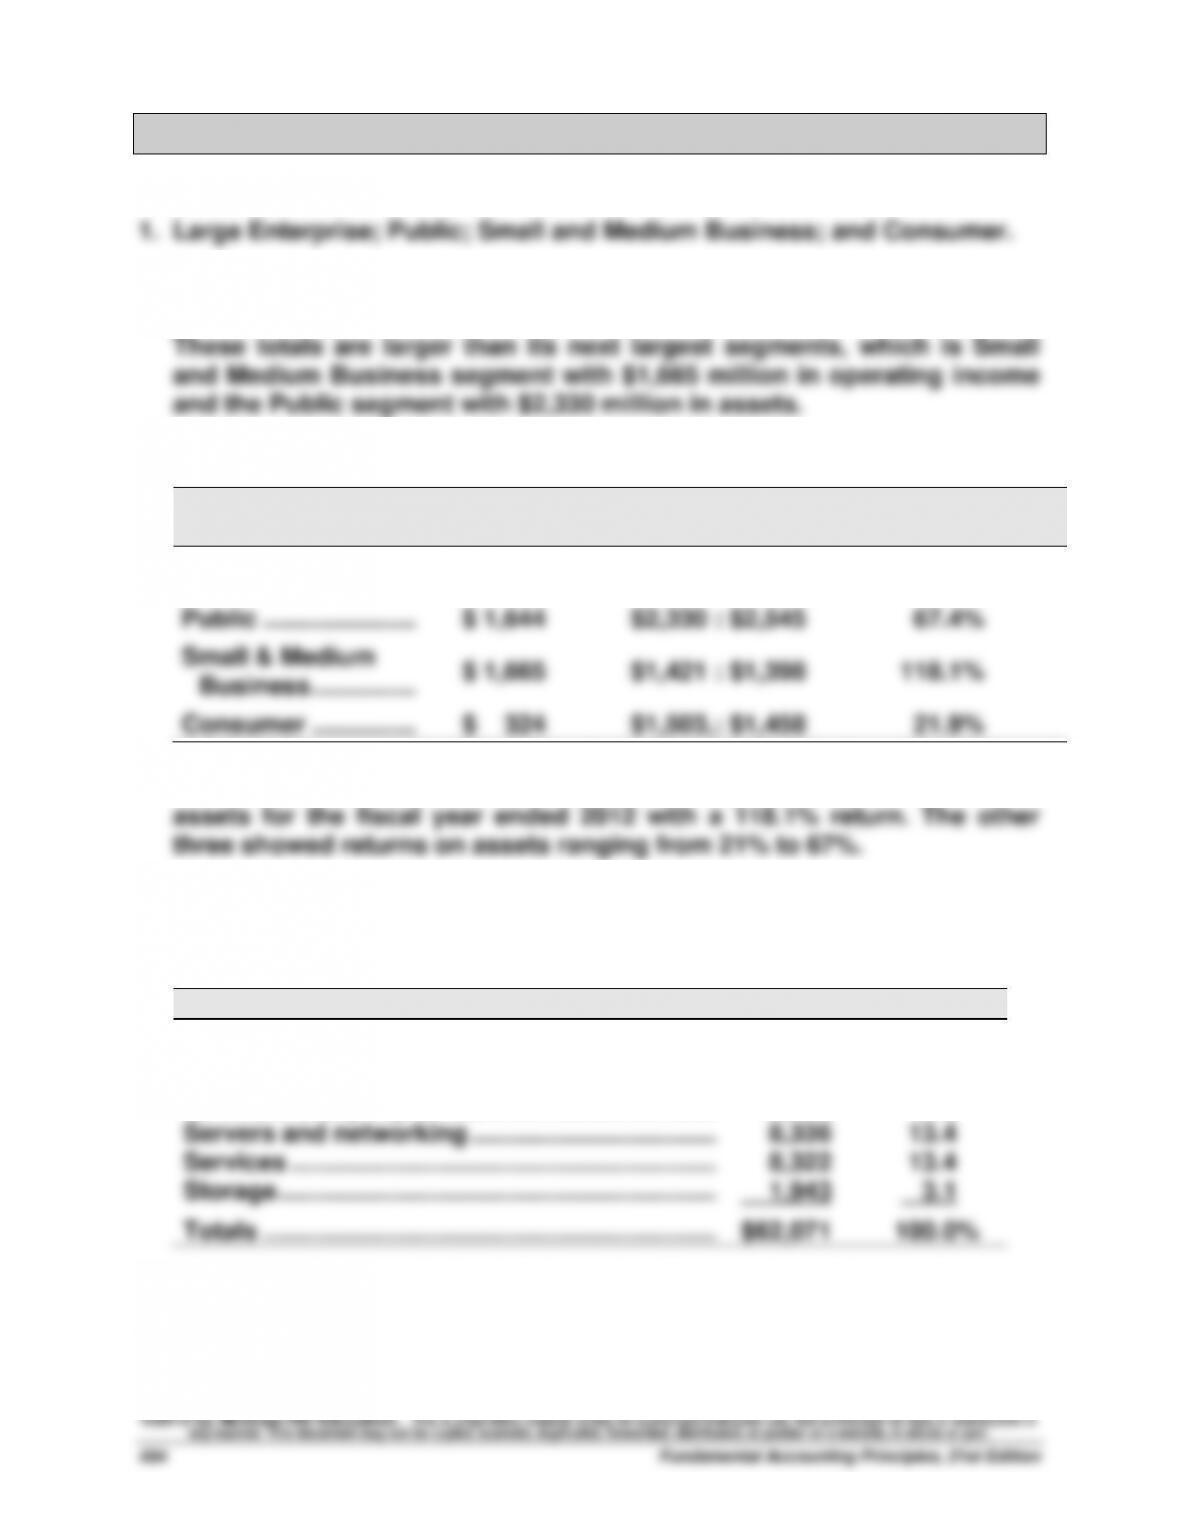
Taking It to the Net — BTN 7-5
(See Dell’s Note 14 – Segment Information)
2. The Large Enterprise segment reports $1,854 million of operating income
and the Large Enterprise segment reports $3,108 million of assets.
3. Dell’s Operating Income and Total Assets by Segment
($ millions)
Operating
Income 2012
Total Assets 2012 :
Total Assets 2011
Segment Return
on Assets
Large Enterprise …..……
$ 1,854
$3,108 : $2,934
61.4%
Public ………………….……
$ 1,644
$2,330 : $2,545
67.4%
Small & Medium
Business …………………
$ 1,665
$1,421 : $1,398
118.1%
Consumer …………………
$ 324
$1,503,: $1,458
21.9%
The Small and Medium Business had the highest segment return on
4. The six product groups reported by Dell include: Desktop PCs, Mobility,
Software and peripherals, Servers and networking, Enhanced services,
and Storage.
($ millions)
2012 Fiscal Year
Mobility ……………………………………………………….
$19,104 30.8%
Desktop PCs ……………………………………………….
14,144 22.8
Software and peripherals ………………………….....
10,222 16.5
Servers and networking …………………………..…..
8,336 13.4
Services ……………………………………………………...
8,322 13.4
Storage ……………………………………………………….
1,943 3.1
Totals ………………………………………………………….
$62,071 100.0%
Dell earned more—in both dollars and returns—from its Mobility group;
its Desktop PCs was second in both categories.
Teamwork in Action — BTN 7–6
For check figures in the implementation of this activity see the solution
to Problem 7-3A or 7-3B.
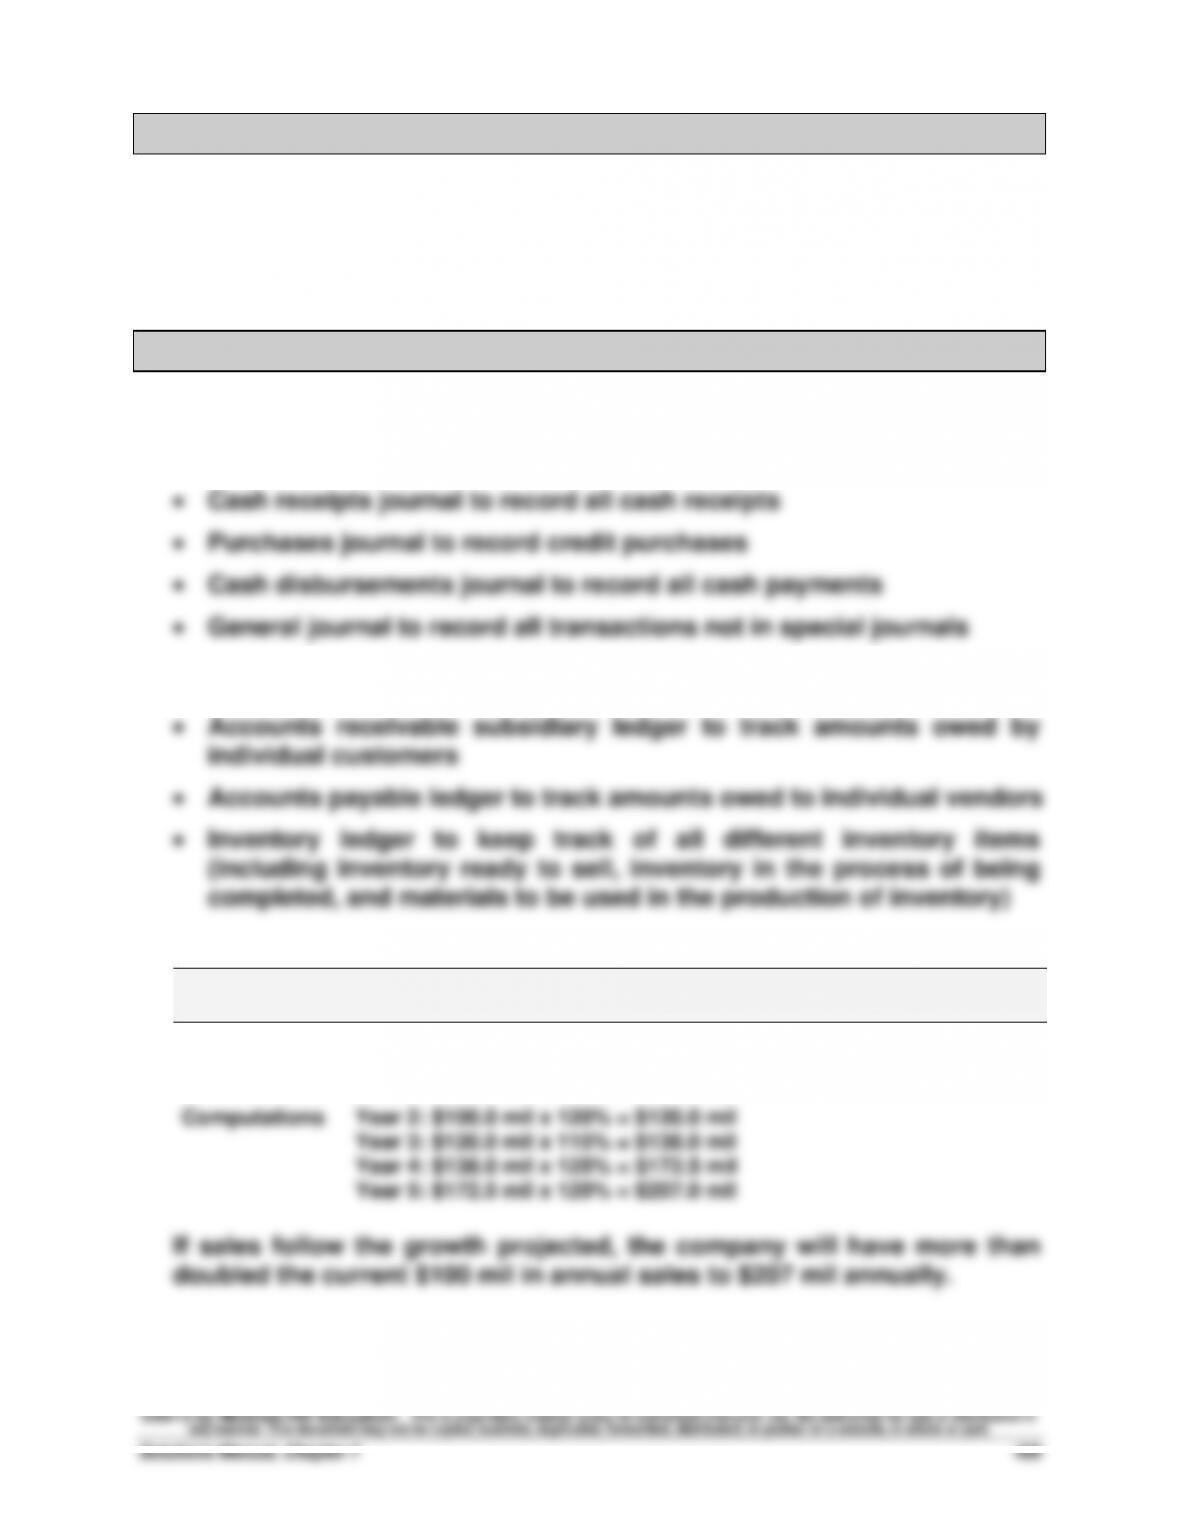
Entrepreneurial Decision — BTN 7-7
1. The following special journals are likely to be used:
• Sales journal to record credit sales
The company also is likely to use the following subsidiary ledgers:
2.
Year
One Year
Hence
Two Years
Hence
Three Years
Hence
Four Years
Hence
Five Years
Hence
Sales …………………………
$100.0 mil
120.0 mil
$138.0 mil
$172.5 mil
$207.0 mil
Global Decision — BTN 7-8
1. KTM has the following reported segments:
2. KTM discloses dollar amounts for the following line items:
• Profit and Loss Information
• Balance sheet information