Title: Problem 6-4A
QA_Ori:
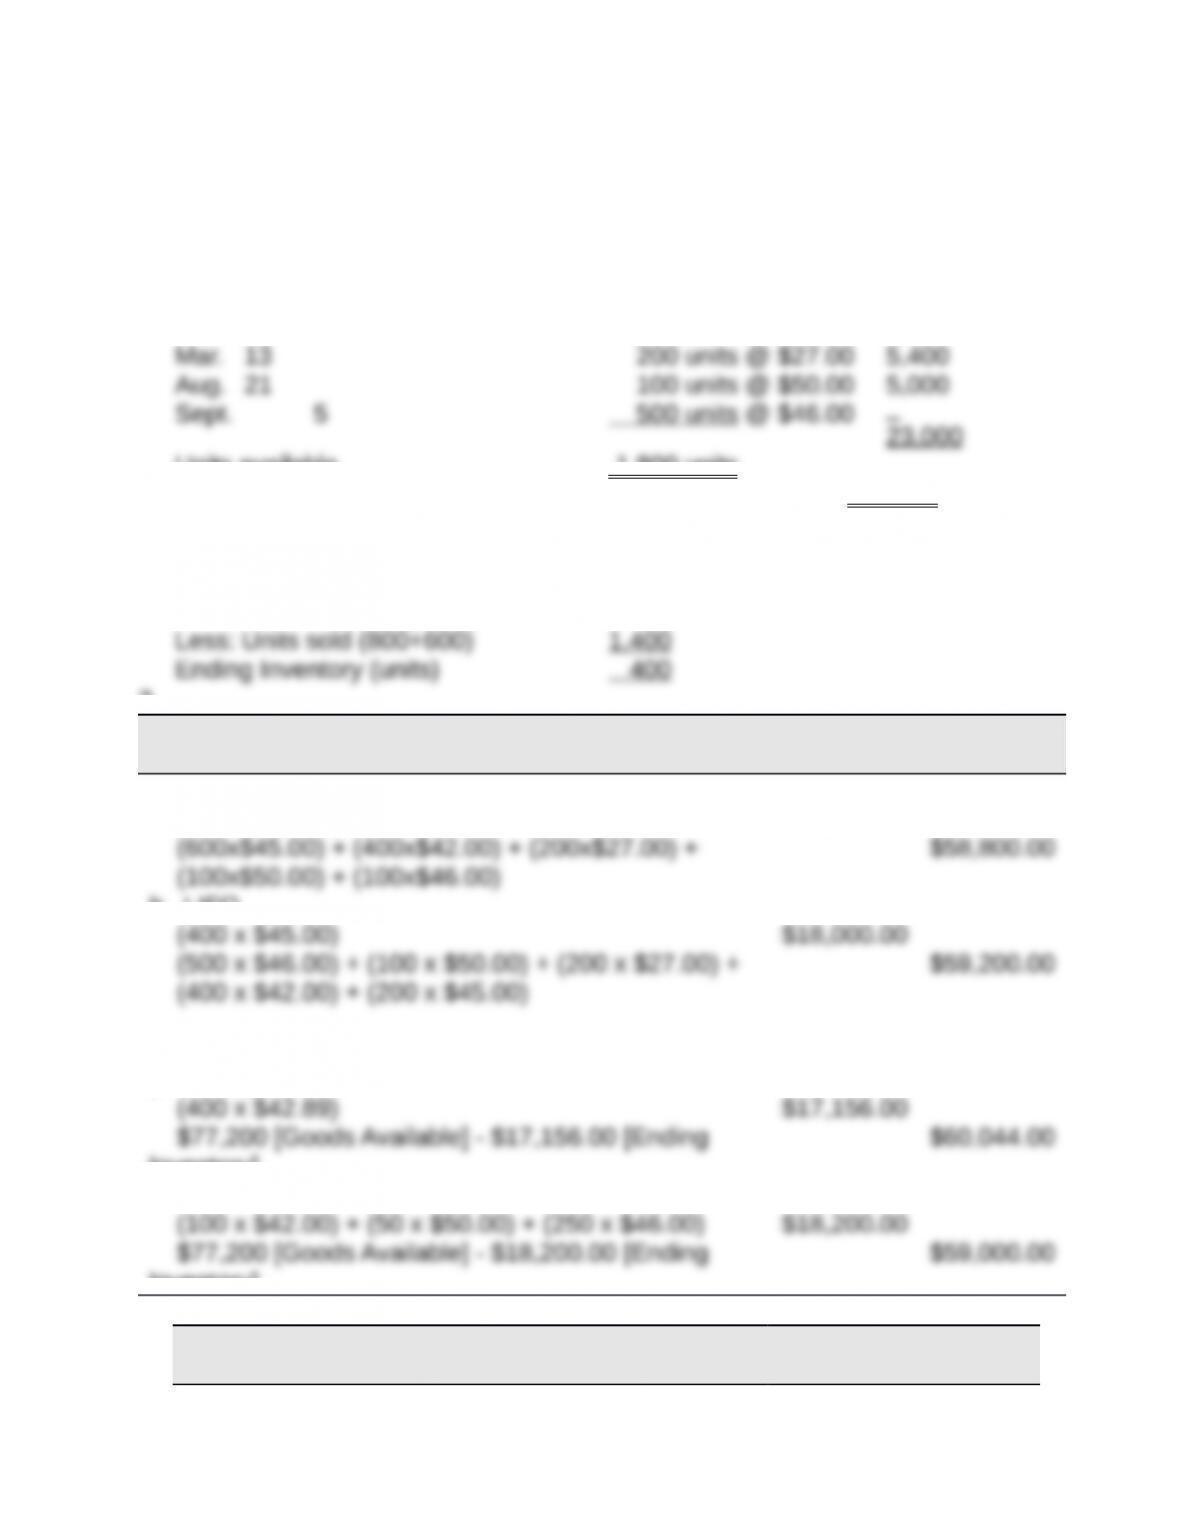
1. Calculate cost of goods available for sale and units available for sale
Beginning inventory 600 units @ $45.00 $27,00
0
Feb. 10 400 units @ $42.00 16,800
Units available 1,800 units
Cost of goods available for sale $77,200
2. Units in ending inventory
Units available (from part 1) 1,800
3.
Periodic Inventory
Ending
Inventory
Cost of
Goods Sold
a. FIFO
(400 x $46.00) $18,400.00
(100x$50.00) + (100x$46.00)
b. LIFO
(400 x $42.00) + (200 x $45.00)
c. Weighted average ($77,200/1,800 = $42.89
[rounded])
Inventory]
d. Specific identification
Inventory]
4.
Specific
Identifi-c Weighted
FIFO LIFO ation Average
Sales (1,400 x $75) $105,00
0
$105,00
0
$105,00
0
$105,000
5. The manager would likely prefer the FIFO method since this methods’
gross profit is the largest at $46,200. This would give the manager the highest
bonus based on gross profit.
Title: Problem 6-5A
QA_Ori:
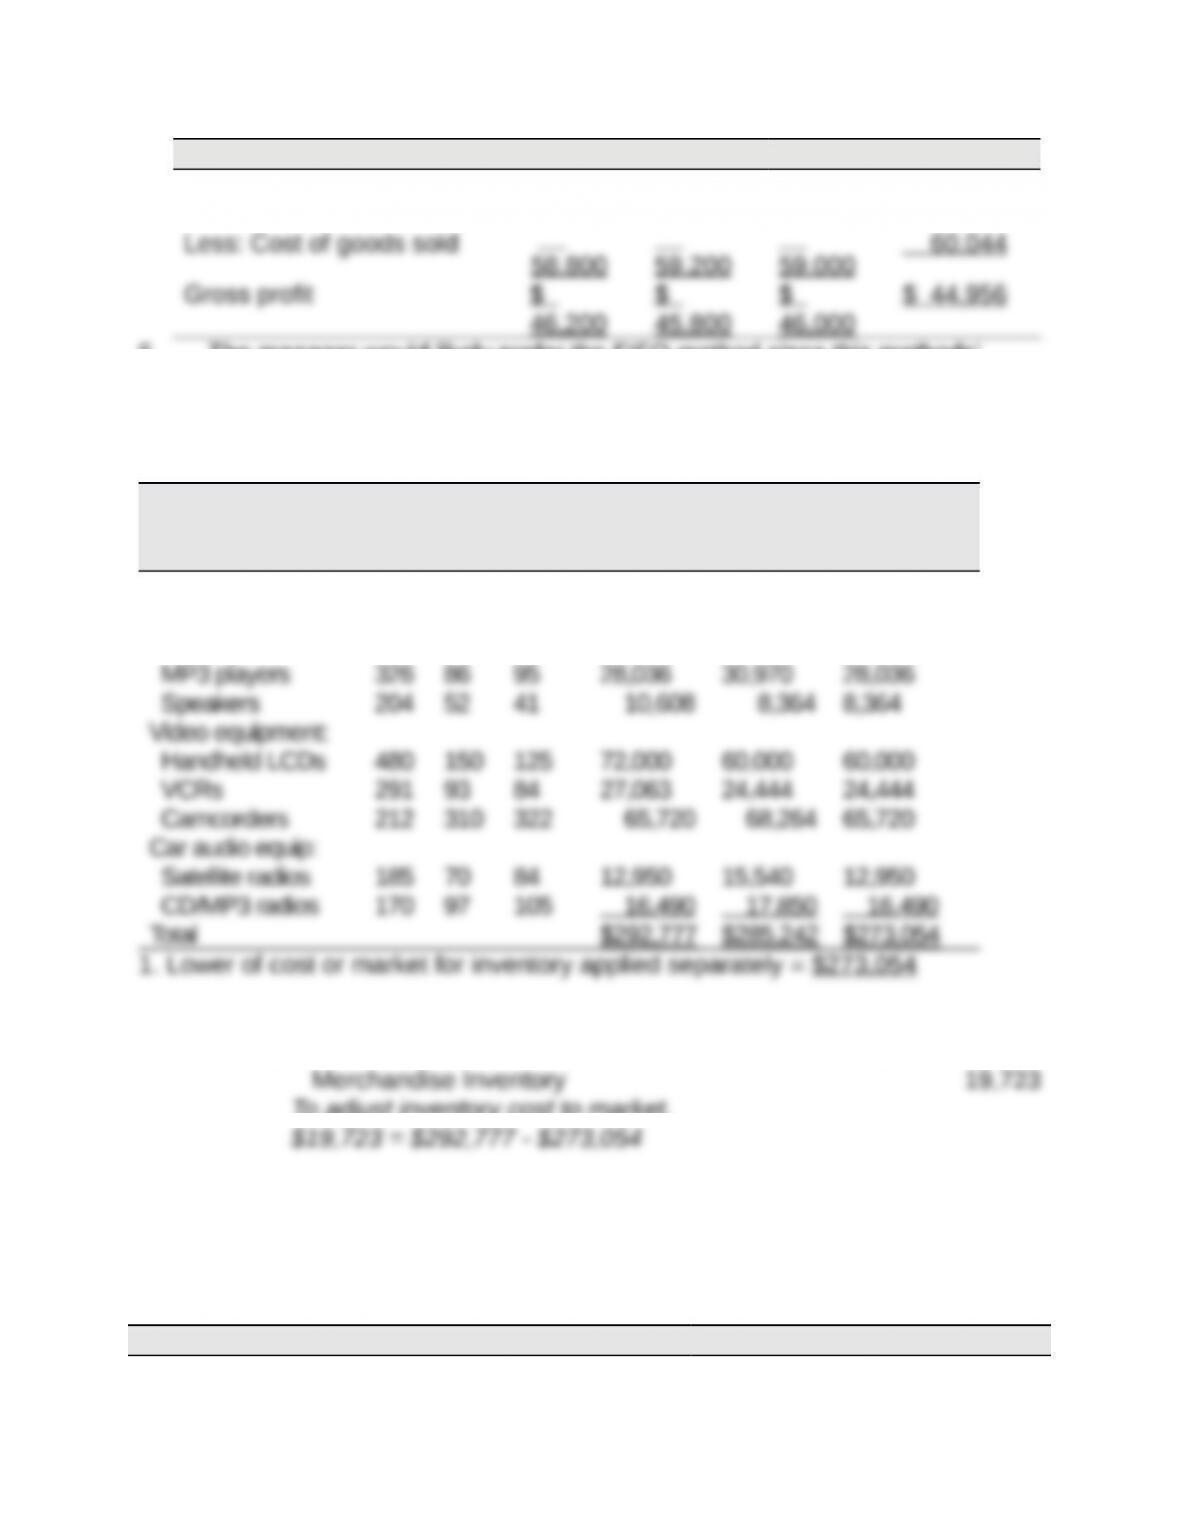
Per Unit Total Total LCM
Applied
to Items
Inventory Items Unit
s
Cos
t
Marke
tCost Market
Audio equipment:
Receivers 345 $ 90 $ 98 $ 31,050 $ 33,810 $ 31,050
CD players 260 111 100 28,860 26,000 26,000
2.
Dec 31 Cost of Goods Sold 19,723
To adjust inventory cost to market.
Title: Problem 6-6A
QA_Ori:
Part 1
(a)
Cost of goods sold 2012 2013 2014
Reported $ 615,000 $ 957,000 $ 780,000
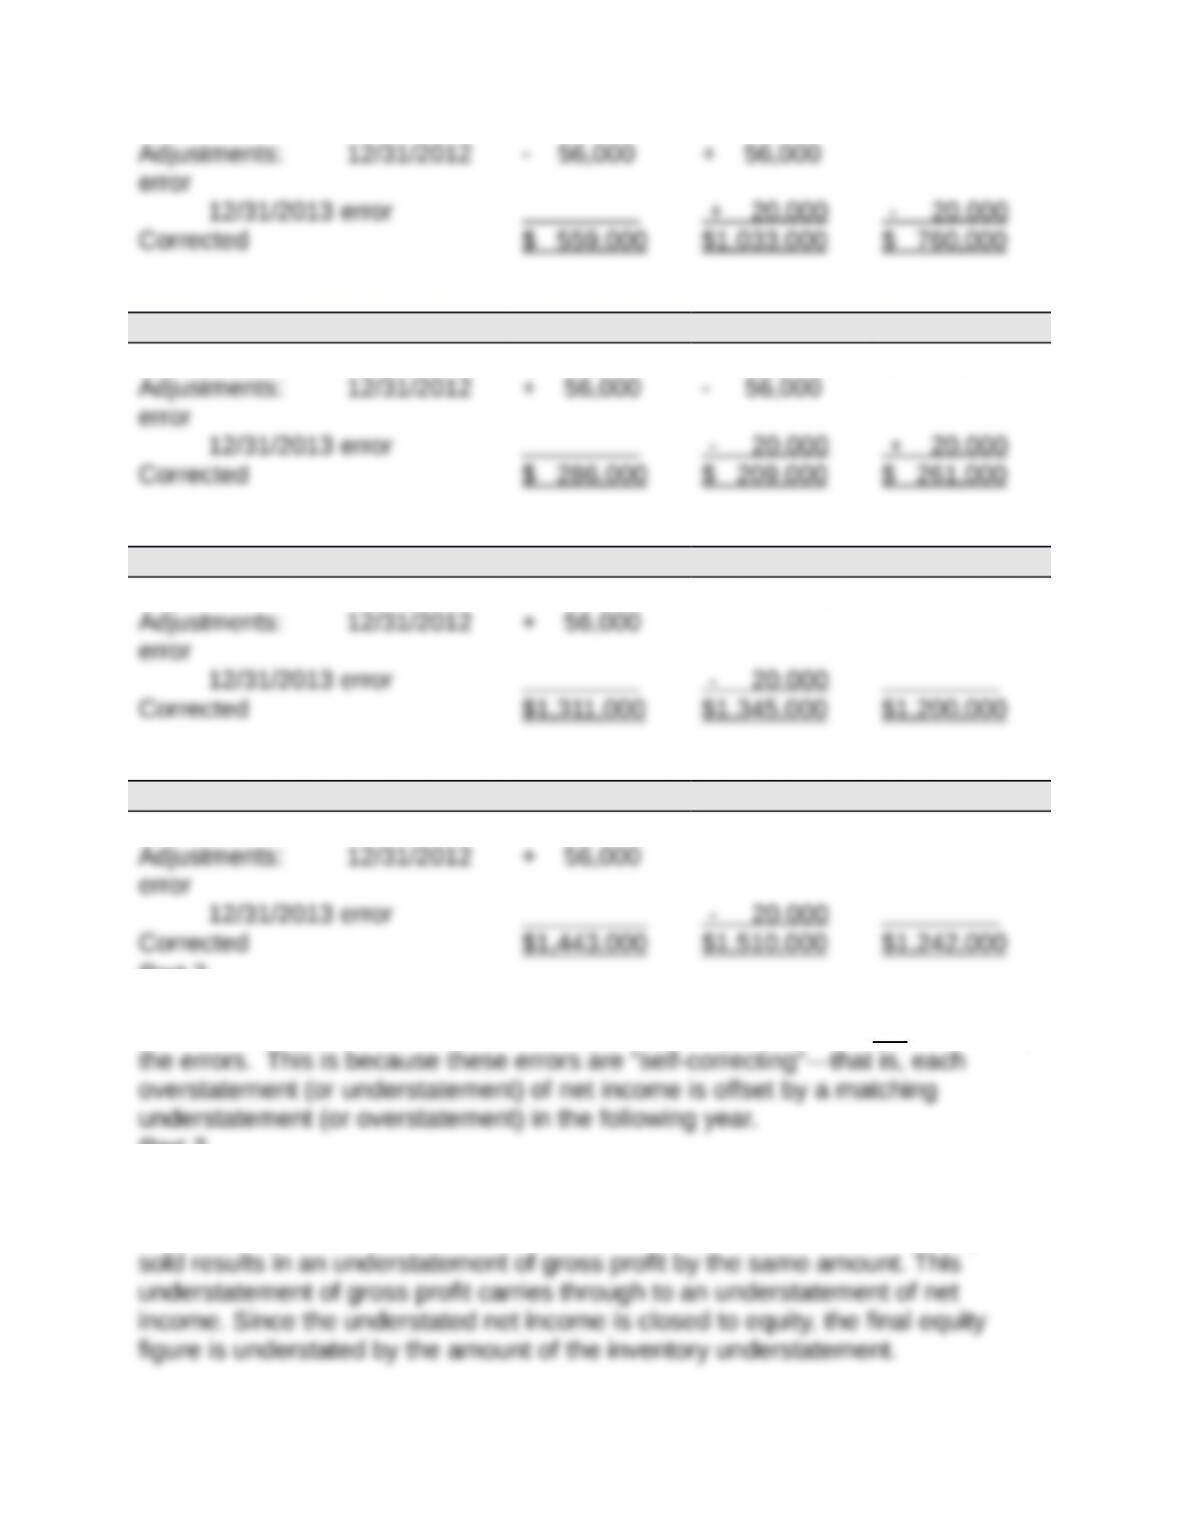
(b)
Net income 2012 2013 2014
Reported $ 230,000 $ 285,000 $ 241,000
(c)
Total current assets 2012 2013 2014
Reported $1,255,000 $1,365,000 $1,200,000
(d)
Equity 2012 2013 2014
Reported $1,387,000 $1,530,000 $1,242,000
Part 2
Total net income for the combined three-year period ($756,000) is not affected by
Part 3
The understatement of inventory by $56,000 results in an overstatement of cost
of goods sold by that same amount. The $56,000 overstatement of cost of goods
Title: Problem 6-7AA
QA_Ori:
Part 1
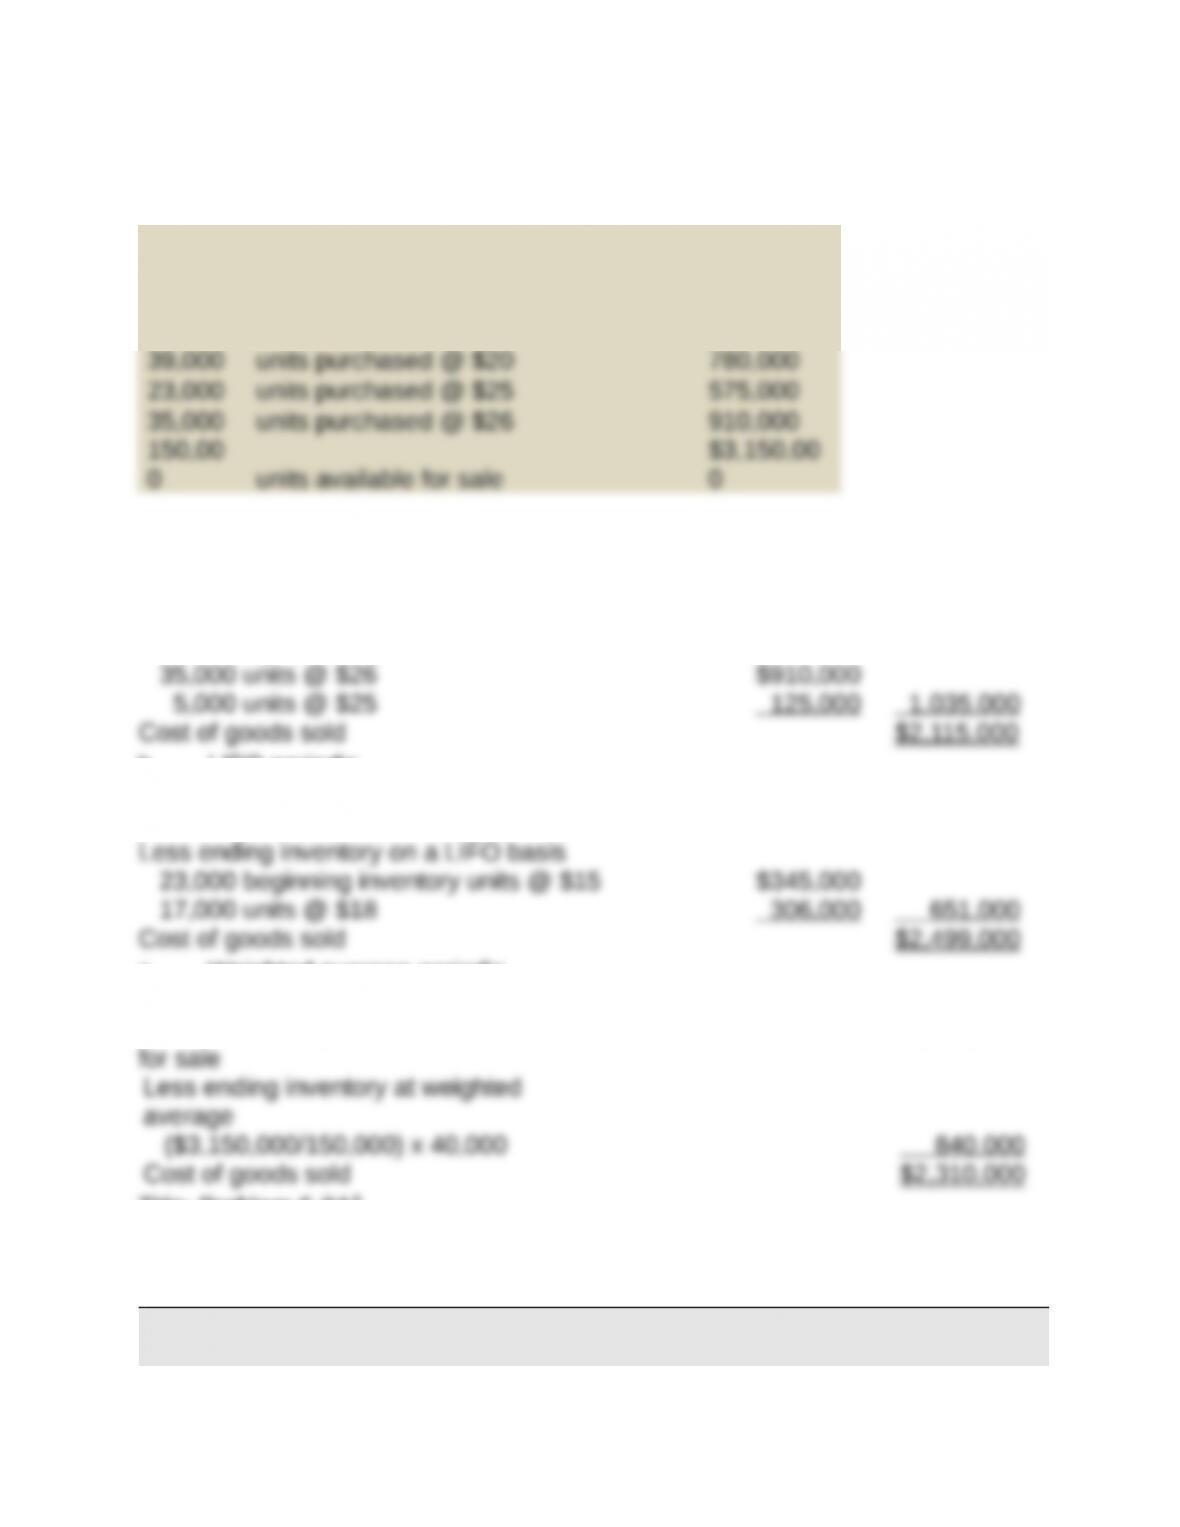
Number and total cost of units available for
sale
23,000 units in beginning inventory @ $15 $345,000
30,000 units purchased @ $18 540,000
Part 2
a. FIFO periodic
Total cost of 150,000 units available for sale $3,150,000
Less ending inventory on a FIFO basis
b. LIFO periodic
Total cost of 150,000 units available for sale $3,150,000
c. Weighted average periodic
Total cost of 150,000 units available
$3,150,000
Title: Problem 6-8AA
QA_Ori:
Part 1
QP CORP.
Income Statements Comparing FIFO, LIFO, and Weighted Average
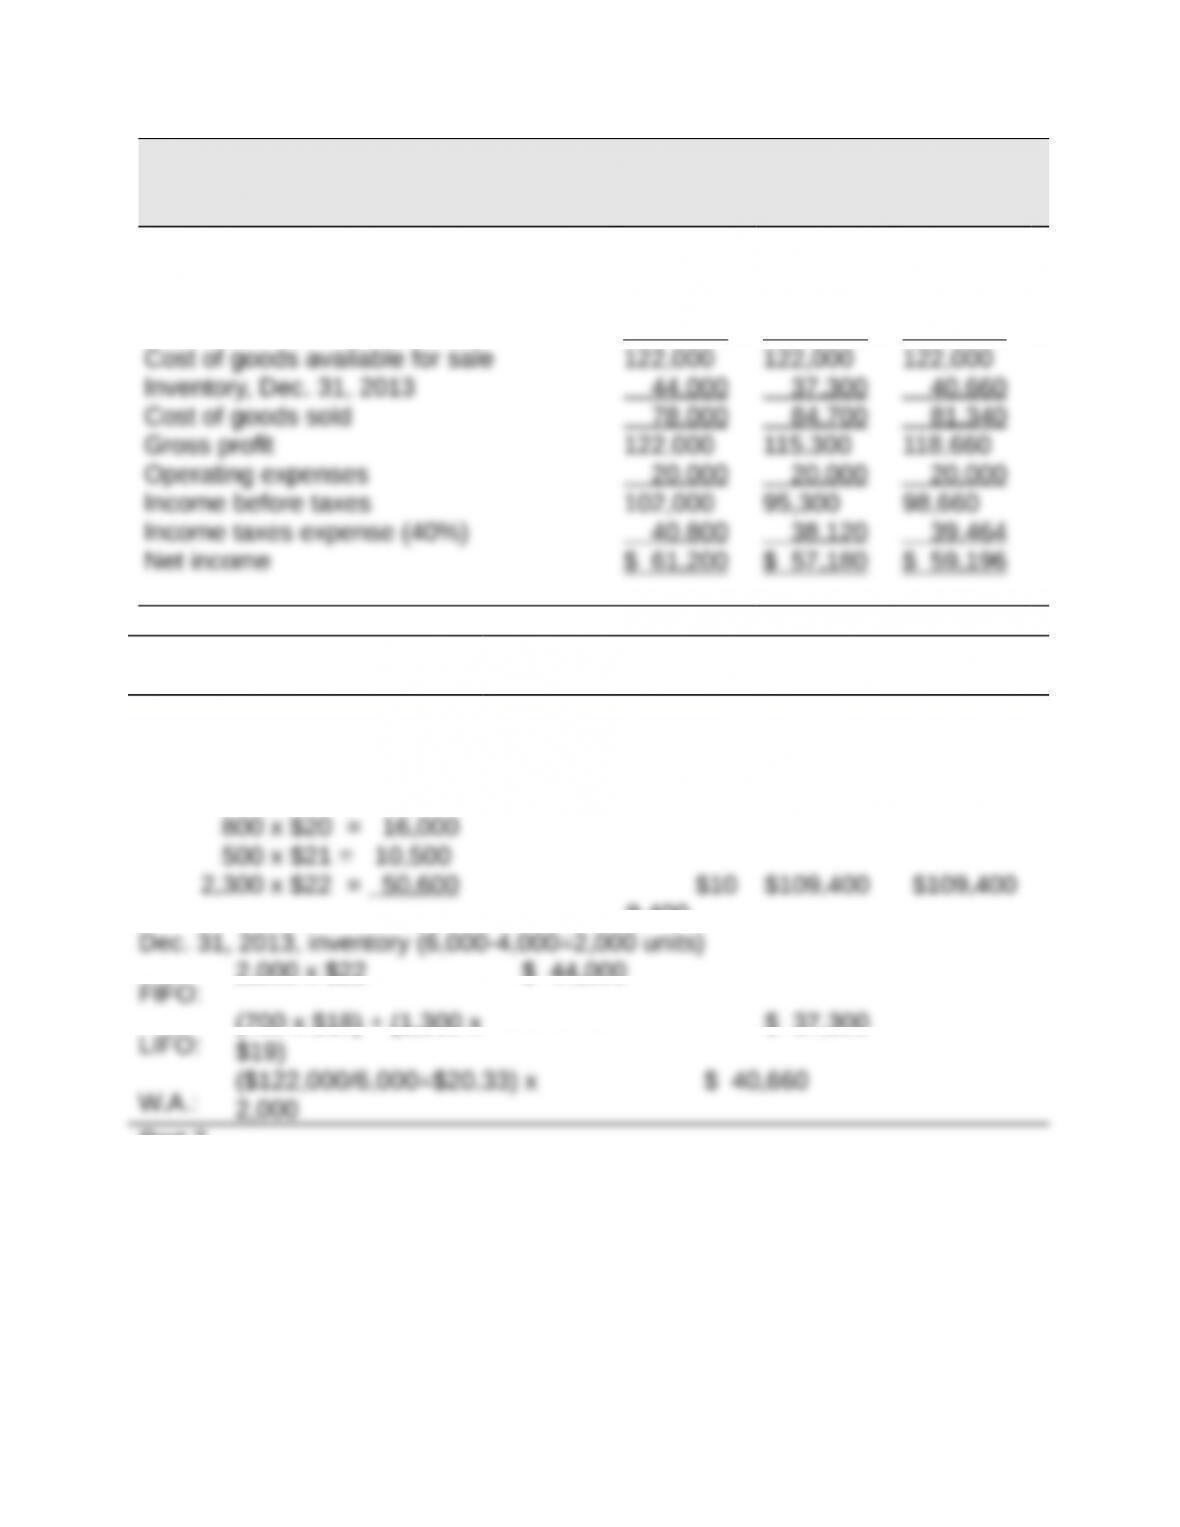
For Year Ended December 31, 2013
FIFO LIFO
Weighted
Average
Sales $200,000 $200,000 $200,000
Cost of goods sold
Inventory, Dec. 31, 2012 12,600 12,600 12,600
Cost of purchases 109,400 109,400 109,400
Supporting calculations FIFO LIFO
Weighted
Average
Dec. 31, 2012, inventory (700 x $18). $
12,600
$
12,600
$ 12,600
Purchases
1,700 x $19 = $32,300
$ 37,300
Part 2
If QP Corp. had been experiencing declining costs in the acquisition of inventory,
we would observe the opposite results in our comparisons. Specifically, LIFO
would have resulted in a higher ending inventory, lower cost of goods sold, higher
gross profit, and higher net income. FIFO would have resulted in a lower ending
inventory, higher cost of goods sold, lower gross profit, and lower net income.
Part 3
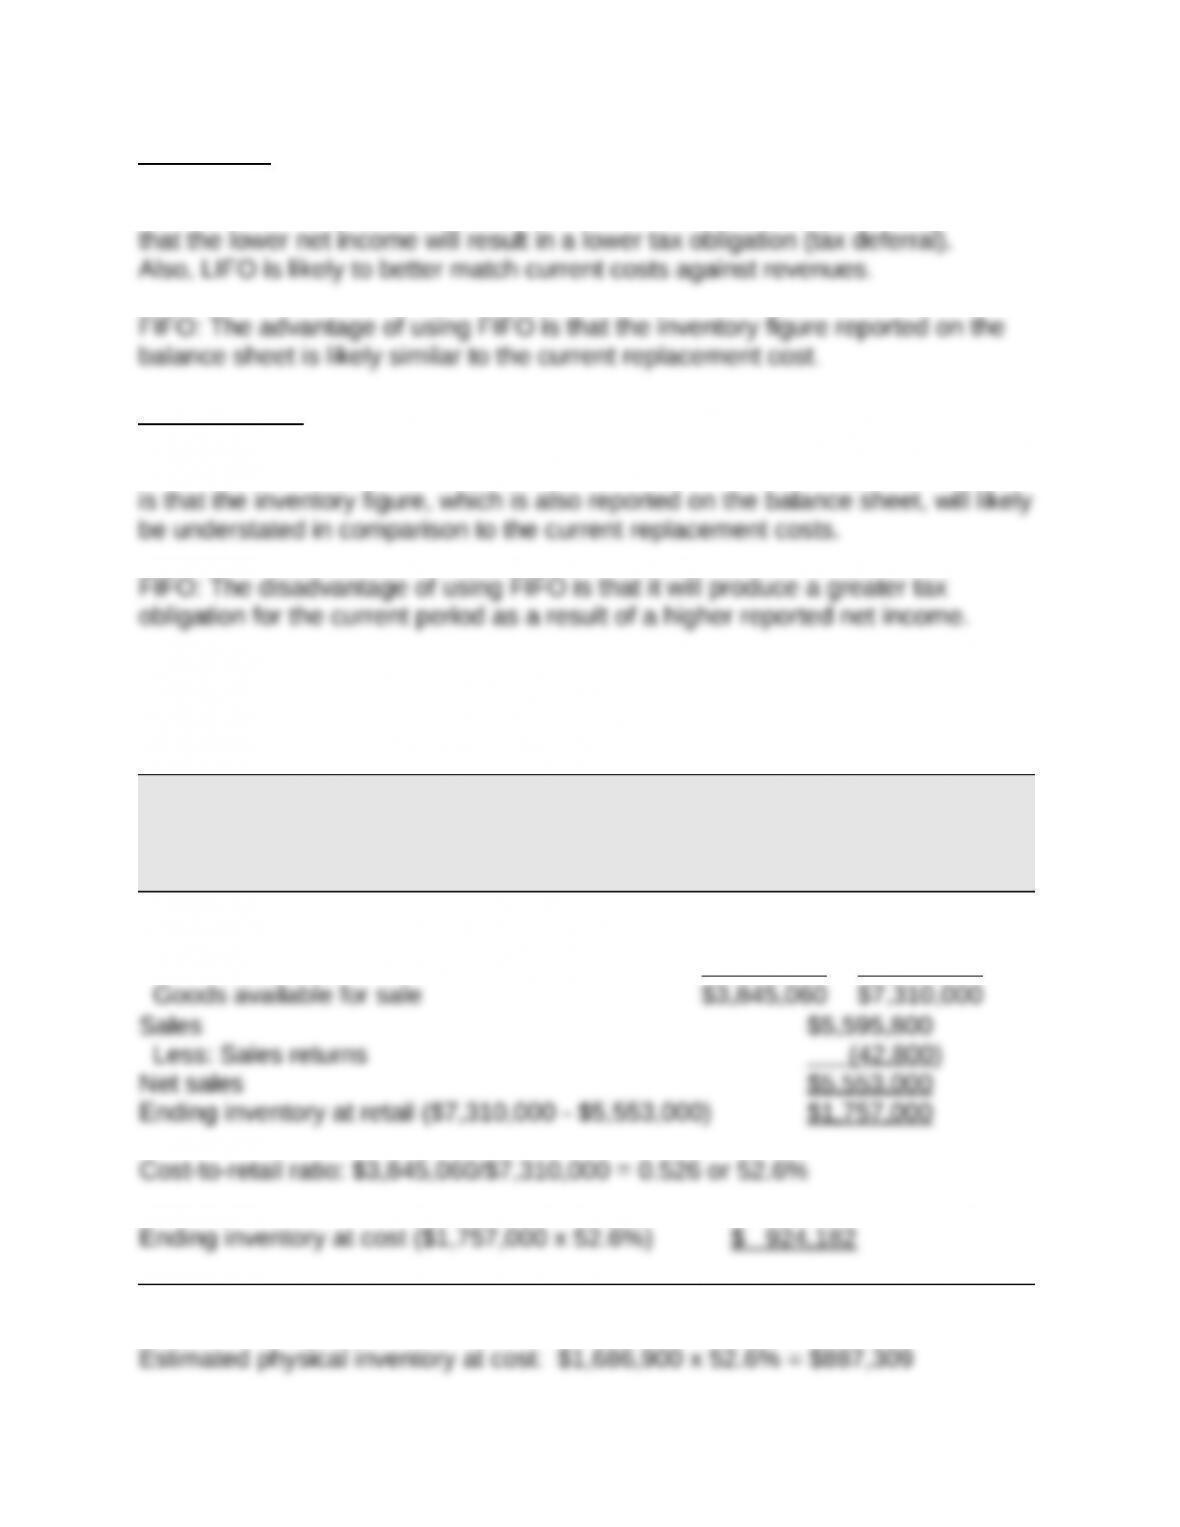
Advantages
LIFO: Given the cost trends in the Title: Problem, the advantage of using LIFO is
Disadvantages
LIFO: Given the cost trends in the Title: Problem, the disadvantage of using LIFO
Title: Problem 6-9AA
QA_Ori:
Part 1
ALASKA COMPANY
Estimated Inventory
December 31
At Cost At Retail
Goods available for sale
Beginning inventory $ 469,010 $ 928,950
Cost of goods purchased 3,376,050 6,381,050
Part 2
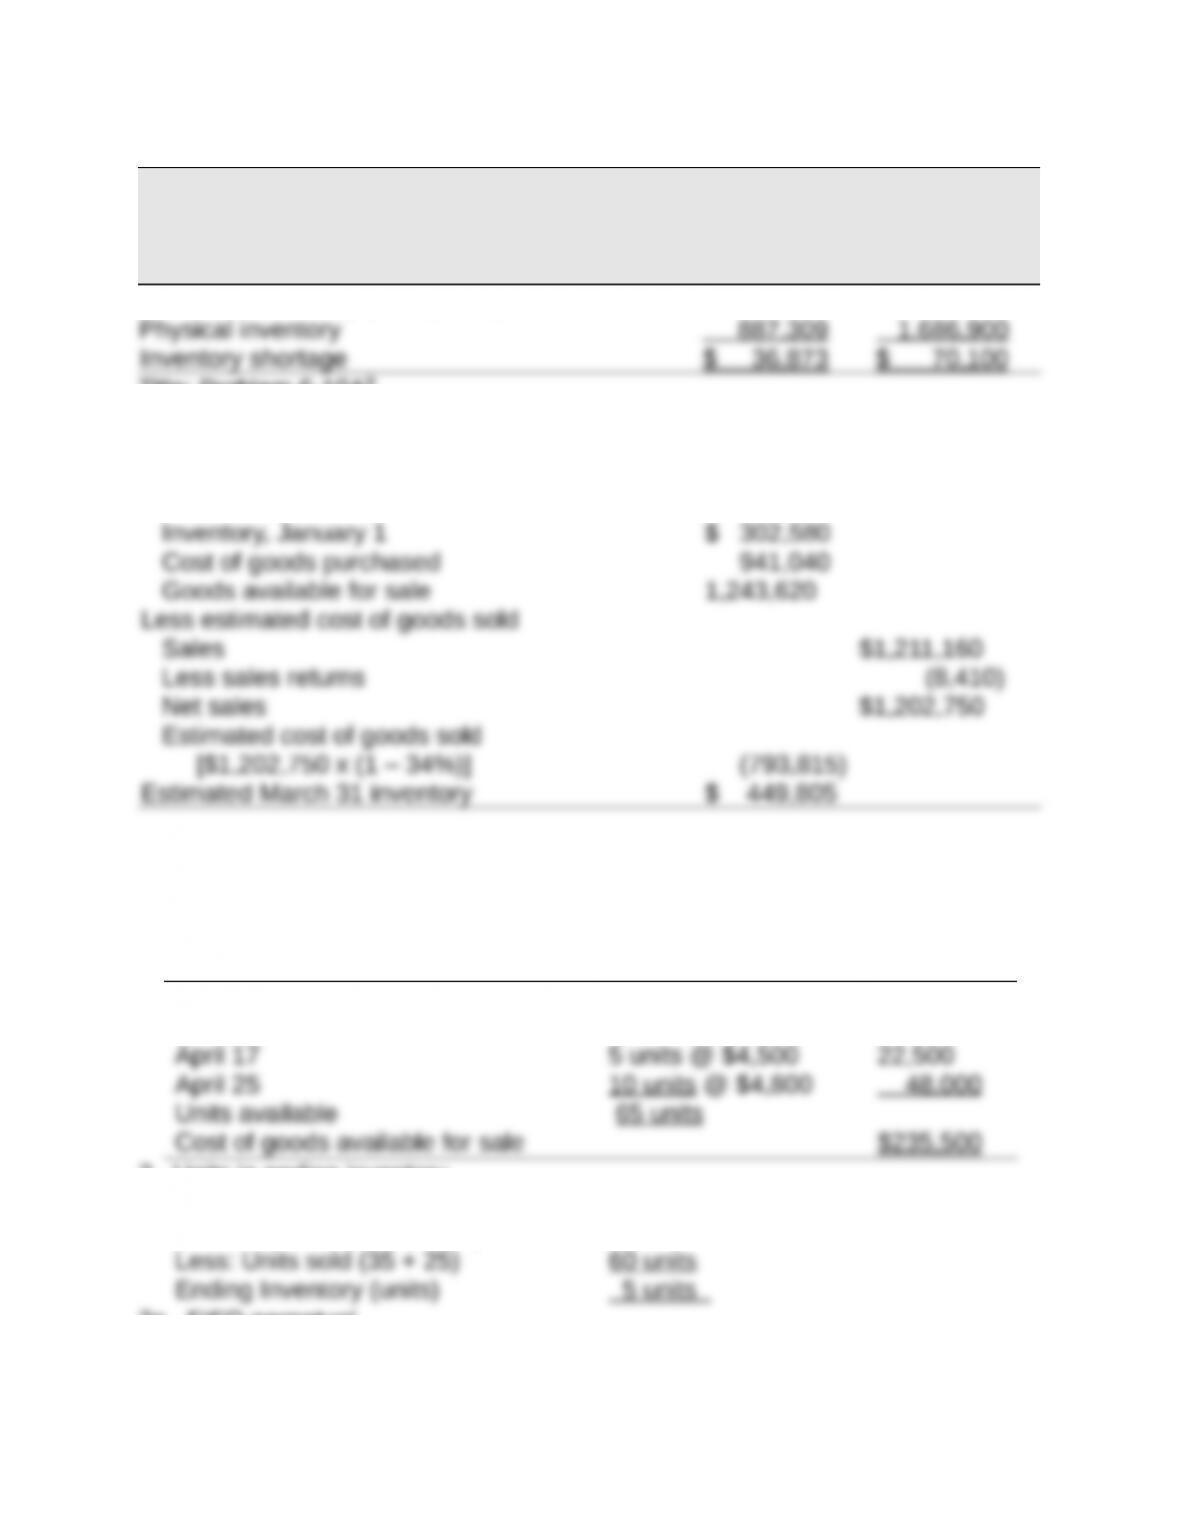
ALASKA COMPANY
Inventory Shortage
December 31
At Cost At Retail
Estimated inventory (from part 1) $ 924,182 $ 1,757,000
Title: Problem 6-10AB
QA_Ori:
WAYWARD COMPANY
Estimated Inventory at March 31
Goods available for sale
Title: Problem 6-1B
QA_Ori:
1. Compute cost of goods available for sale and units available for sale
Beginning inventory 20 units @ $3,000 $ 60,000
April 6 30 units @ $3,500 105,000
2. Units in ending inventory
Units available (from part 1) 65 units
3a. FIFO perpetual
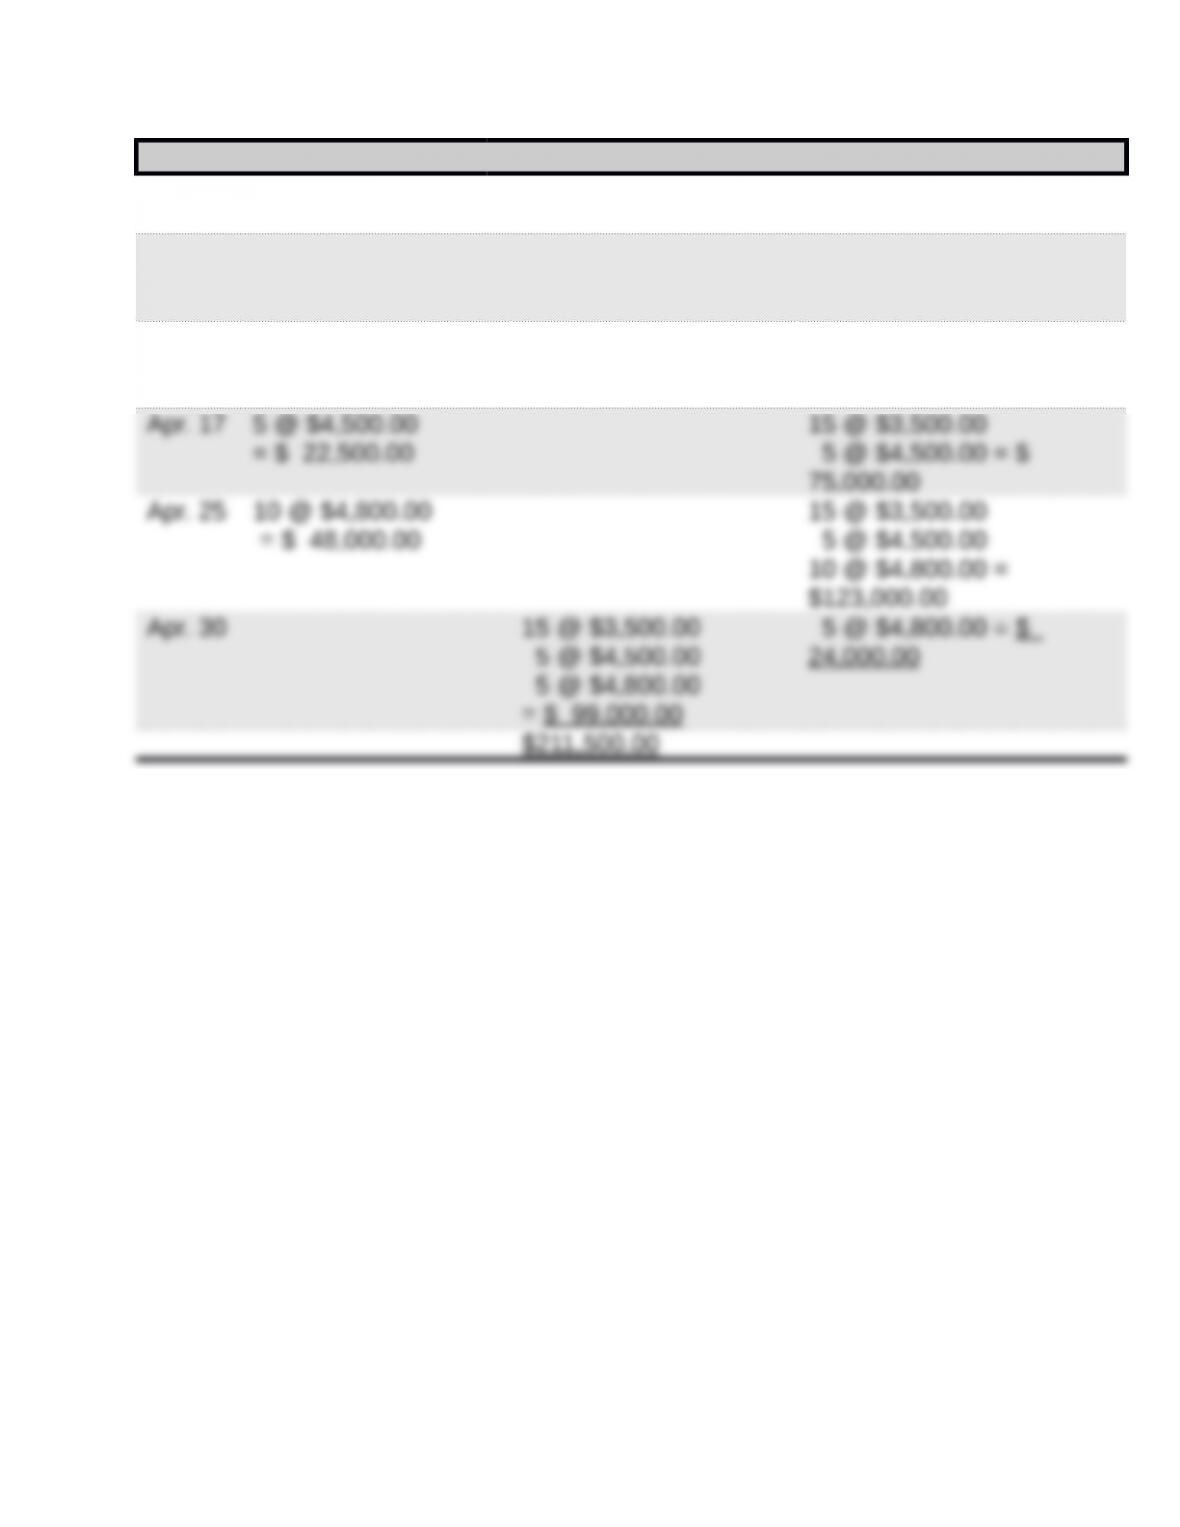
Date Goods Purchased Cost of Goods Sold Inventory Balance
Apr. 1 20 @ $3,000.00 = $
60,000.00
Apr. 6 30 @ $3,500.00
= $105,000.00
20 @ $3,000.00
30 @ $3,500.00 =
$165,000.00
Apr. 9 20 @ $3,000.00
15 @ $3,500.00
= $112,500.00
15 @ $3,500.00 = $
52,500.00
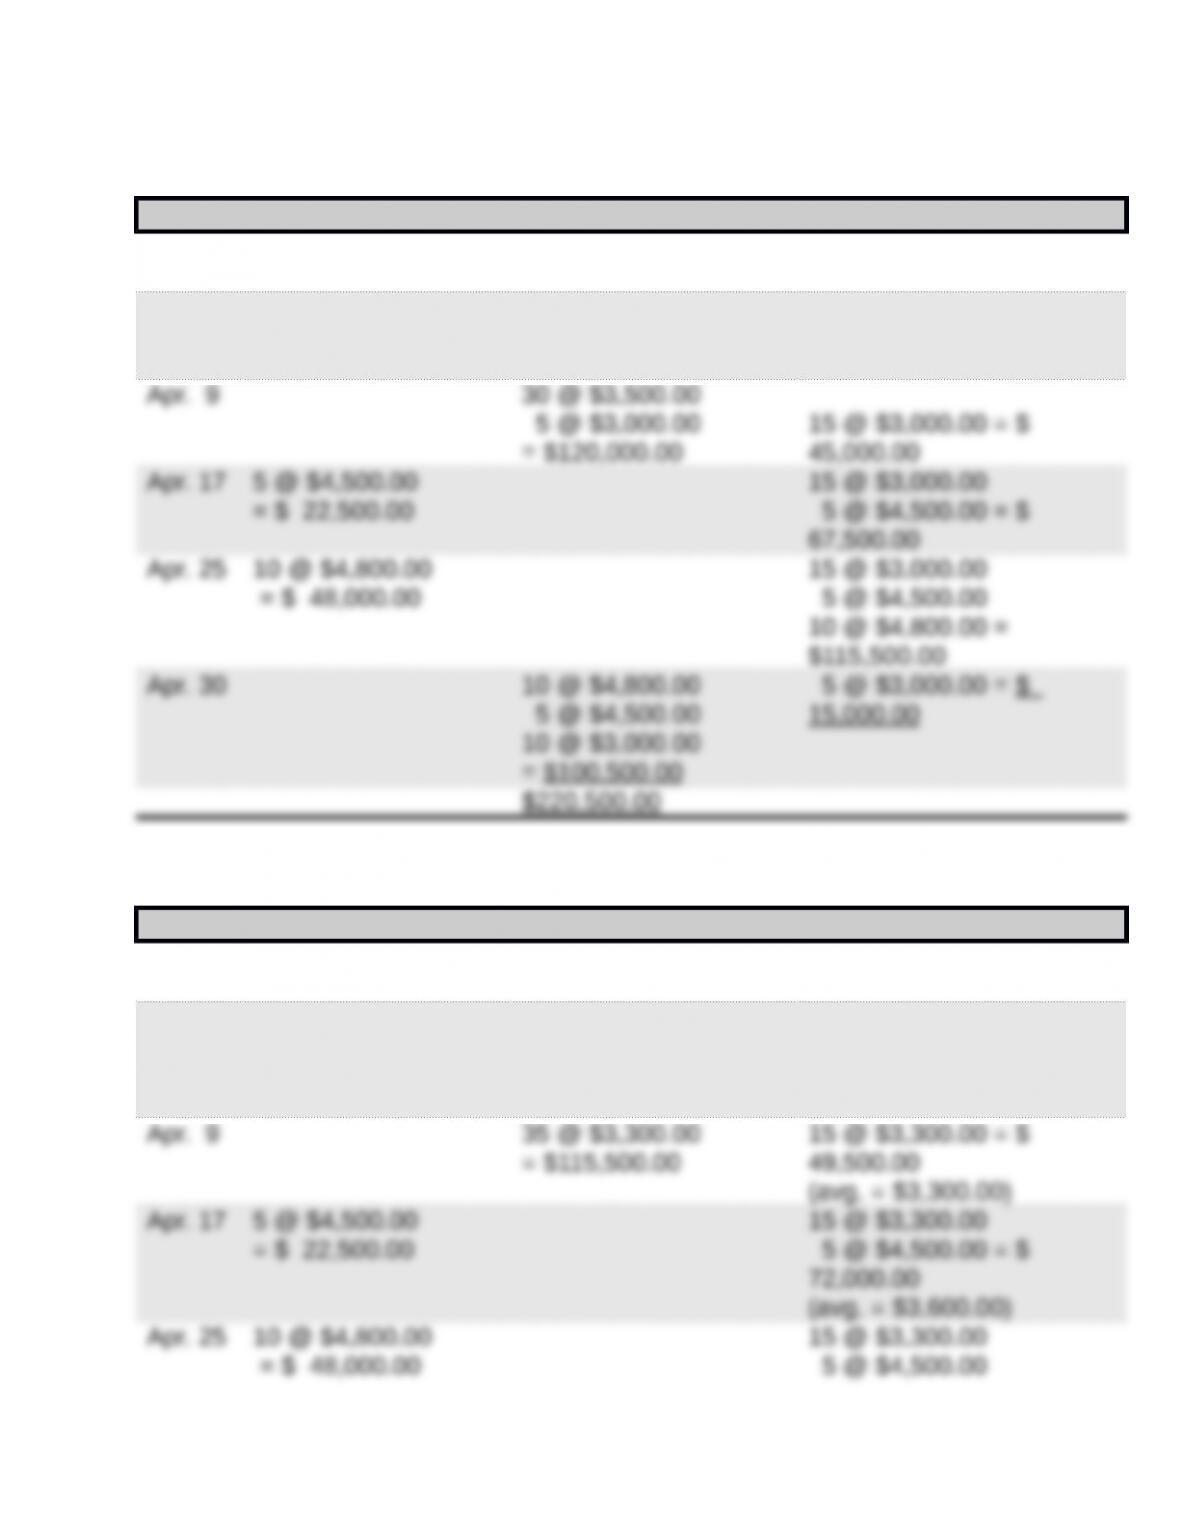
3b. LIFO perpetual
Date Goods Purchased Cost of Goods Sold Inventory Balance
Apr. 1 20 @ $3,000.00 = $
60,000.00
Apr. 6 30 @ $3,500.00
= $105,000.00
20 @ $3,000.00
30 @ $3,500.00 =
$165,000.00
3c. Weighted Average perpetual
Date Goods Purchased Cost of Goods Sold Inventory Balance
Apr. 1 20 @ $3,000.00 = $
60,000.00
Apr. 6 30 @ $3,500.00
= $105,000.00
20 @ $3,000.00
30 @ $3,500.00 =
$165,000.00
(avg. = $3,300.00)
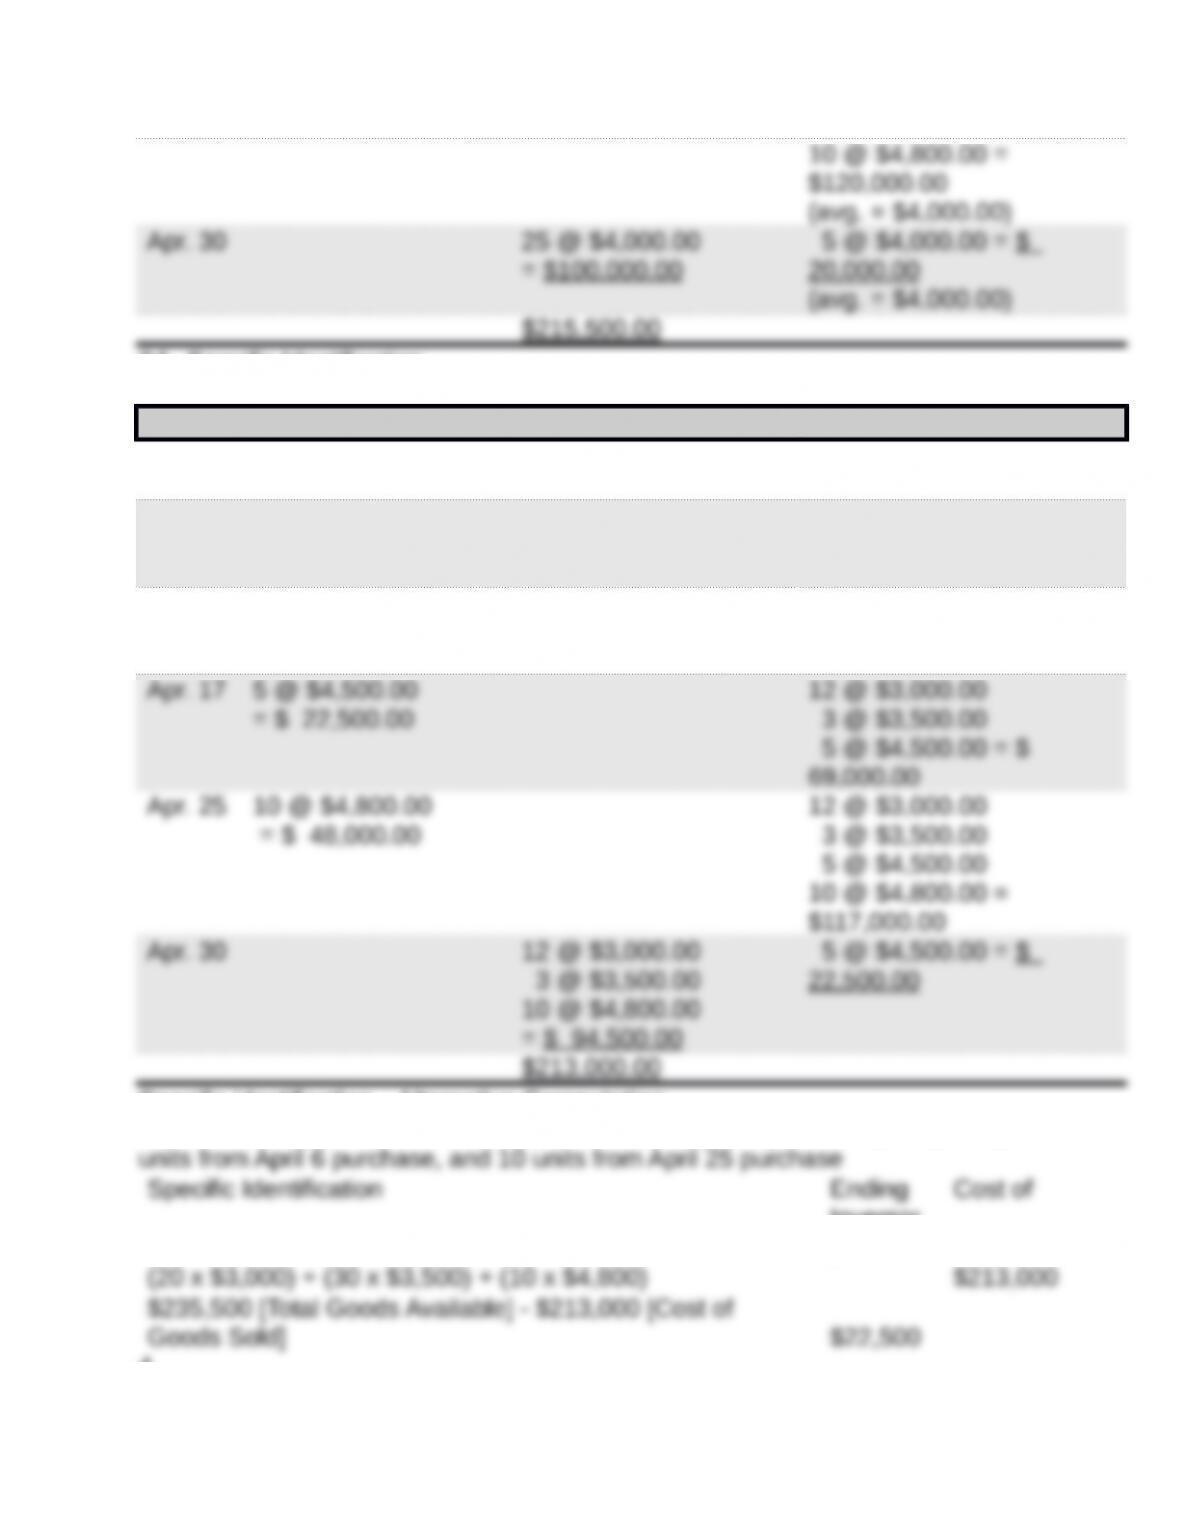
3d. Specific Identification
Date Goods Purchased Cost of Goods Sold Inventory Balance
Apr. 1 20 @ $3,000.00 = $
60,000.00
Apr. 6 30 @ $3,500.00
= $105,000.00
20 @ $3,000.00
30 @ $3,500.00 =
$165,000.00
Apr. 9 8 @ $3,000.00
27 @ $3,500.00
= $118,500.00
12 @ $3,000.00
3 @ $3,500.00 = $
46,500.00
Specific identification—Alternative Computation
Cost of goods sold—20 [8+12] units from beginning inventory, 30 [27+3]
Inventor
y Goods Sold
4.
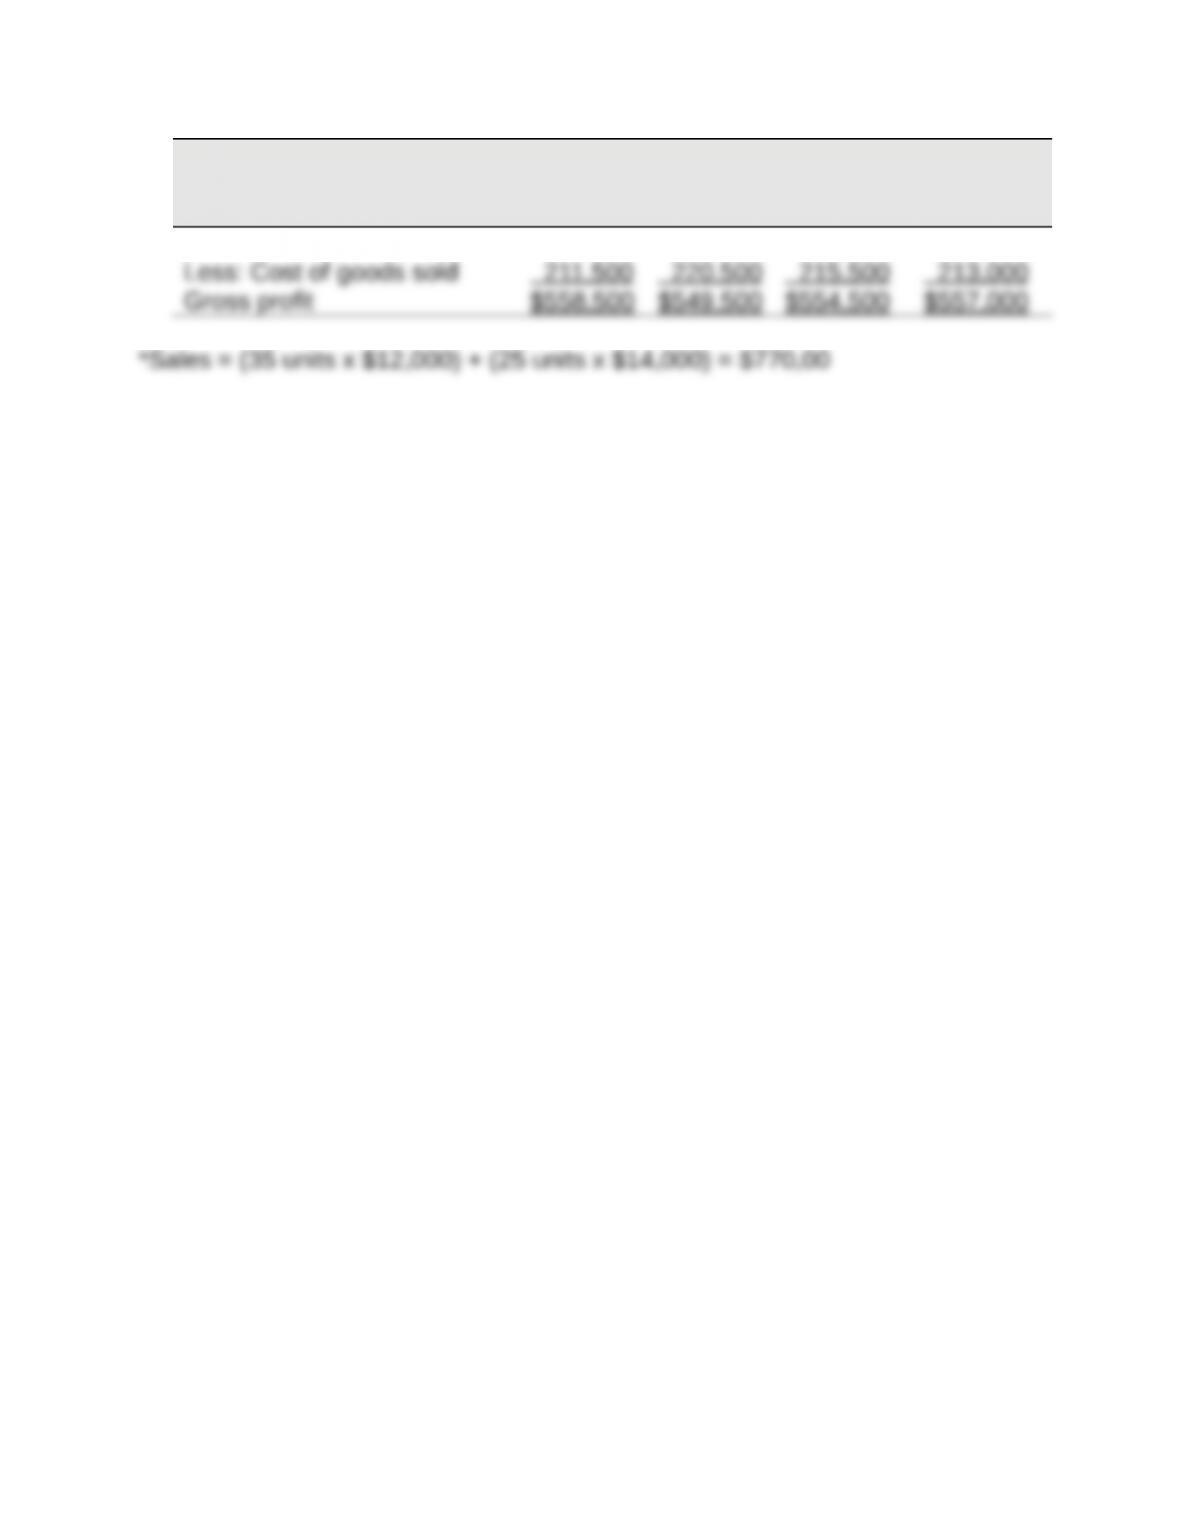
FIFO LIFO
Weighted
Average
Specific
Identifi-cat
ion
Sales* $770,000 $770,000 $770,000 $770,000