Title: Exercise 6-16B
QA_Ori:
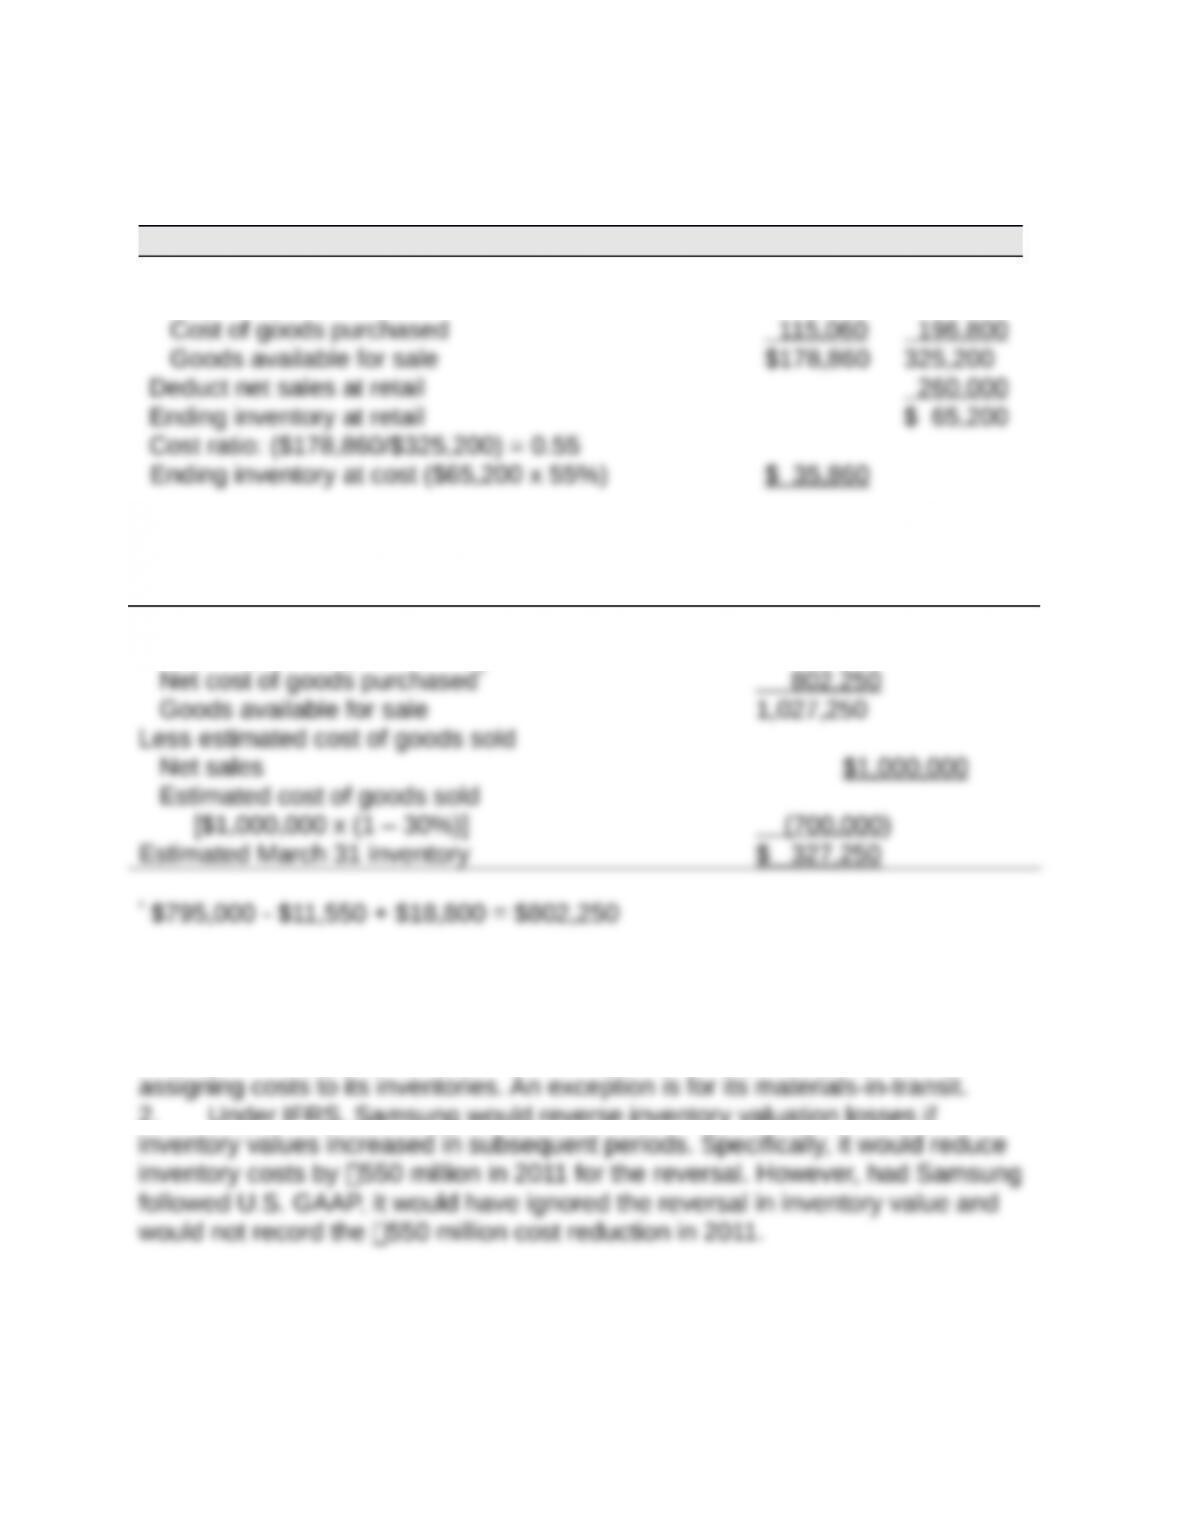
At Cost At Retail
Goods available for sale
Beginning inventory $ 63,800 $128,400
Title: Exercise 6-17B
QA_Ori:
Goods available for sale
Inventory, January 1 $ 225,000
Title: Exercise 6-18
QA_Ori:
1. Samsung generally applies the (weighted) average cost assumption when
2. Under IFRS, Samsung would reverse inventory valuation losses if
Title: Problem 6-1A
QA_Ori:
1. Compute cost of goods available for sale and units available for sale
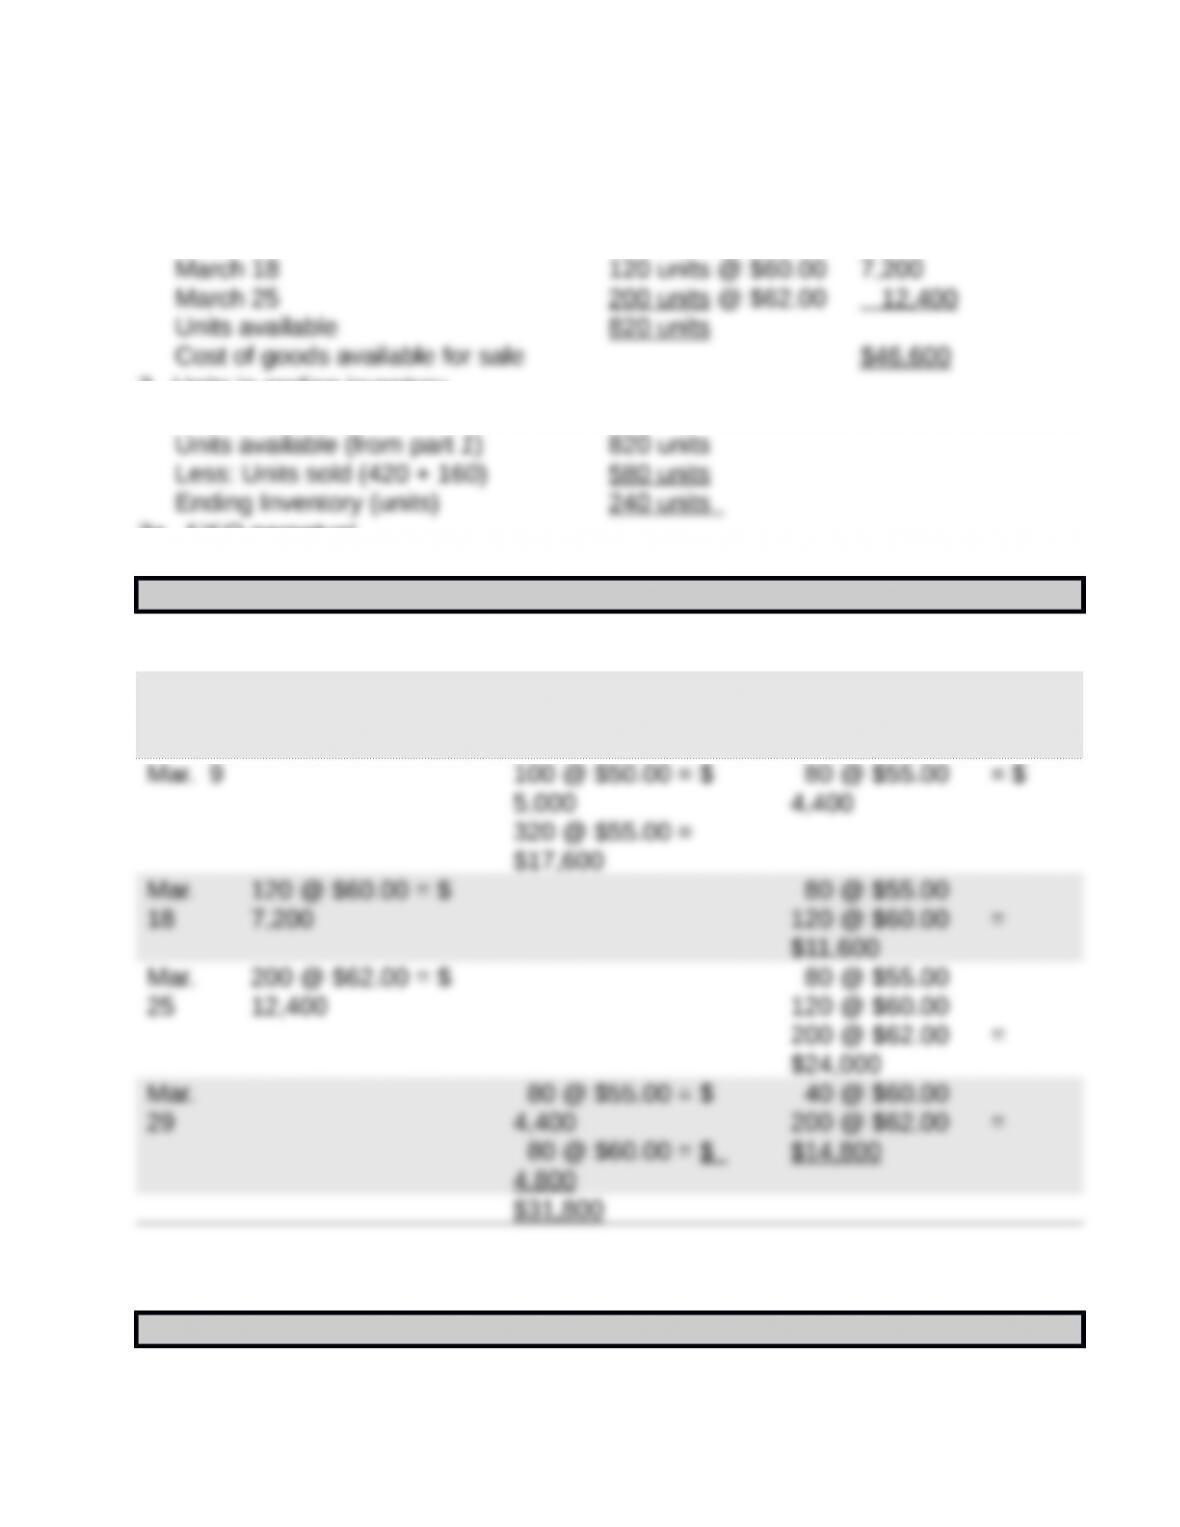
Beginning inventory 100 units @ $50.00 $ 5,000
March 5 400 units @ $55.00 22,000
2. Units in ending inventory
3a. FIFO perpetual
Date Goods Purchased Cost of Goods Sold Inventory Balance
Mar. 1 100 @ $50.00 =
$5,000
Mar. 5 400 @ $55.00 =
$22,000
100 @ $50.00
400 @ $55.00 =
$27,000
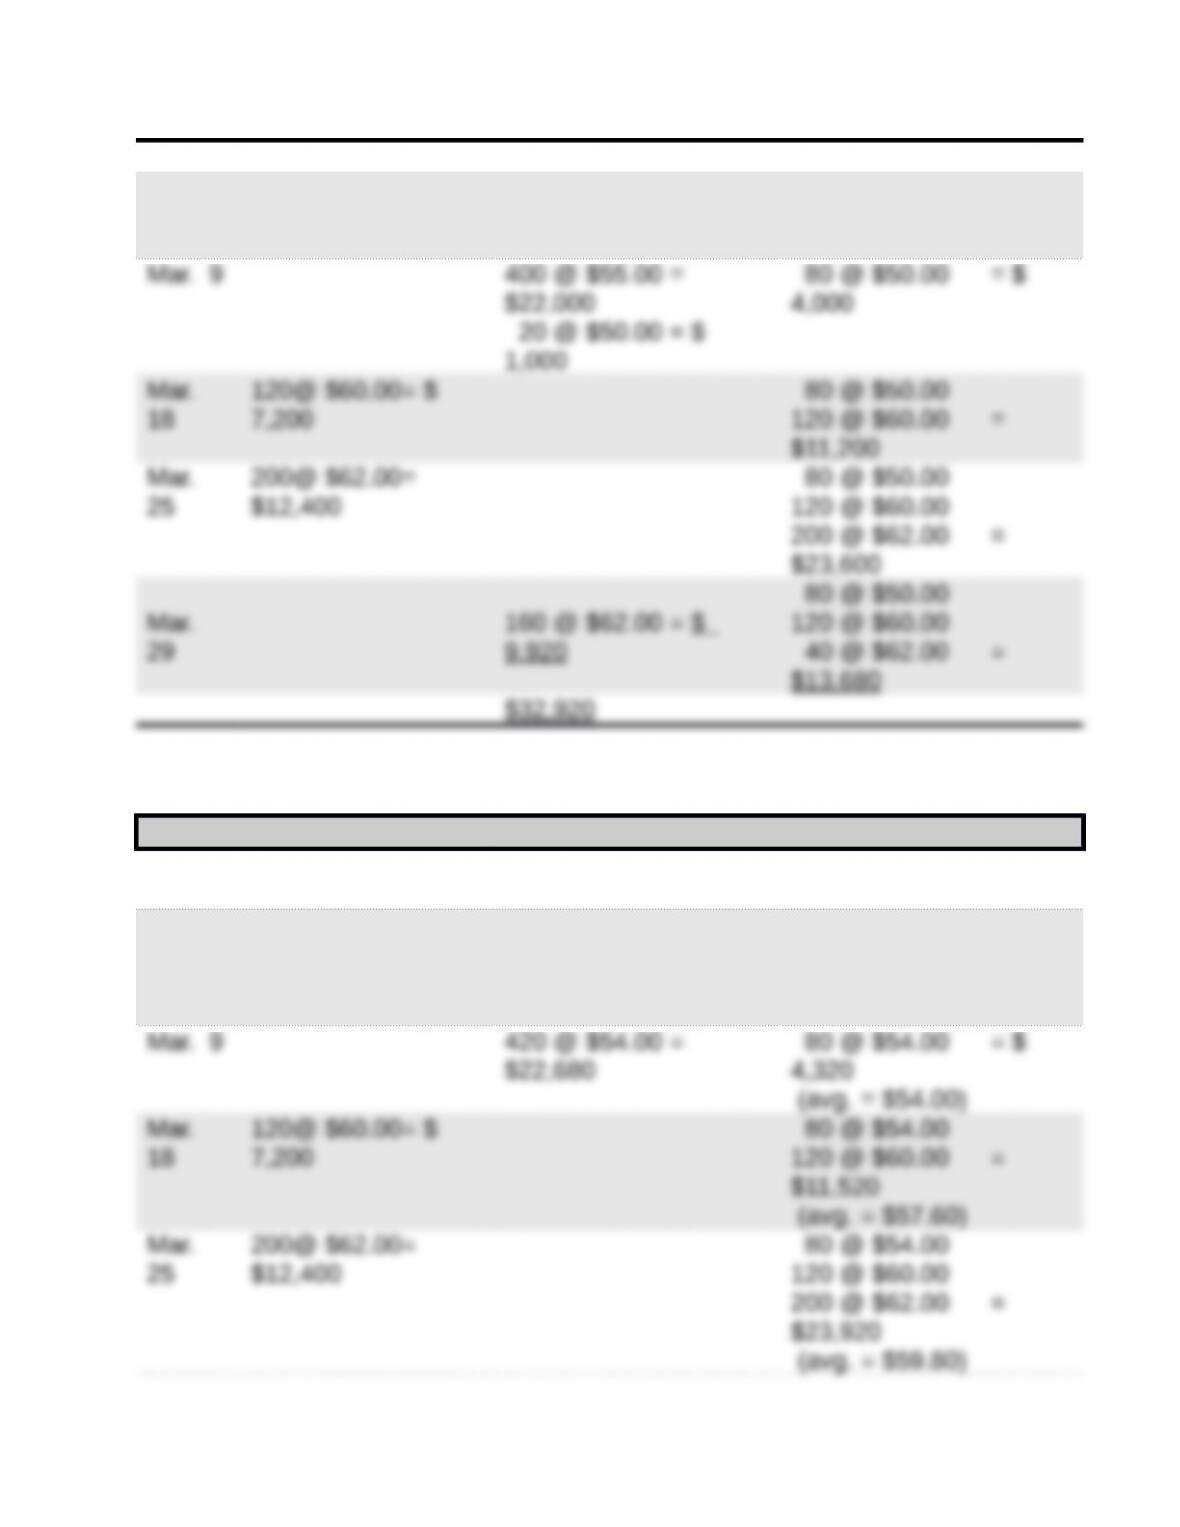
3b. LIFO perpetual
Date Goods Purchased Cost of Goods Sold Inventory Balance
Mar. 1 100 @ $50.00 = $
5,000
Mar. 5 400@ $55.00=
$22,000
100 @ $50.00
400 @ $55.00 =
$27,000
3c. Weighted Average perpetual
Date Goods Purchased Cost of Goods Sold Inventory Balance
Mar. 1 100 @ $50.00 = $
5,000
Mar. 5 400@ $55.00=
$22,000
100 @ $50.00
400 @ $55.00 =
$27,000
(avg. = $54.00)
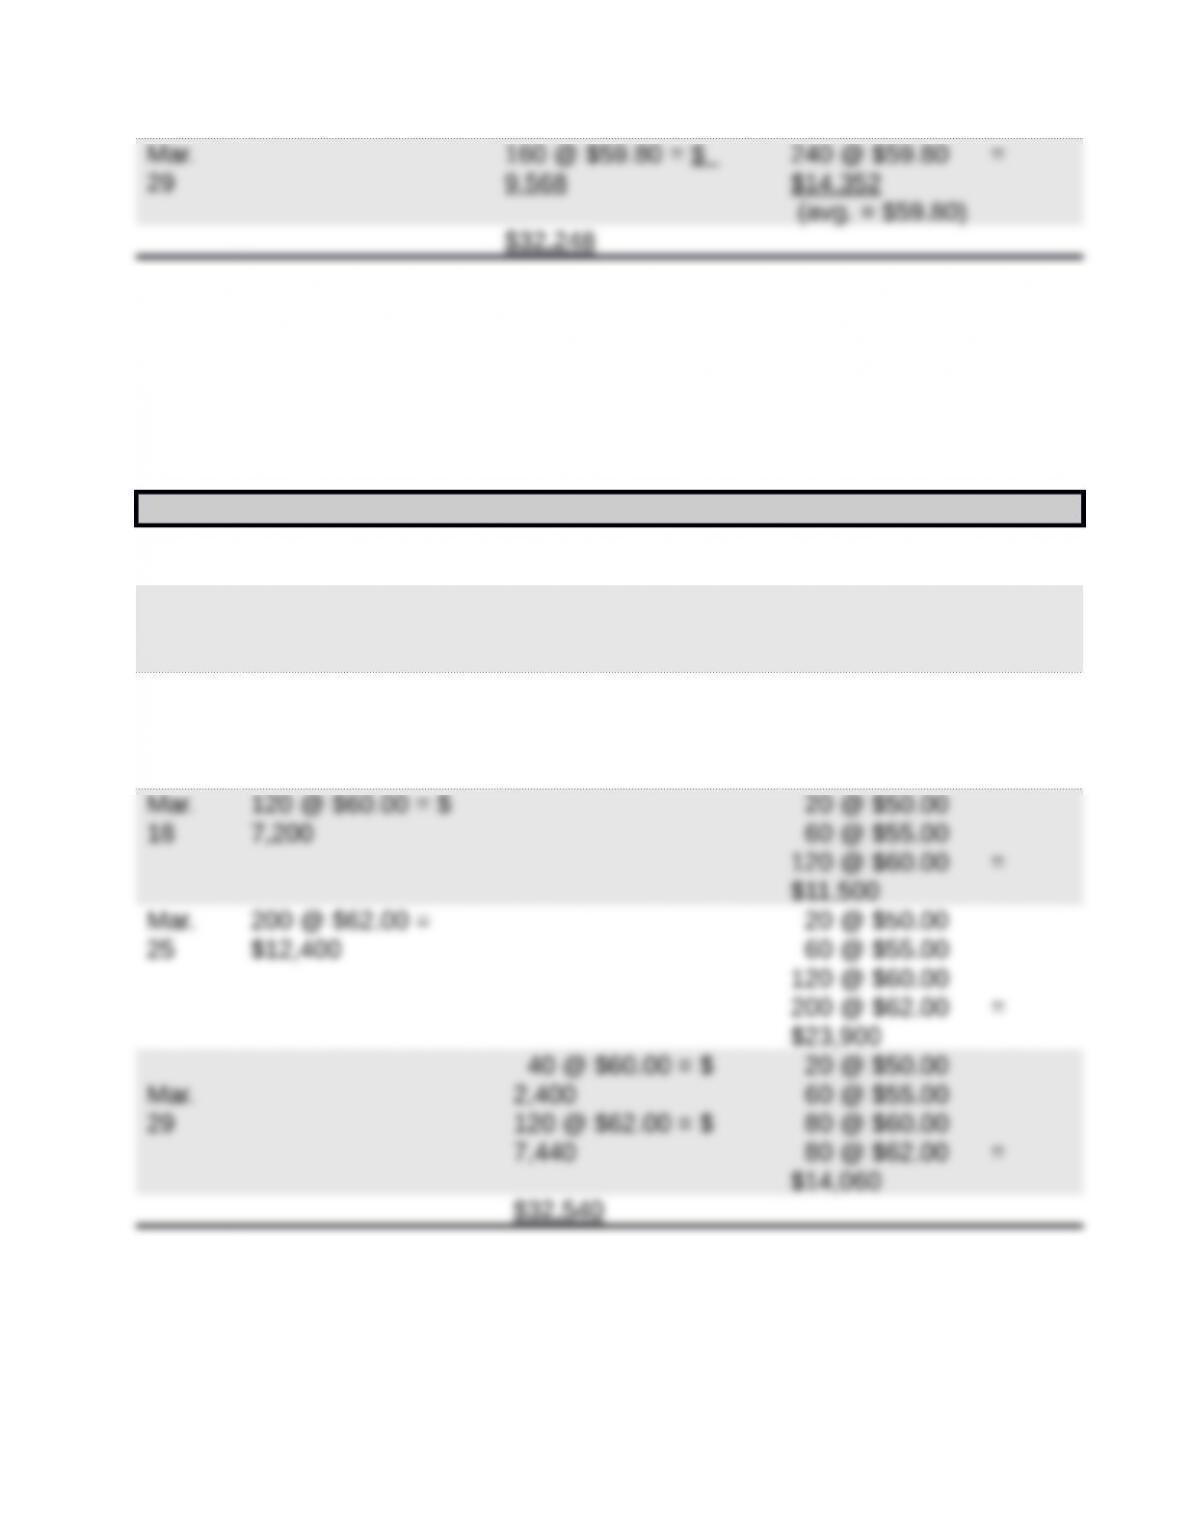
3d. Specific Identification
Date Goods Purchased Cost of Goods Sold Inventory Balance
Mar. 1 100 @ $50.00 = $
5,000
Mar. 5 400 @ $55.00 =
$22,000
100 @ $50.00
400 @ $55.00 =
$27,000
Mar. 9 80 @ $50.00 = $
4,000
340 @ $55.00 =
$18,700
20 @ $50.00
60 @ $55.00 = $
4,300
Specific identification—Alternative Computation
Cost of goods sold—80 units from beginning inventory, 340 units from
March 5 purchase, 40 units from March 18 purchase, and 120 units from March
25 purchase
Specific Identification Ending Cost of
Inventory Goods Sold
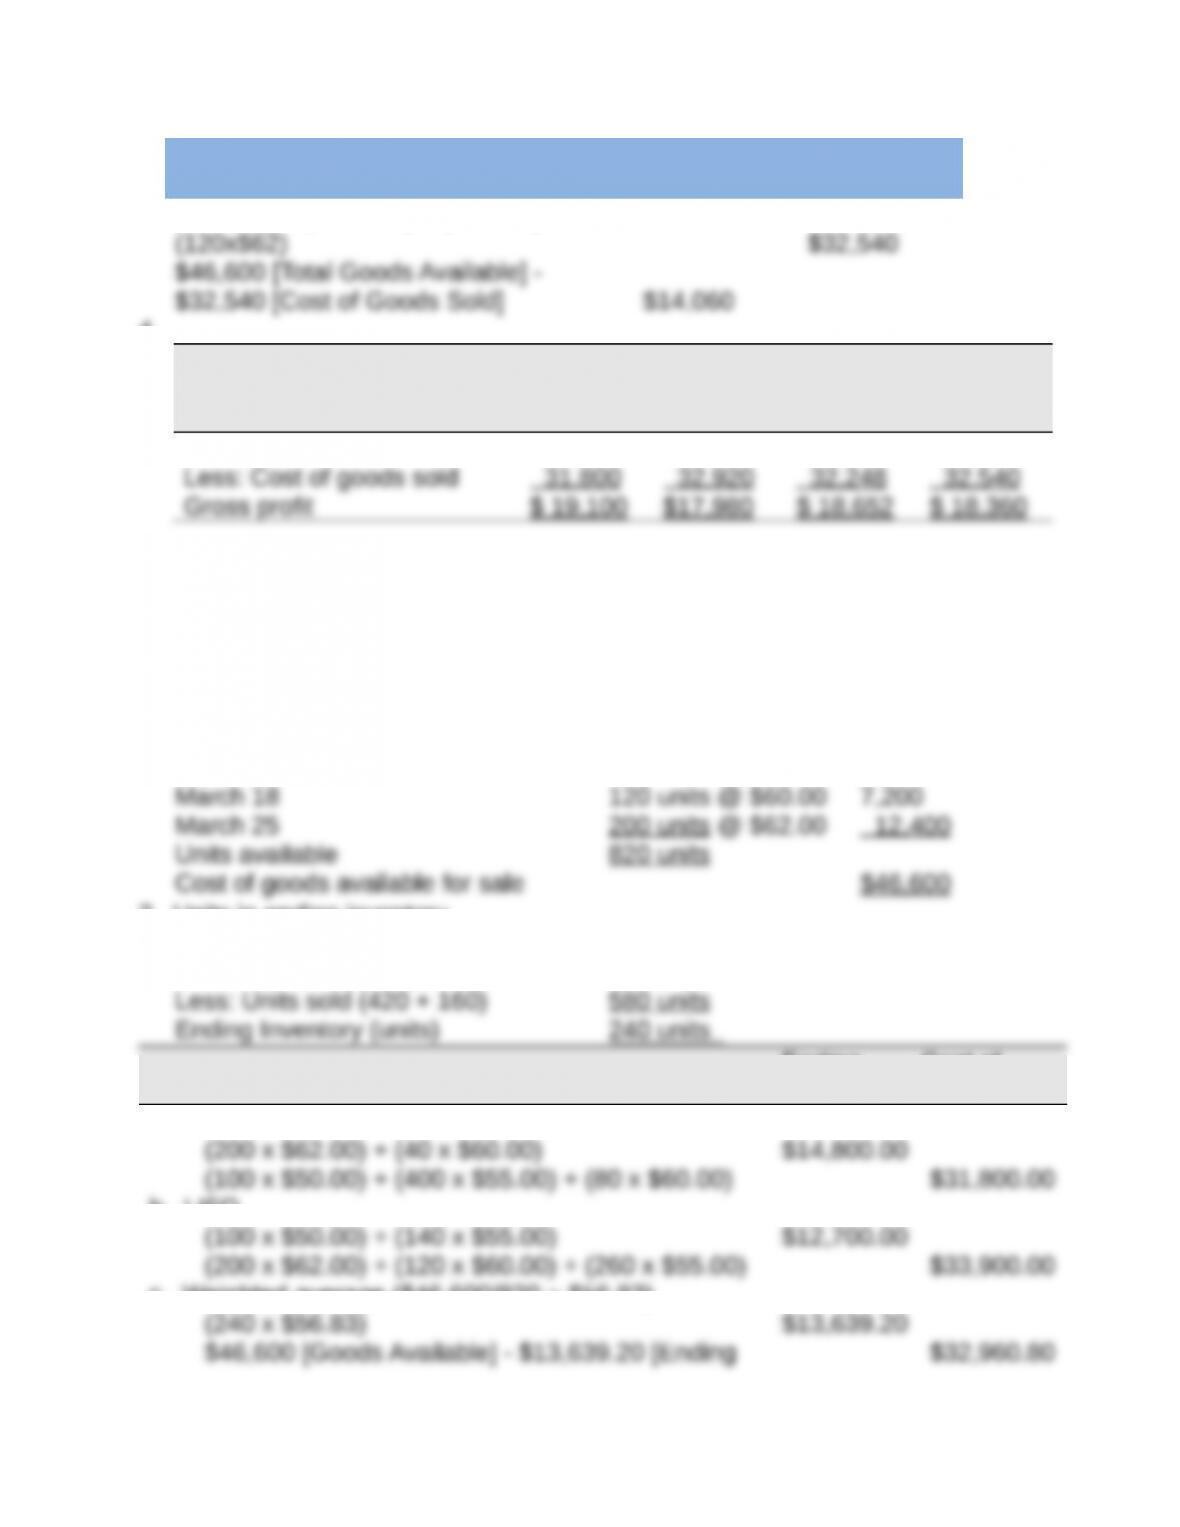
(80x$50) + (340x$55) + (40x$60) +
4.
FIFO LIFO
Weighted
Average
Specific
Identifi-ca
tion
Sales* $50,900 $50,900 $50,900 $50,900
*Sales = (420 units x $85.00) + (160 units x $95.00) = $50,900
Title: Problem 6-2A
QA_Ori:
1. Compute cost of goods available for sale and units available for sale
Beginning inventory 100 units @ $50.00 $ 5,000
March 5 400 units @ $55.00 22,000
2. Units in ending inventory
Units available (from part 1) 820 units
Periodic Inventory
Ending
Inventory
Cost of
Goods Sold
a. FIFO
b. LIFO
c. Weighted average ($46,600/820 = $56.83)
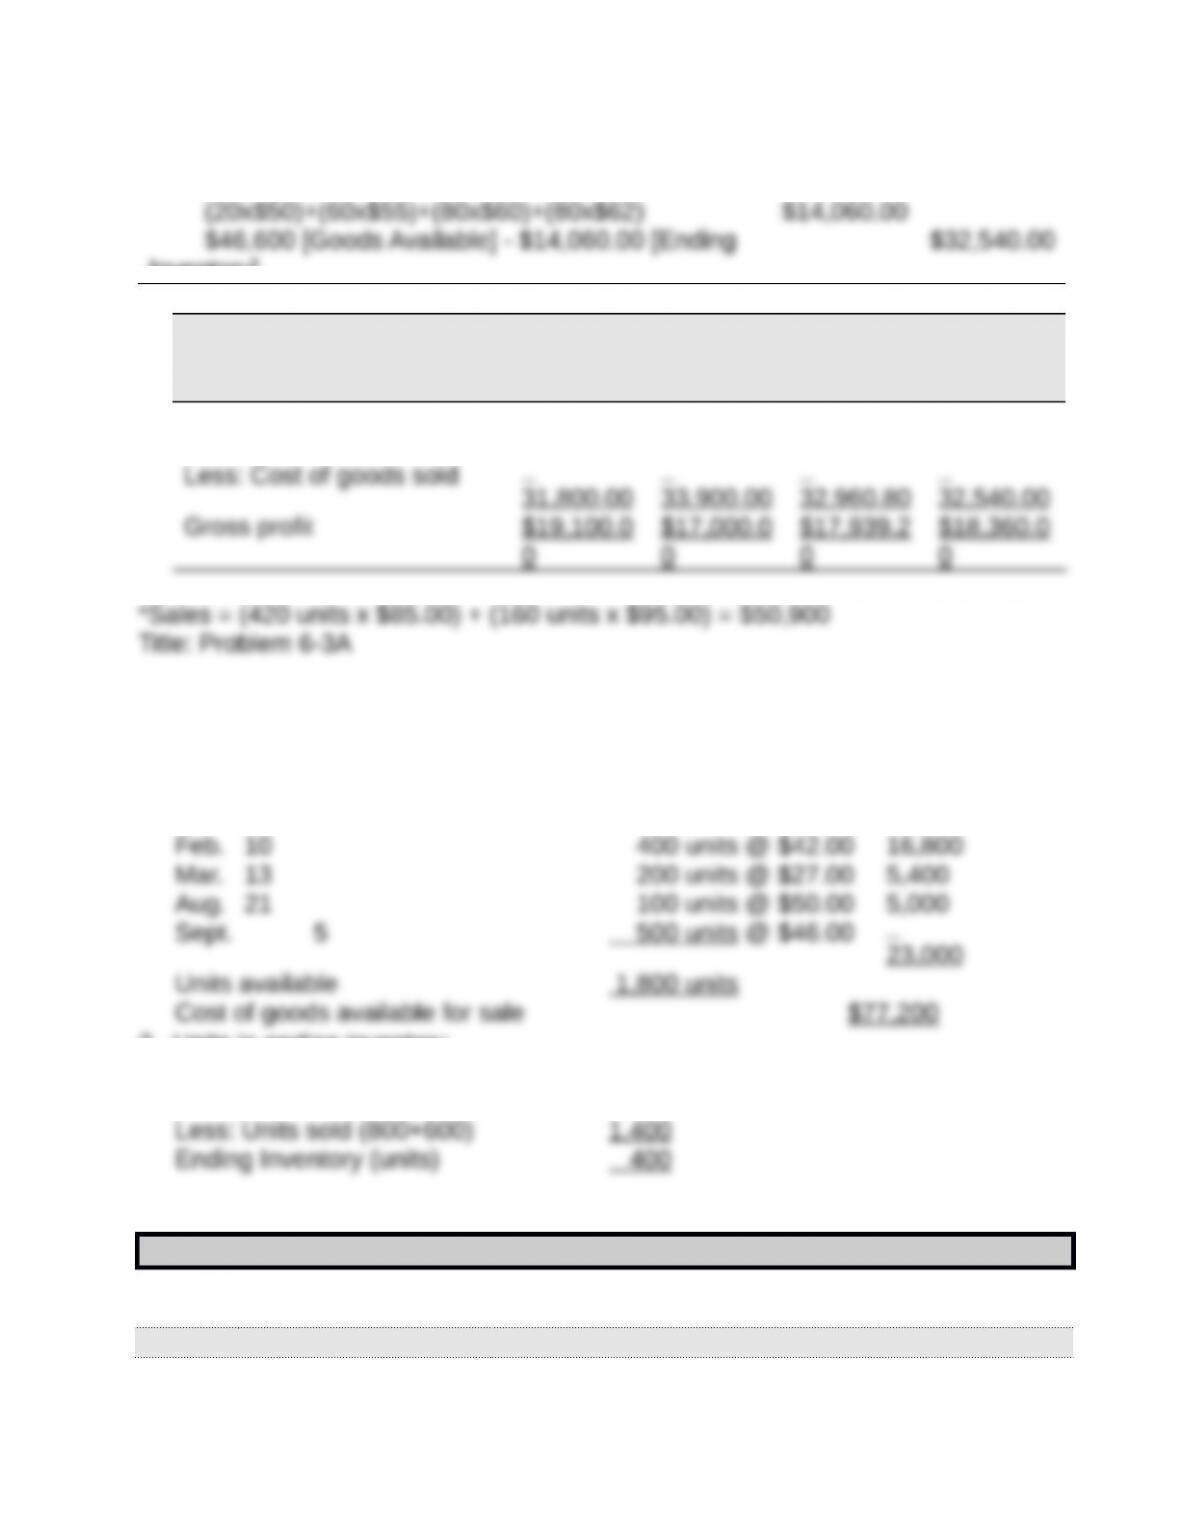
Inventory]
d. Specific identification
Inventory]
4.
FIFO LIFO
Weighted
Average
Specific
Identifi-cat
ion
Sales* $50,900.0
0
$50,900.0
0
$50,900.0
0
$50,900.0
0
QA_Ori:
1. Calculate cost of goods available for sale and units available for sale
Beginning inventory 600 units @ $45.00 $27,00
0
2. Units in ending inventory
Units available (from part 1) 1,800
3a. FIFO perpetual
Date Goods Purchasd Cost of Goods Sold Inventory Balance
1/1 600 @ $45.00 =
$27,000
2/10 400 @ $42.00= 600 @ $45.00
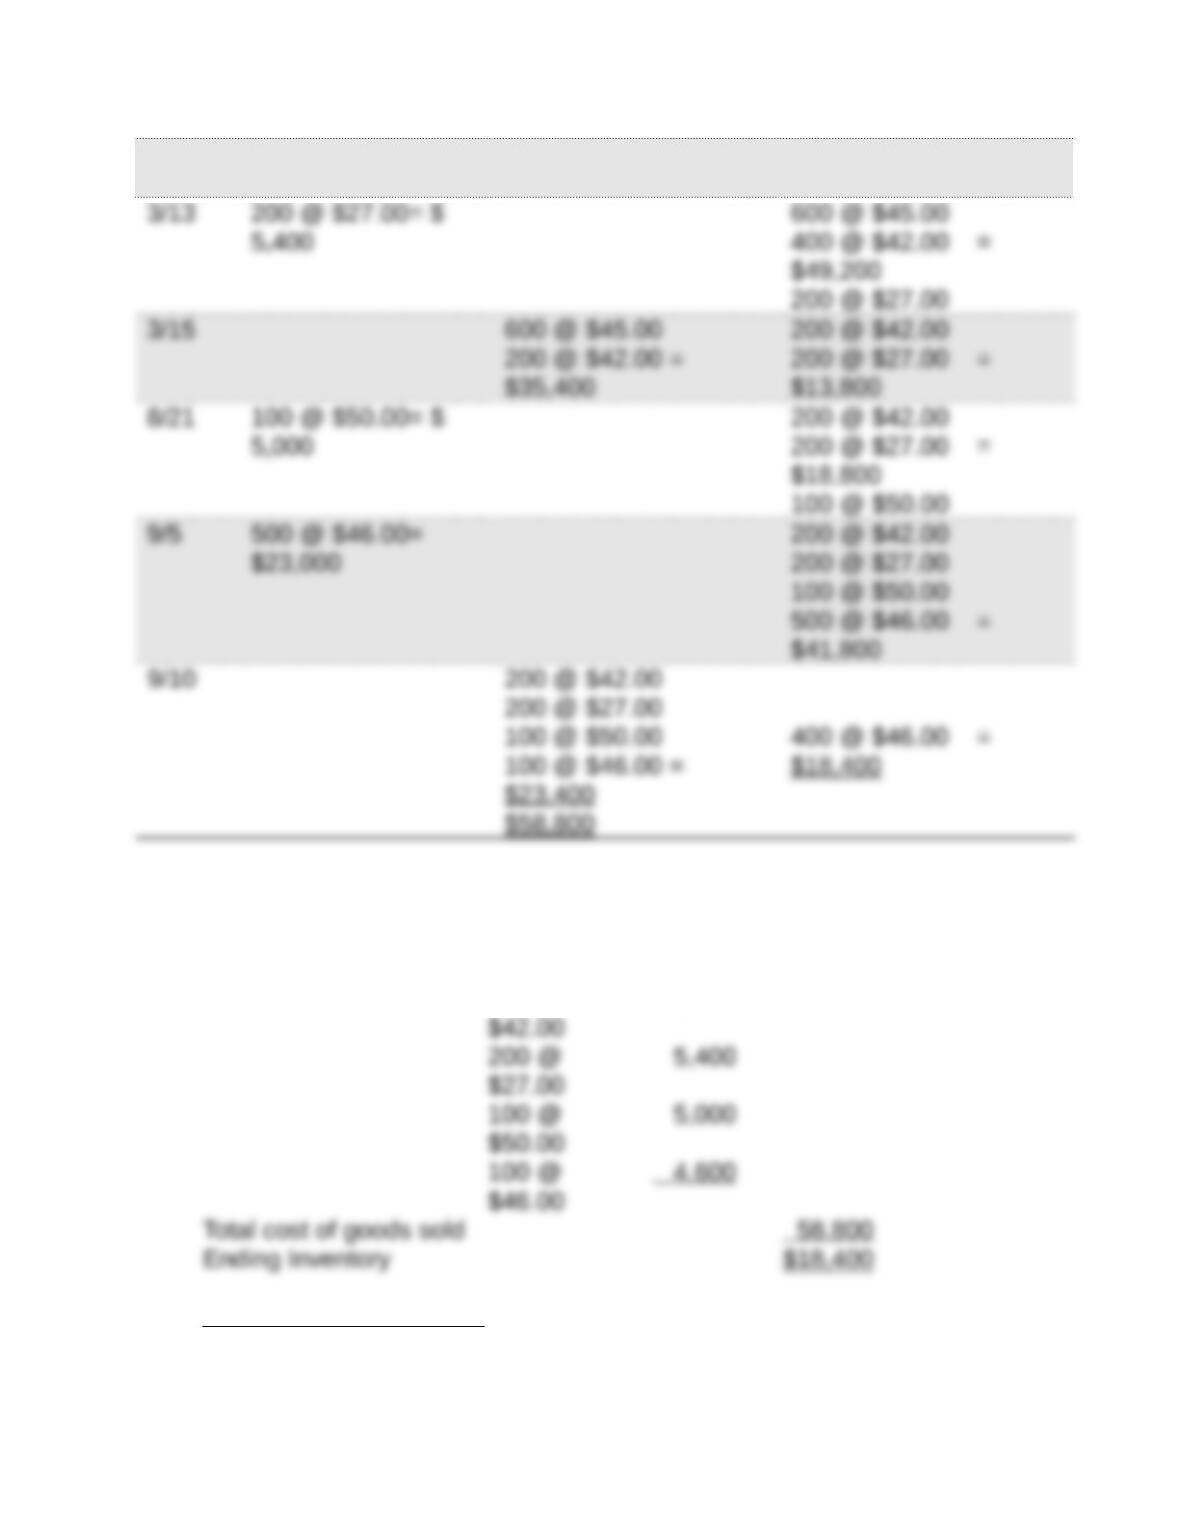
$16,800 400 @ $42.00 =
$43,800
FIFO Alternate Solution Format
Cost of goods available for sale $77,200
Less: Cost of sales 600 @
$45.00
$27,000
400 @
16,800
Proof of Ending Inventory
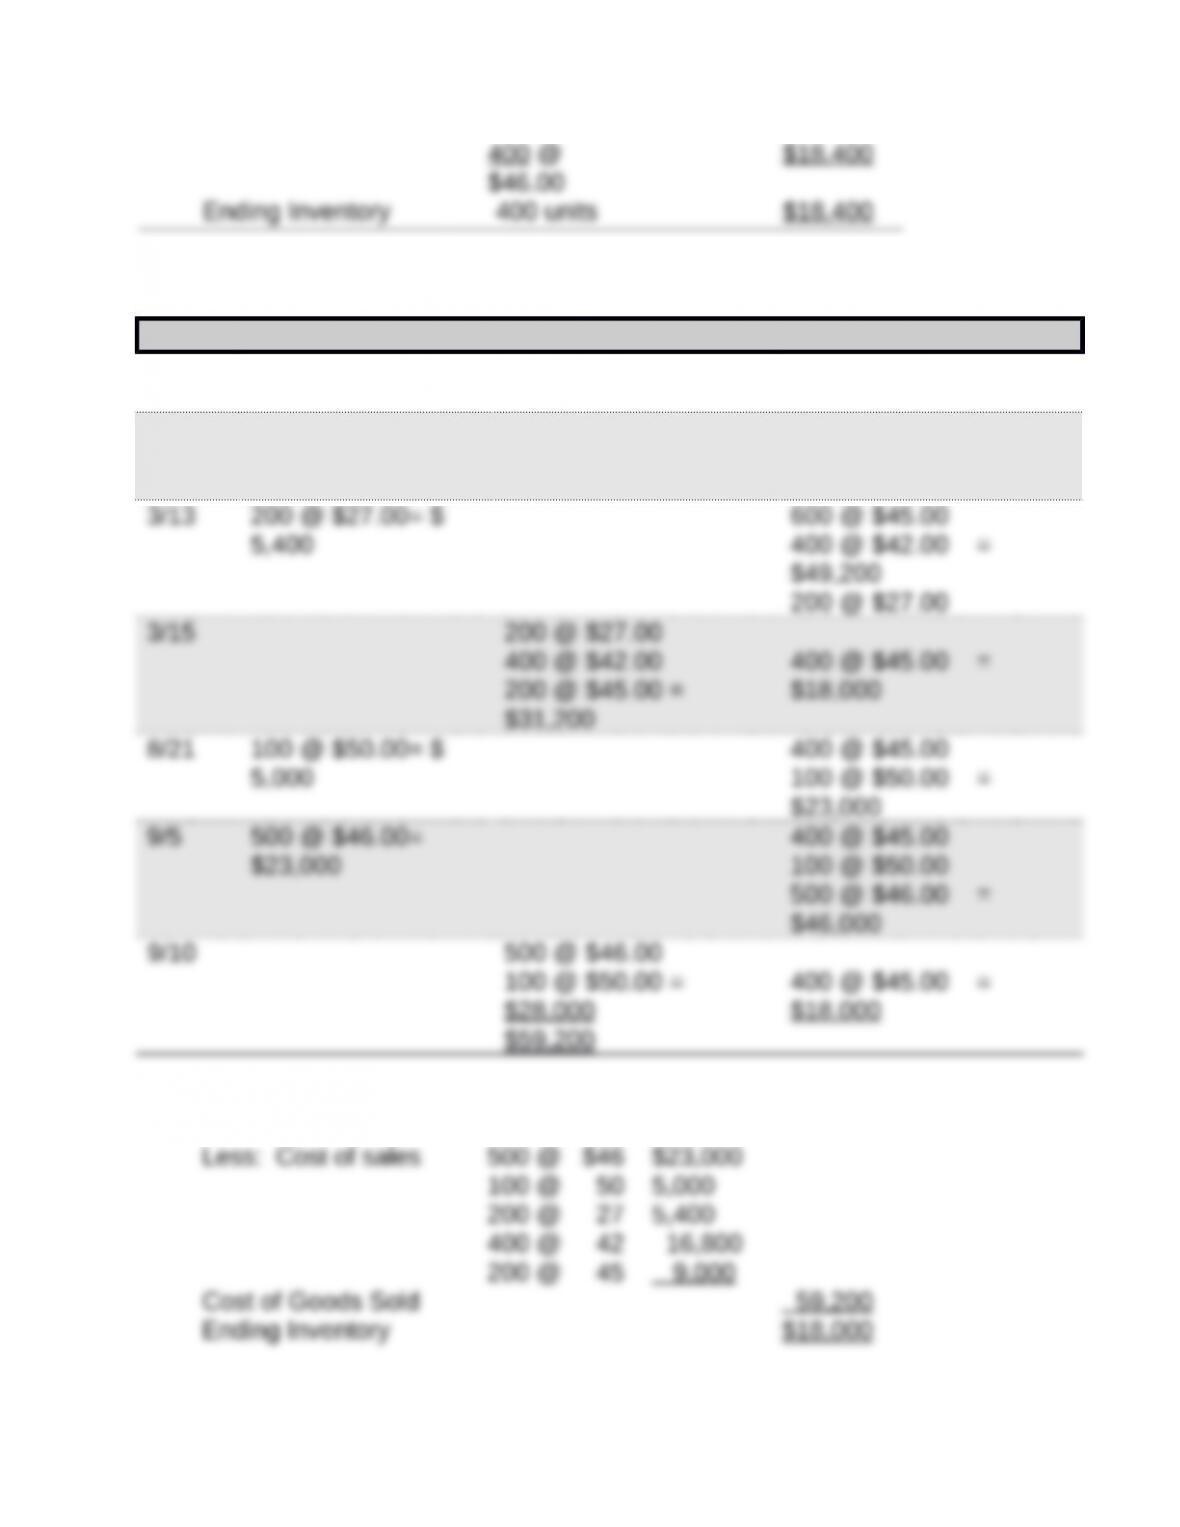
3b. LIFO perpetual
Date Goods Purchased Cost of Goods Sold Inventory Balance
1/1 600 @ $45.00 =
$27,000
2/10 400 @ $42.00=
$16,800
600 @ $45.00
400 @ $42.00 =
$43,800
LIFO alternate solution format
Cost of goods available for sale $77,200
Proof of Ending Inventory
3c. Weighted Average
Date Goods Purchased Cost of Goods Sold Inventory Balance
1/1 600 @ $45.00 =
$27,000
2/10 400 @ $42.00=
$16,800
600 @ $45.00
400 @ $42.00 =
$43,800
(avg. cost is $43.80)
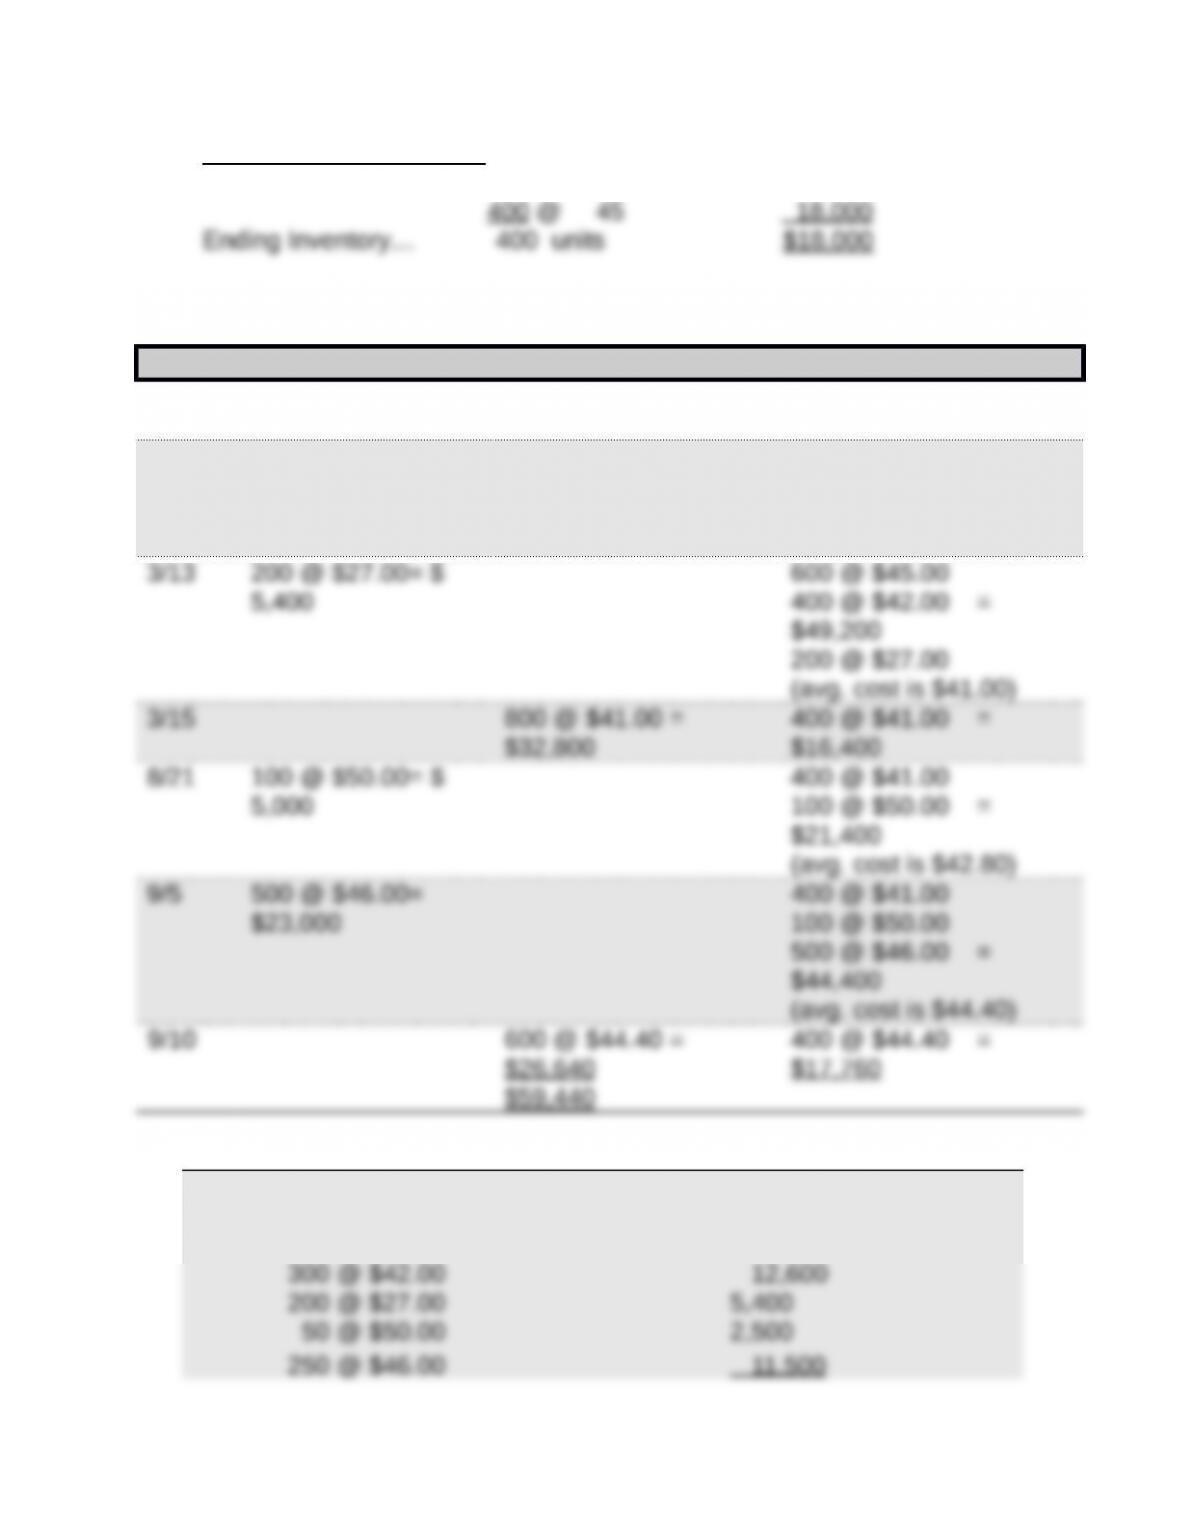
3d. Specific Identification
Cost of goods available for sale $77,200
Less: Cost of Goods Sold
600 @ $45.00 $27,000
Total cost of goods sold 59,000
Ending Inventory $18,200
Proof of Ending Inventory
100 @ $42 $ 4,200
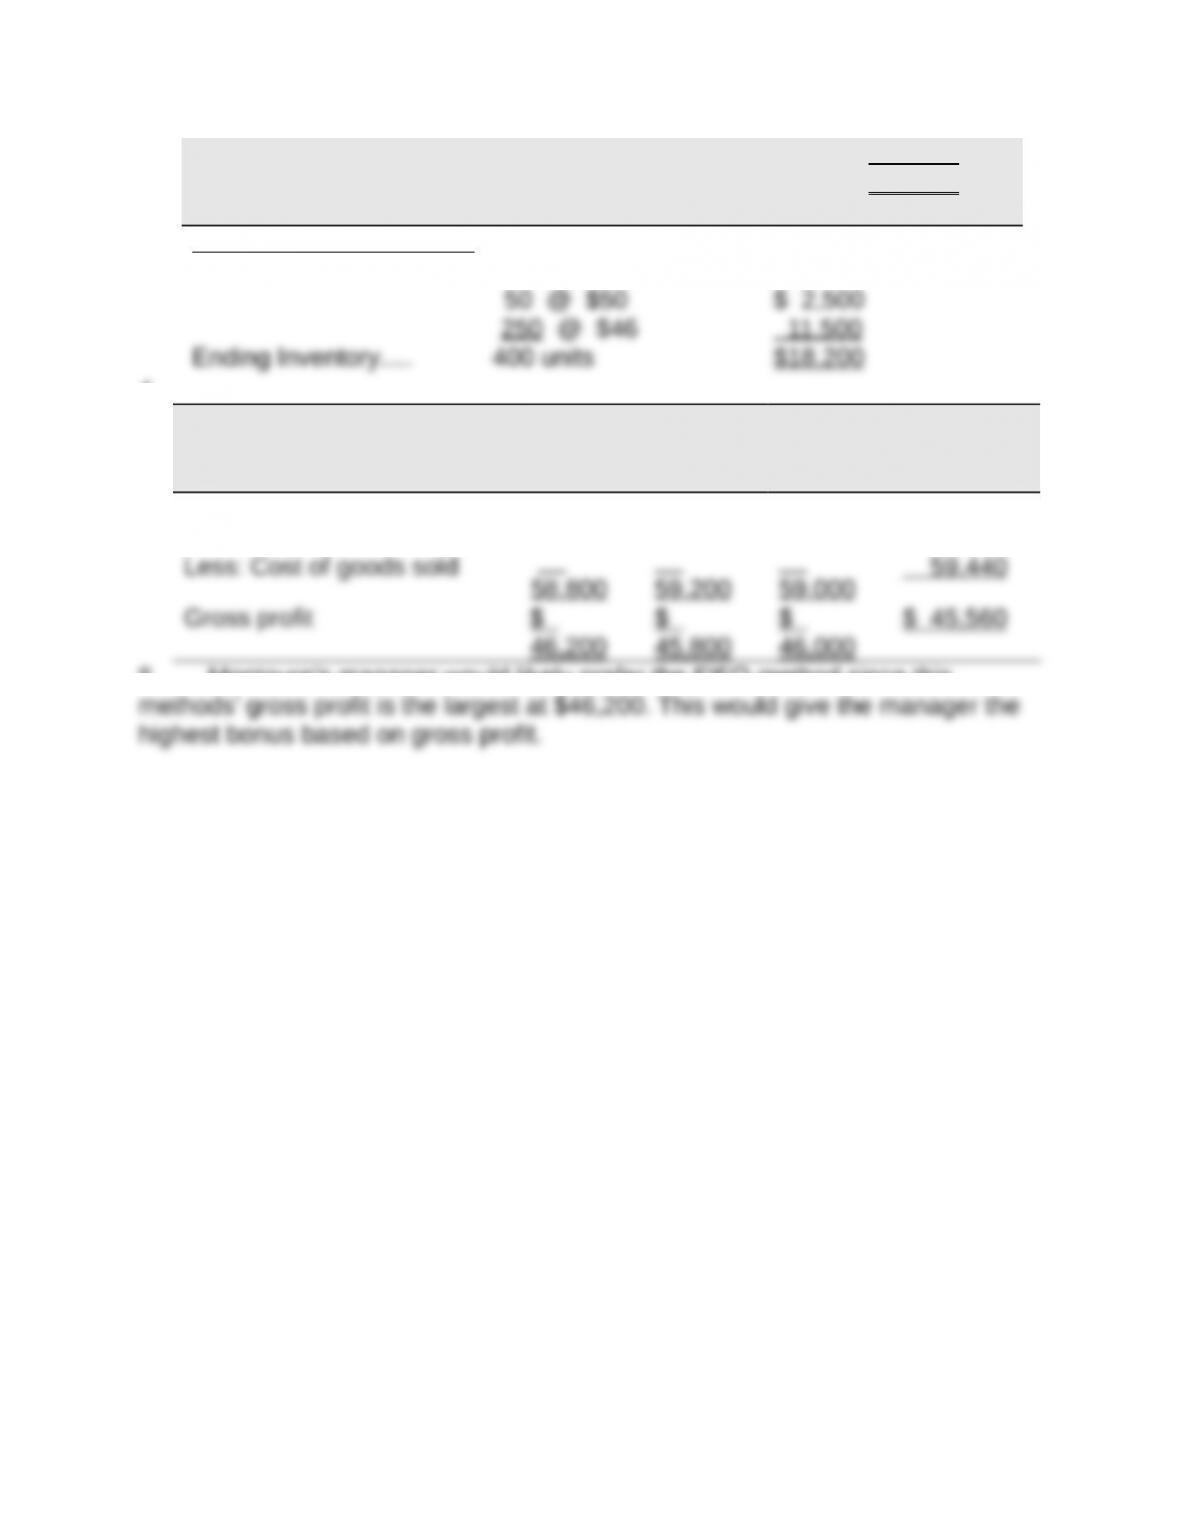
4.
FIFO LIFO
Specific
Identifi-c
ation
Weighted
Average
Sales (1,400 x $75) $105,00
0
$105,00
0
$105,00
0
$105,000
46,200
45,800
46,000
5. Montoure’s manager would likely prefer the FIFO method since this