Title: Exercise 6-1
QA_Ori:
The consignor is Harris Company. The consignee is Harlow Company. The
The title will pass at “destination” which is Harlow Company’s receiving dock.
Title: Exercise 6-2
QA_Ori:
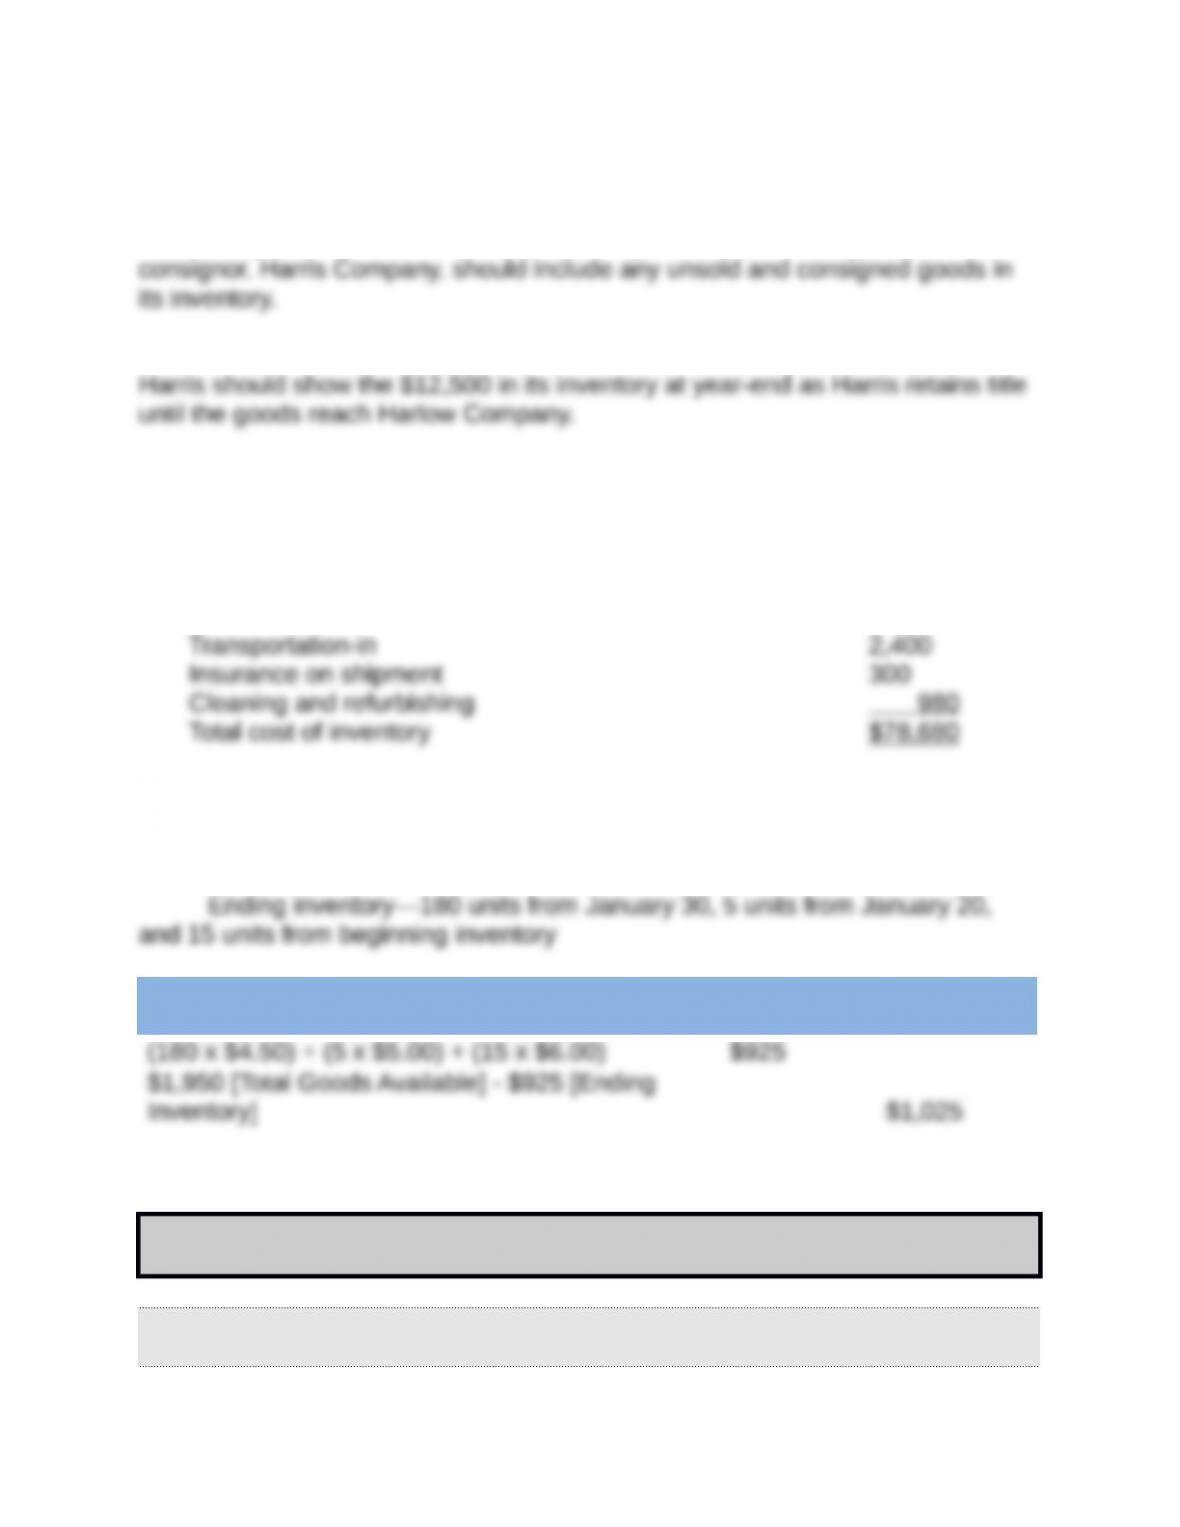
Cost of inventory (estate’s contents)
Price $75,000
Title: Exercise 6-3
QA_Ori:
a. Specific identification
Specific Identification
Ending
Inventory
Cost of
Goods Sold
b. Weighted Average—Perpetual
Date Goods
Purchased
Cost of Goods Sold Inventory Balance
1/1 140 @ $6.00 = $ 840.00
1/10 100 @ $6.00 = $
600.00
40 @ $6.00 = $ 240.00
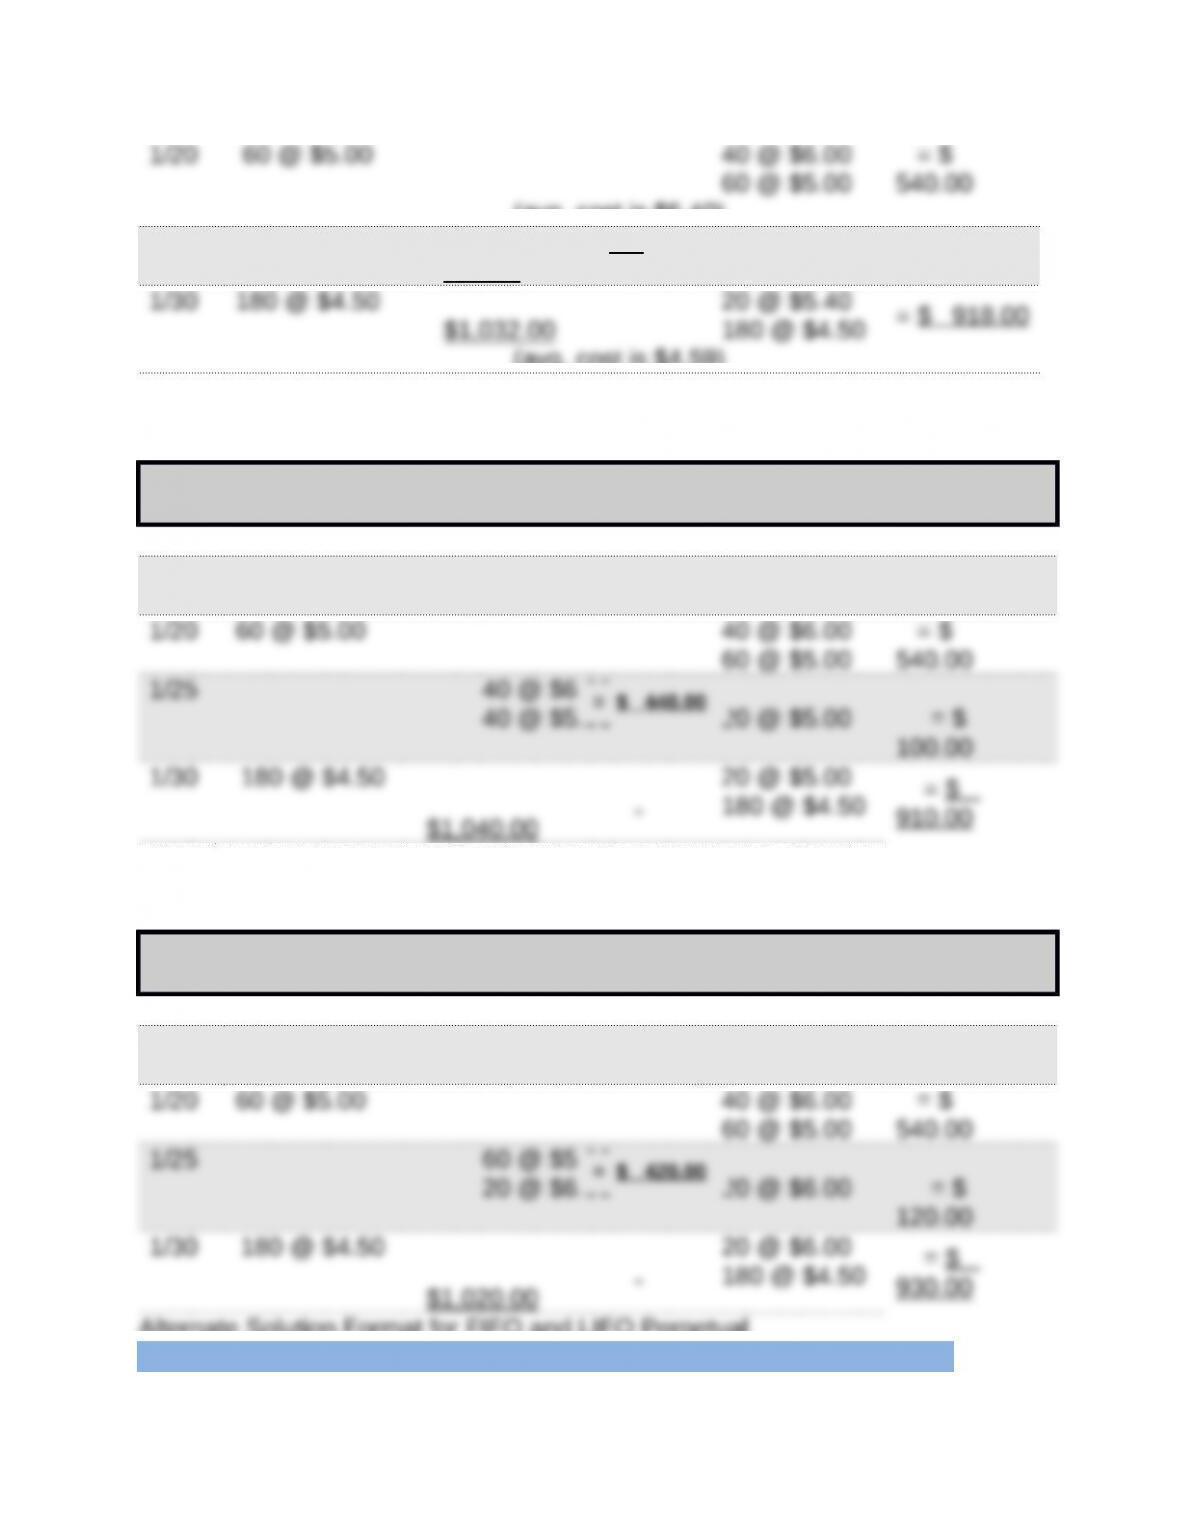
(avg. cost is $5.40)
1/25 80 @ $5.40 = $
432.00
20 @ $5.40 = $ 108.00
(avg. cost is $4.59)
c. FIFO—Perpetual
QA_Ori:
Date Goods
Purchased
Cost of Goods Sold Inventory Balance
1/1 140 @ $6.00 = $ 840.00
1/10 100 @ $6.00 = $
600.00
40 @ $6.00 = $ 240.00
$1,040.00 180 @ $4.50
d. LIFO—Perpetual
Date Goods
Purchased
Cost of Goods Sold Inventory Balance
1/1 140 @ $6.00 = $ 840.00
1/10 100 @ $6.00 = $
600.00
40 @ $6.00 = $ 240.00
Alternate Solution Format for FIFO and LIFO Perpetual
Ending Cost of
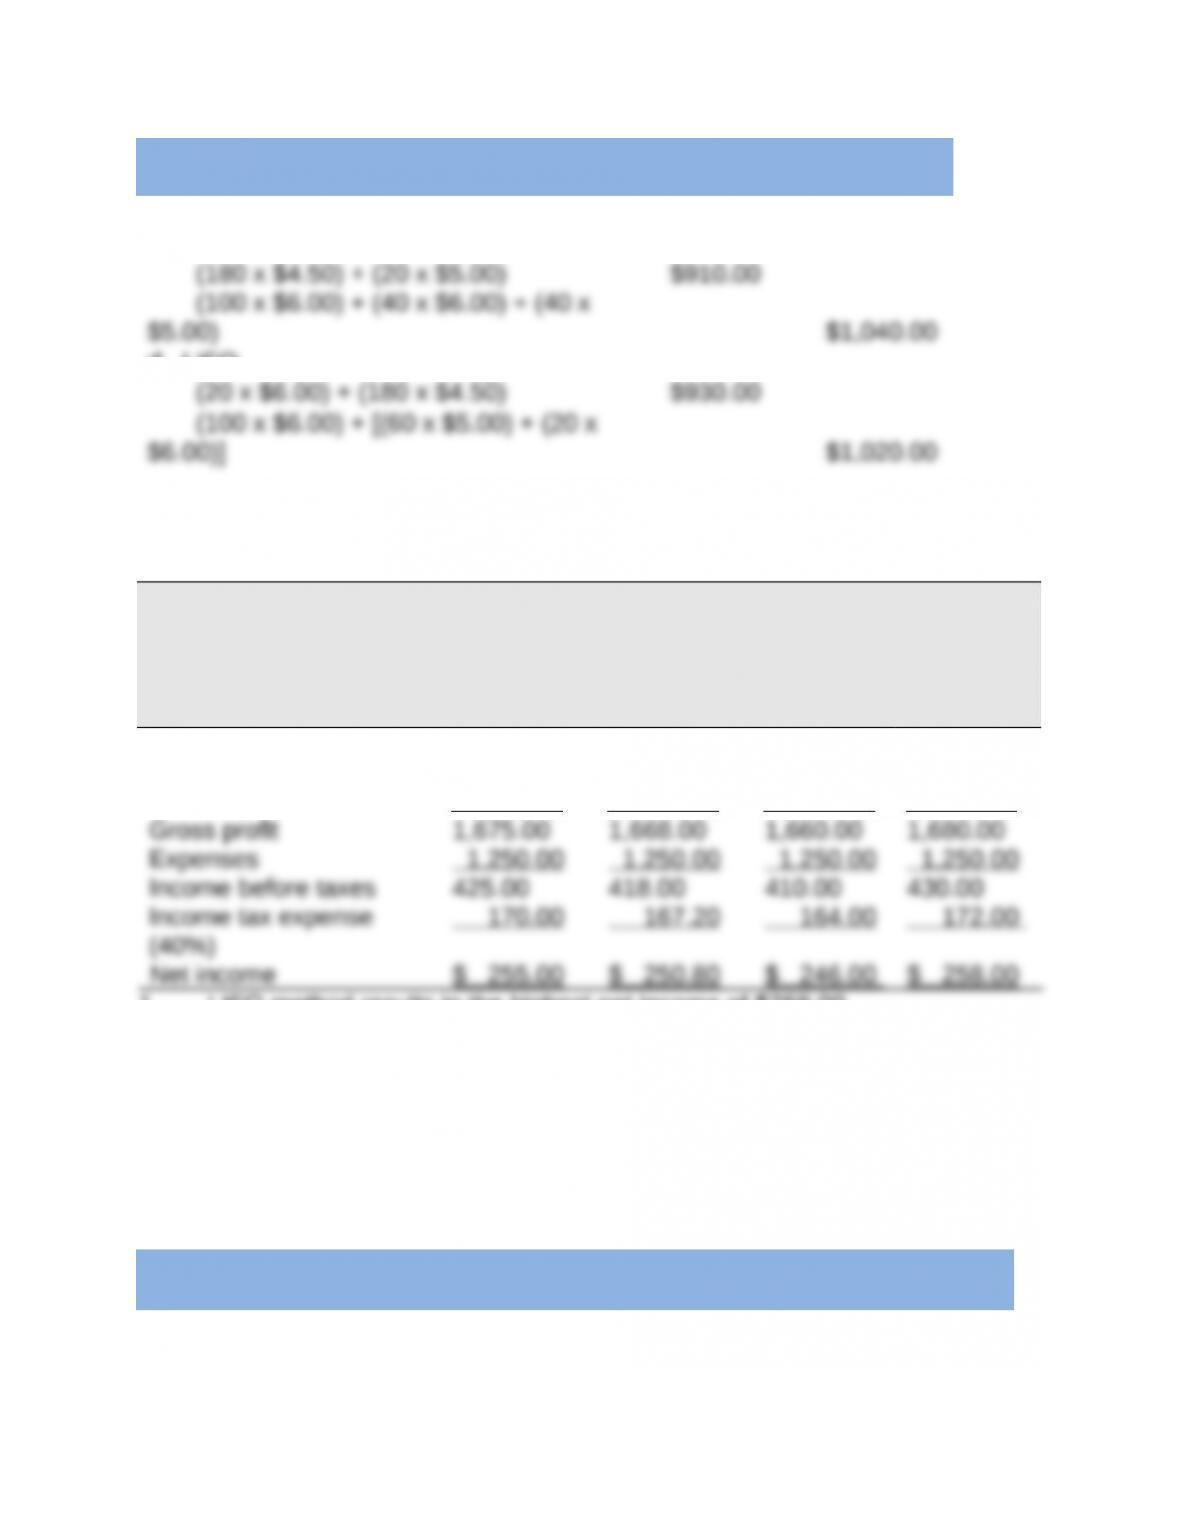
Inventory
Goods
Sold
Computations
c. FIFO
d. LIFO
Title: Exercise 6-4
QA_Ori:
LAKER COMPANY
Income Statements
For Month Ended January 31
Specific
Identification
Weighted
Average FIFO LIFO
Sales $2,700.00 $2,700.00 $2,700.00 $2,700.00
(180 units x $15 price)
Cost of goods sold 1,025.00 1,032.00 1,040.00 1,020.00
1. LIFO method results in the highest net income of $258.00.
2. Weighted average net income of $250.80 falls between the FIFO net
income of $246.00 and the LIFO net income of $258.00.
3. If costs were rising instead of falling, then the FIFO method would yield the
highest net income.
Title: Exercise 6-5A
QA_Ori:
Periodic Inventory Computations
Ending Cost of
Inventory Goods Sold
a
. Specific Identification—Periodic
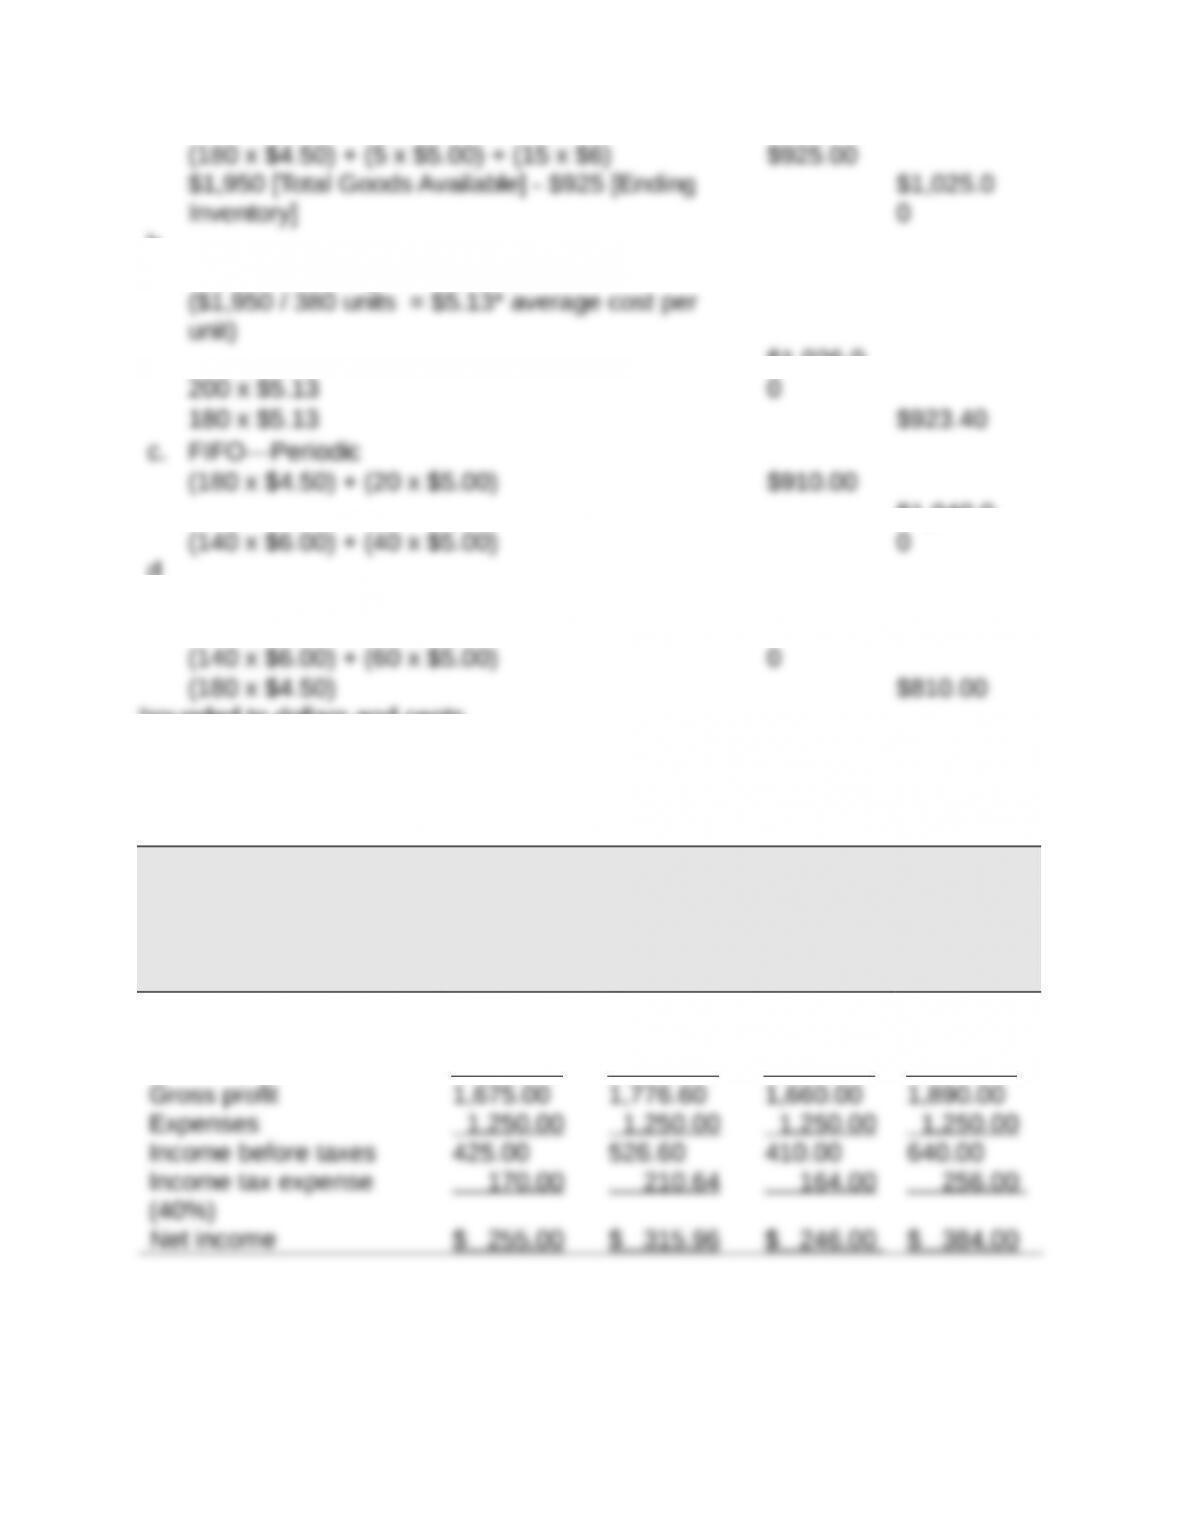
b
. Weighted Average—Periodic
d
. LIFO—Periodic
$1,140.0
*rounded to dollars and cents
*rounded to dollars and cents
Title: Exercise 6-6
QA_Ori:
LAKER COMPANY
Income Statements
For Month Ended January 31
Specific
Identification
Weighted
Average FIFO LIFO
Sales $2,700.00 $2,700.00 $2,700.00 $2,700.00
(180 units x $15 price)
Cost of goods sold 1,025.00 923.40 1,040.00 810.00
1. LIFO method results in the highest net income of $384.00.
Title: Exercise 6-7
QA_Ori:
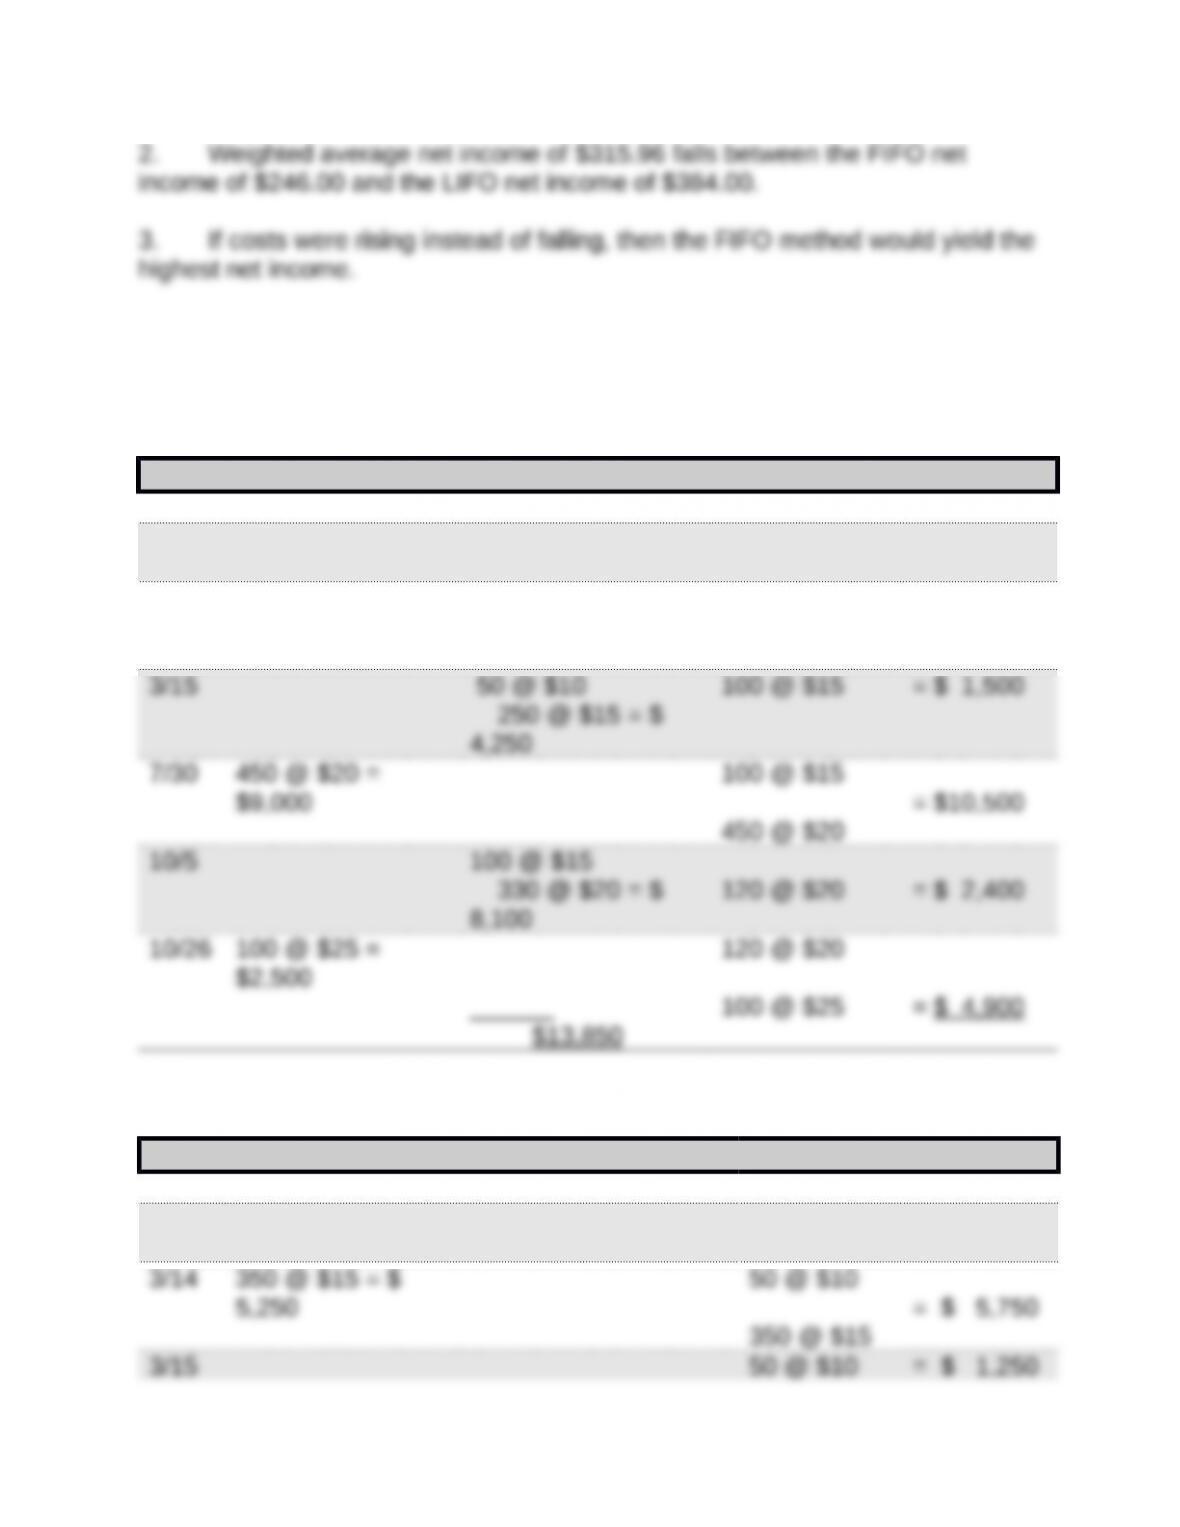
a. FIFO—Perpetual
Date Goods Purchased Cost of Goods Sold Inventory Balance
1/1 200 @ $10 = $ 2,000
1/10 150 @ $10 = $
1,500
50 @ $10 = $ 500
3/14 350 @ $15 =
$5,250
50 @ $10
= $ 5,750
350 @ $15
b. LIFO—Perpetual
Date Goods Purchased Cost of Goods Sold Inventory Balance
1/1 200 @ $10 = $ 2,000
1/10 150 @ $10 = $
1,500
50 @ $10 = $ 500
300 @ $15 = $
4,500
50 @ $15
10/5 50 @ $10
430 @ $20 =
$8,600
50 @ $15 = $ 1,650
20 @ $20
10/26 100 @ $25 = $
50 @ $10
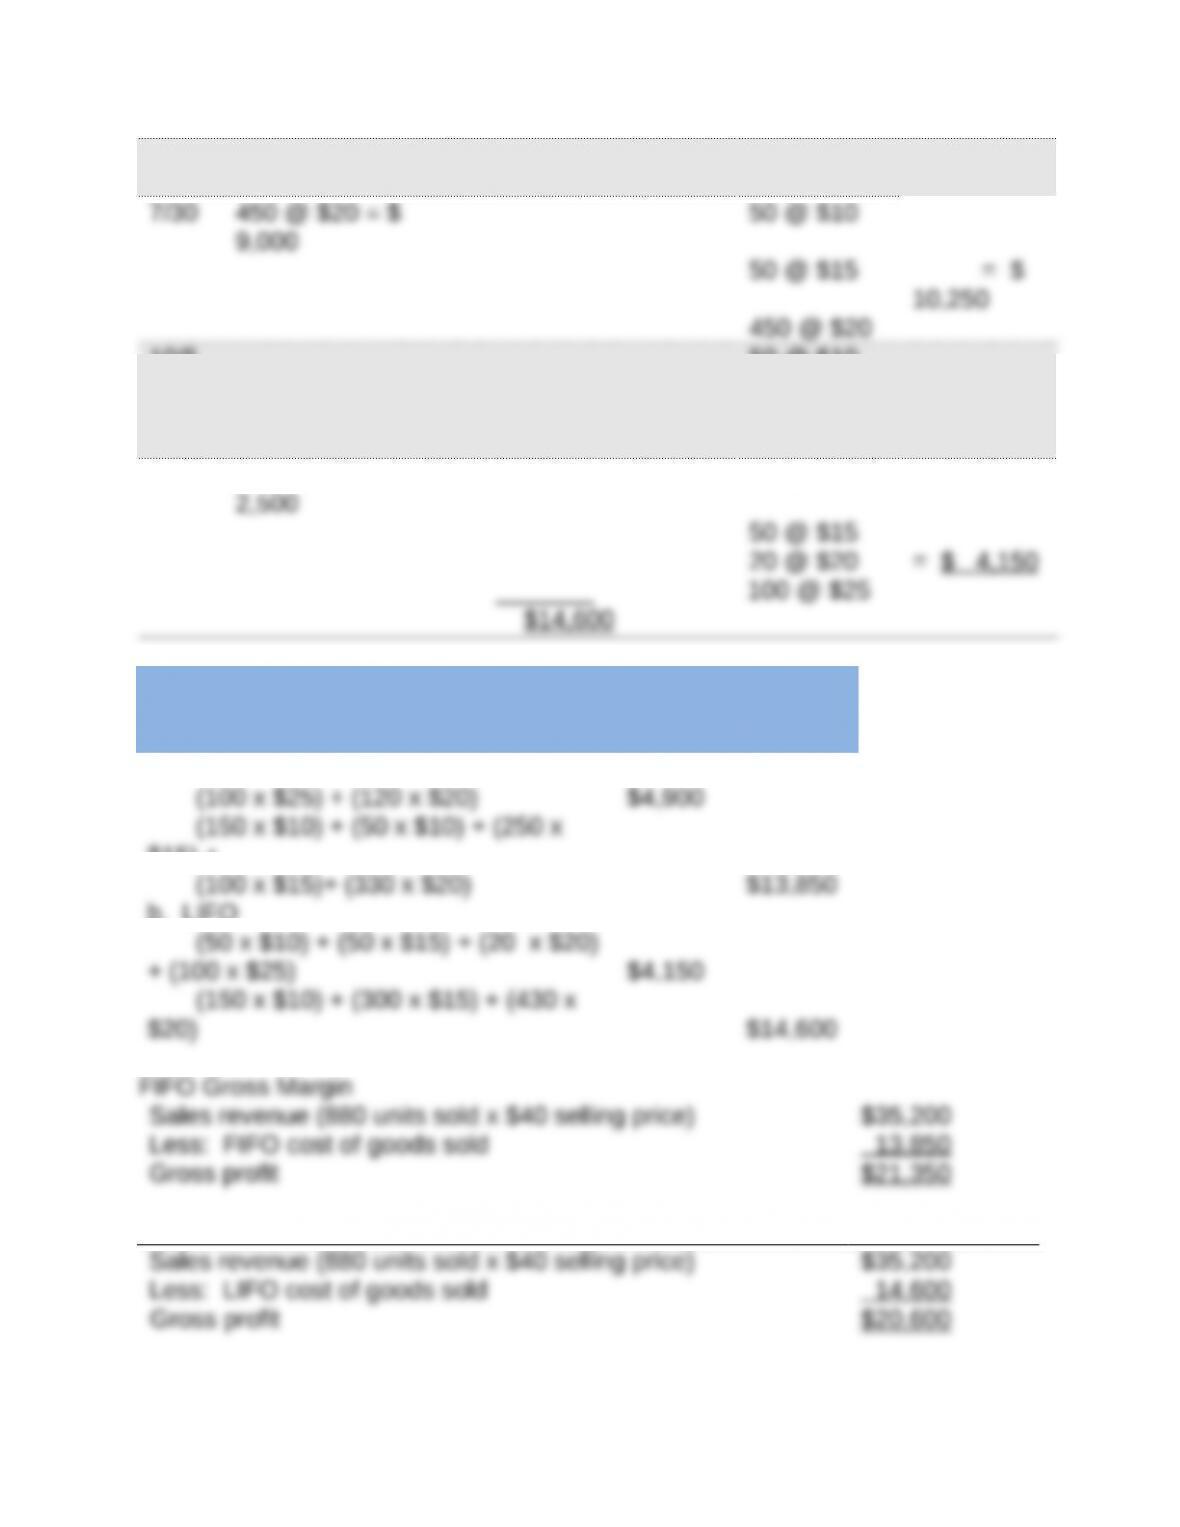
Alternate Solution Format
Cost of
Goods
Sold
Ending
Inventory
a. FIFO
$15) +
b. LIFO
LIFO Gross Margin
Title: Exercise 6-8
QA_Ori:
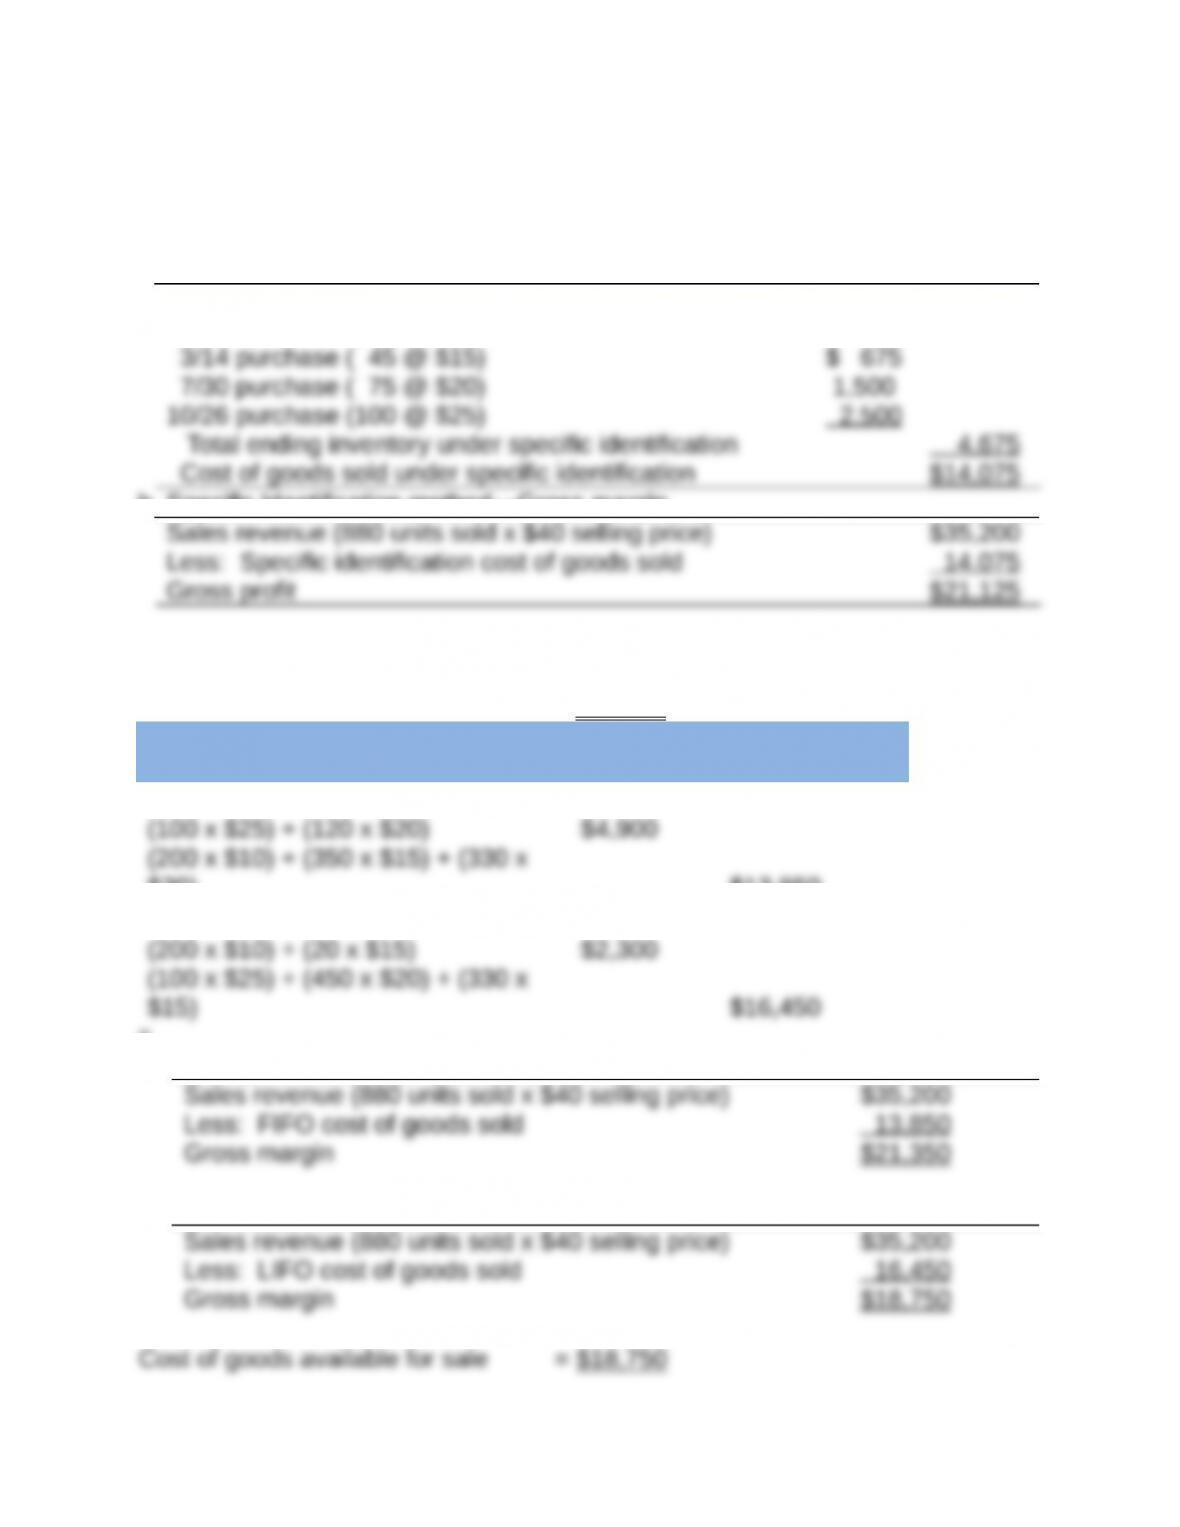
a. Specific Identification method—Cost of goods sold
Cost of goods available for sale $18,750
Ending inventory under specific identification
b. Specific Identification method—Gross margin
Title: Exercise 6-9A
QA_Ori:
Cost of goods available for sale = $18,750
Ending Cost of
Periodic Inventory System Inventory Goods Sold
a. FIFO—Periodic
$20) $13,850
b. LIFO—Periodic
c.
FIFO —Periodic Gross Margin
LIFO—Periodic Gross Margin
Title: Exercise 6-10
QA_Ori:
Per Unit Total Total LCM
Applied to
Items
Inventory
Items
Unit
s
Cost Market Cost Market
Helmets 24 $50 $54 $1,200 $1,296 $1,200
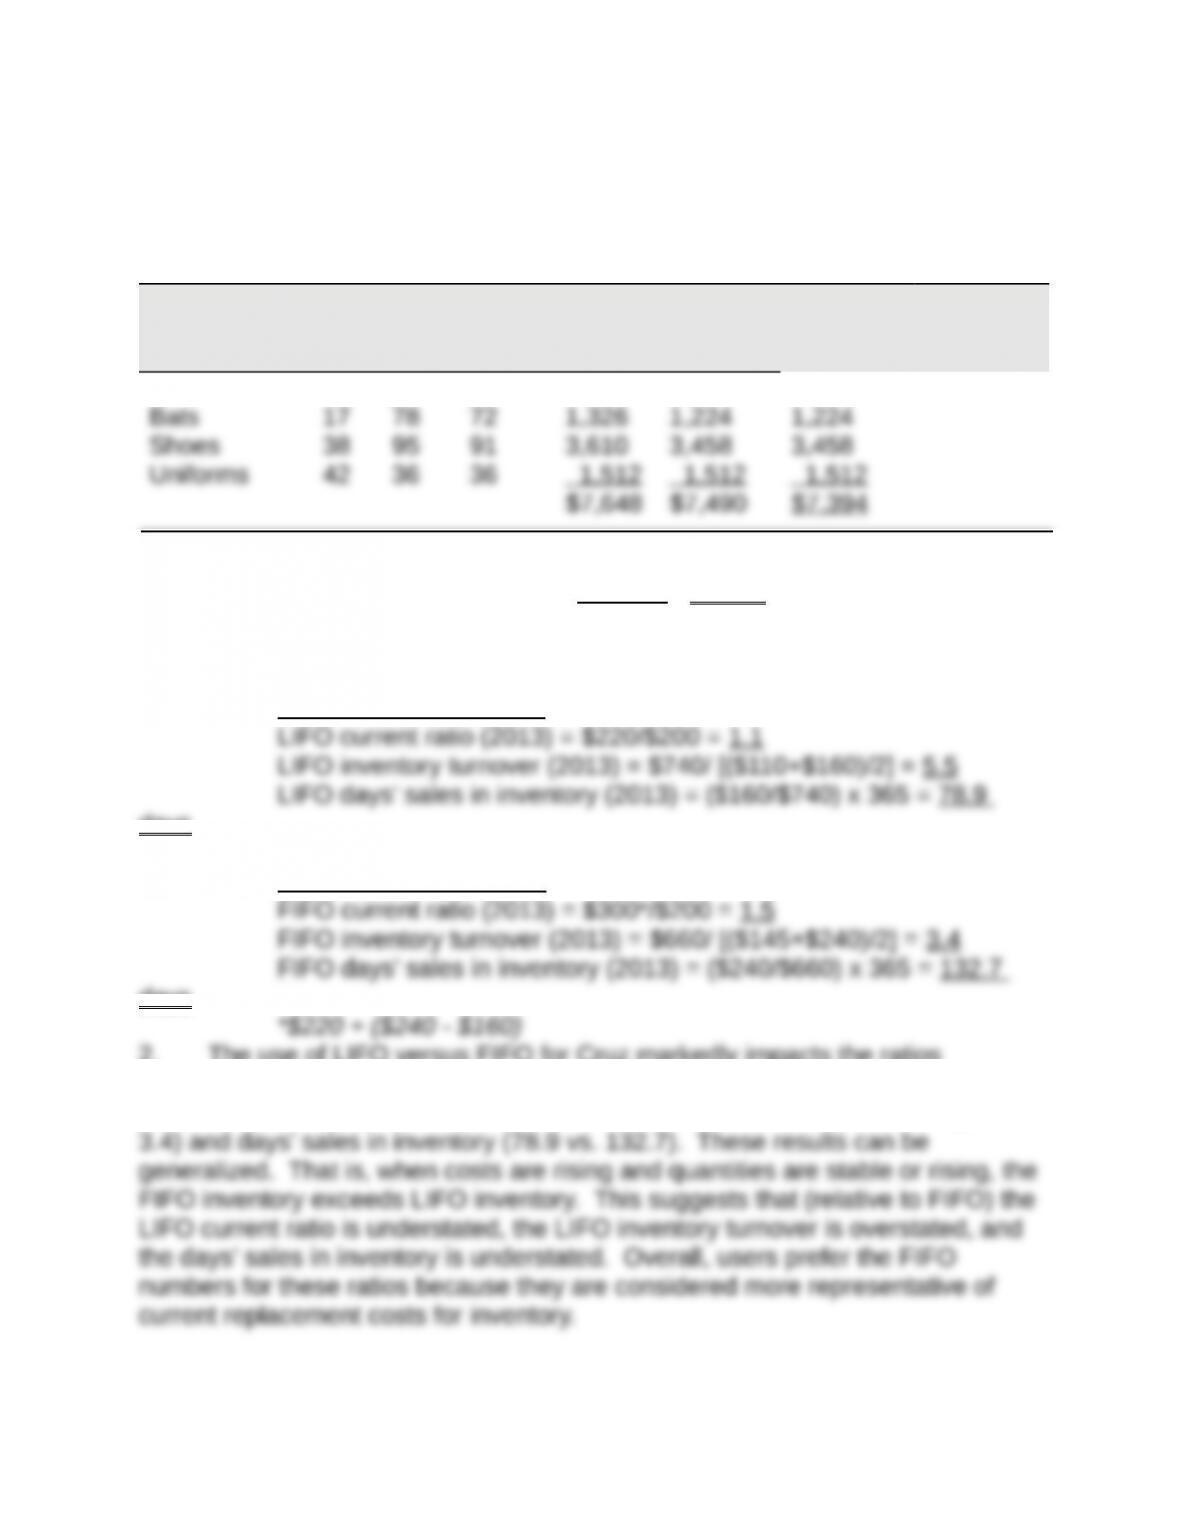
Lower of cost or market of inventory by product = $7,394
Title: Exercise 6-11
QA_Ori:
1. a. LIFO ratio computations
days
b. FIFO ratio computations
days
2. The use of LIFO versus FIFO for Cruz markedly impacts the ratios
computed. Specifically, LIFO makes Cruz appear worse in comparison to FIFO
numbers on the current ratio (1.1 vs. 1.5) but better on inventory turnover (5.5 vs.
Title: Exercise 6-12
QA_Ori:
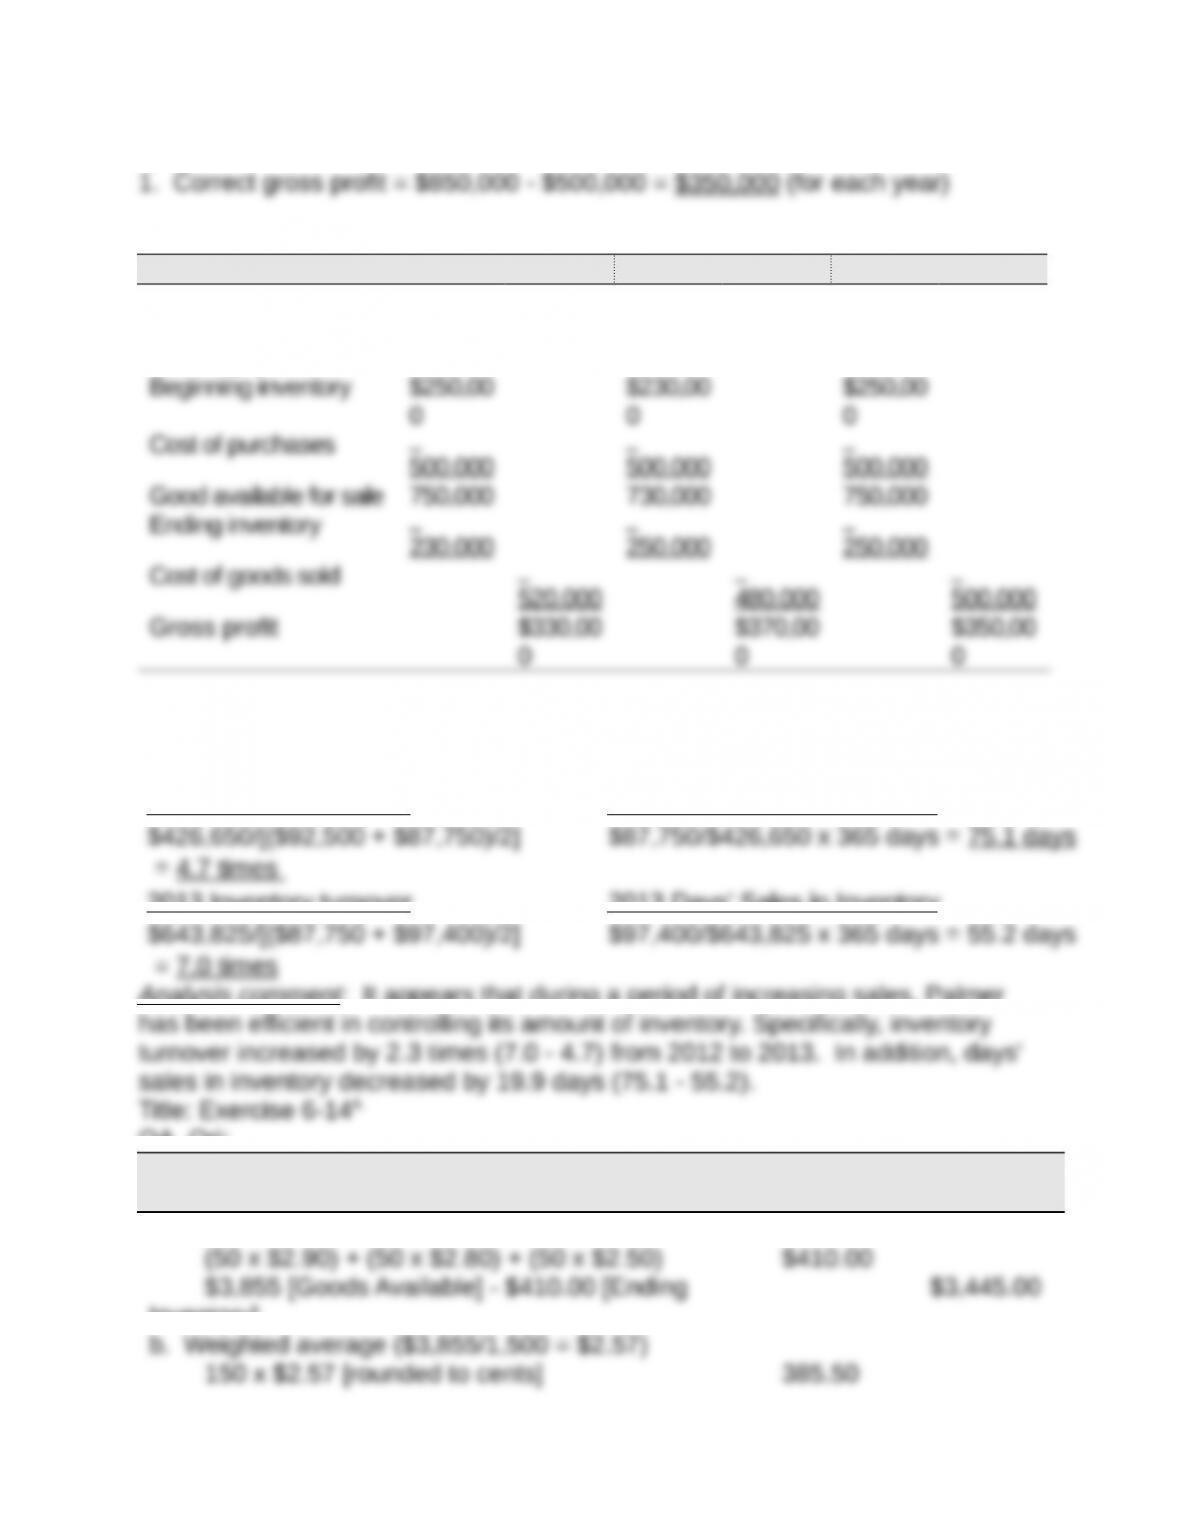
2. Reported income figures
Year 2012 Year 2013 Year 2014
Sales $850,00
0
$850,00
0
$850,00
0
Cost of goods sold
Title: Exercise 6-13
QA_Ori:
2012 Inventory turnover
2012 Days’ Sales in Inventory
2013 Inventory turnover
2013 Days’ Sales in Inventory
Analysis comment: It appears that during a period of increasing sales, Palmer
QA_Ori:
Ending
Inventory
Cost of
Goods Sold
a. Specific identification
Inventory]
Inventory]
c. FIFO
(150 x $2.90) 435.00
d. LIFO
Income effect: FIFO provides the lowest cost of goods sold, the highest gross
profit, and the highest net income, which is not unexpected during a period of
rising costs.
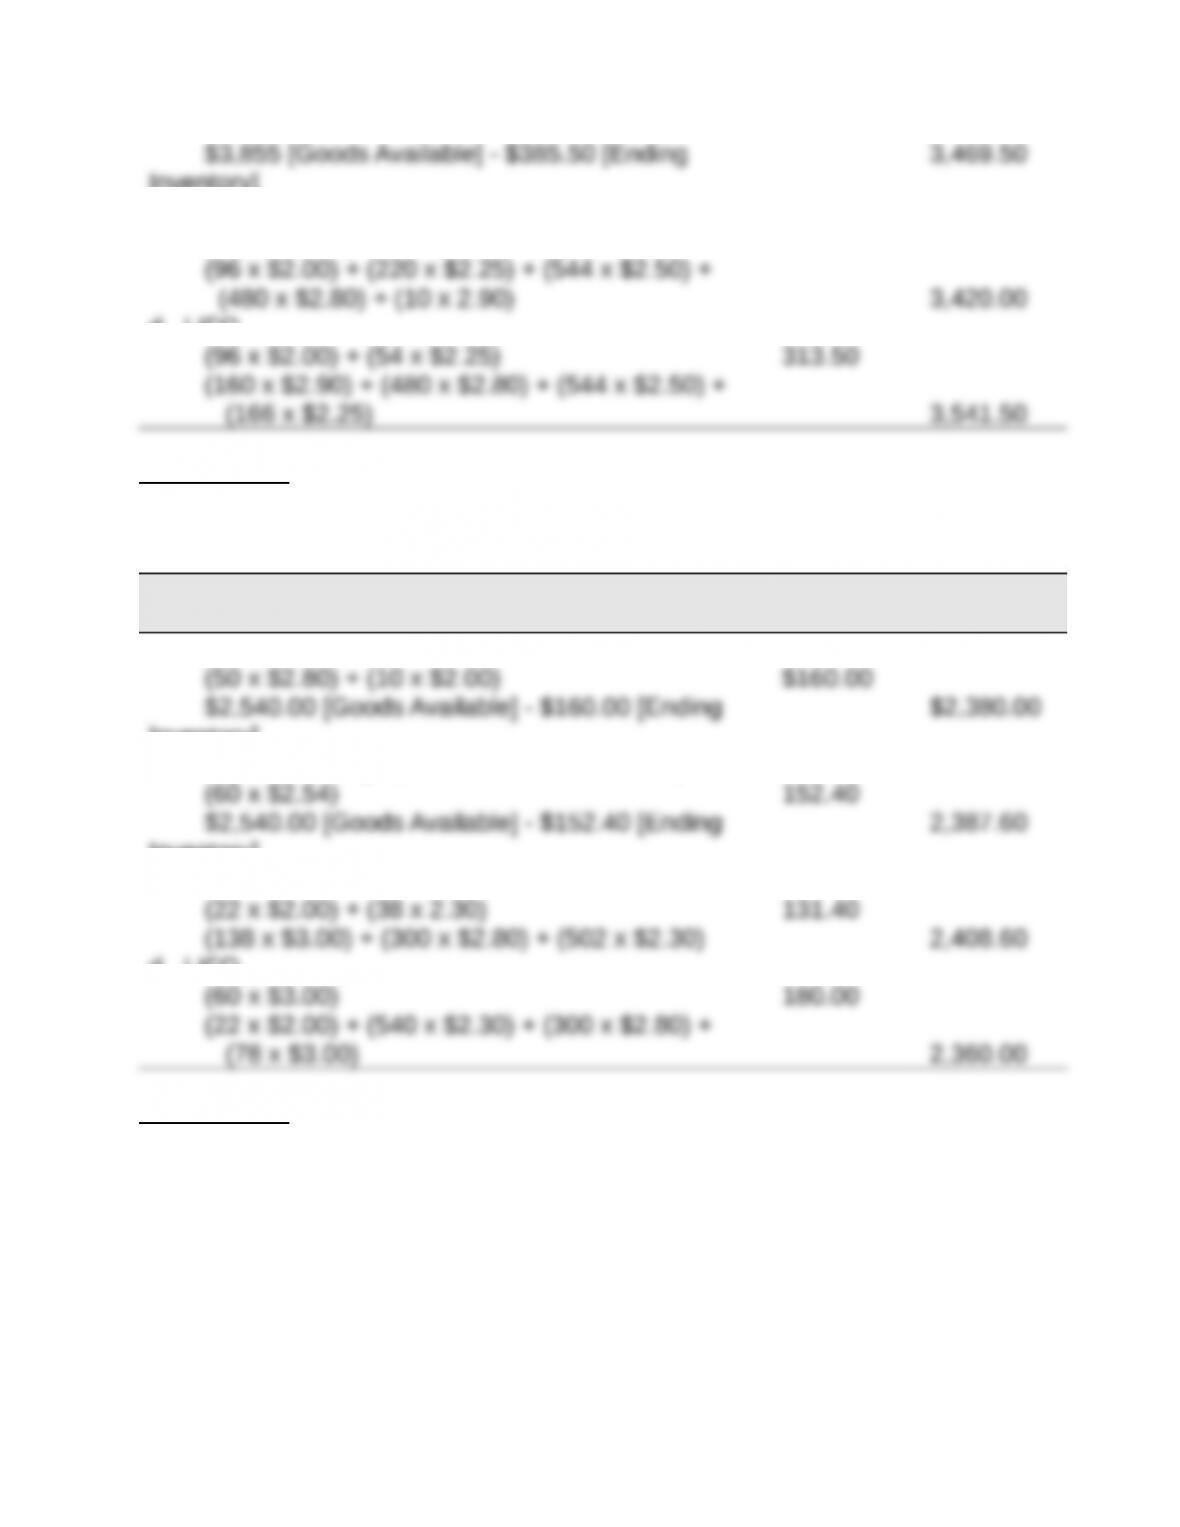
QA_Ori:
Periodic Inventory
Ending
Inventory
Cost of
Goods Sold
a. Specific Identification
Inventory]
b. Weighted Average ($2,540.00/1,000 = $2.54)
Inventory]
c. FIFO
d. LIFO
Income effect: LIFO provides the lowest cost of goods sold, the highest gross
profit, and the highest net income, which is not unexpected During a period of
declining costs.