Title: Problem 25-6A
QA_Ori:
Part 1
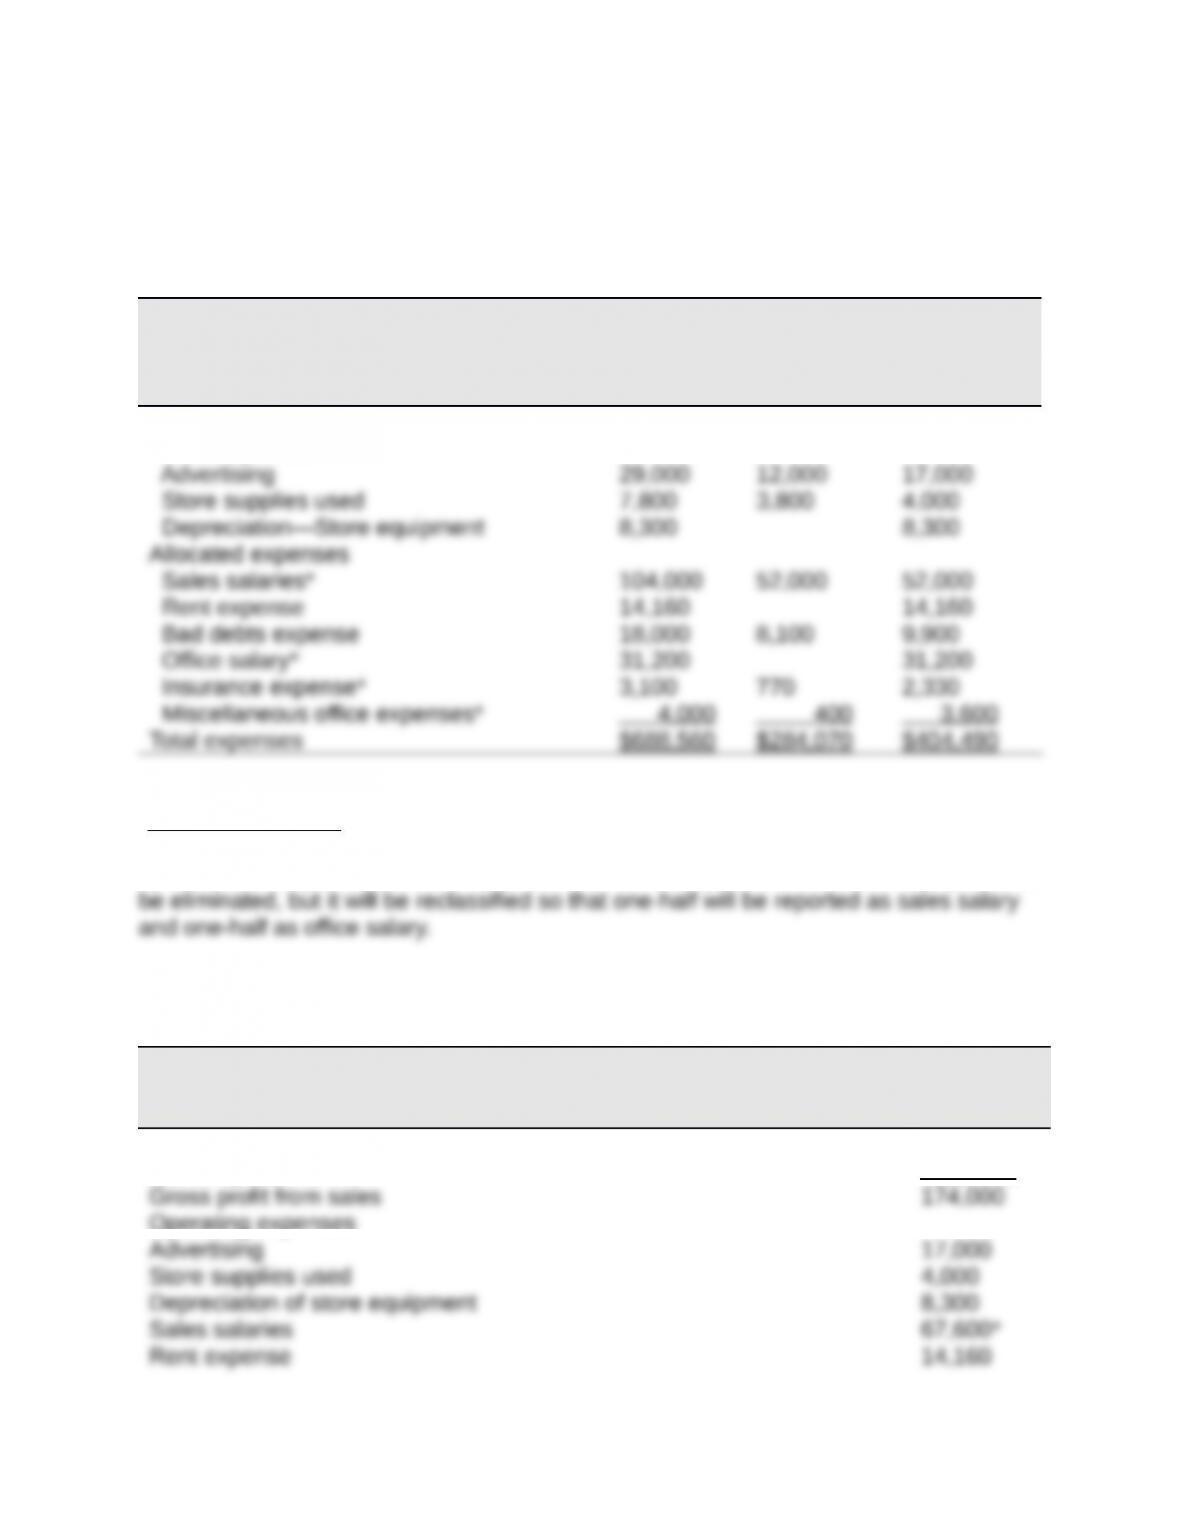
ELEGANT DECOR COMPANY
Analysis of Expenses under Elimination of Department 200
Total Eliminated Continuing
Expenses Expenses Expenses
Cost of goods sold $469,000 $207,000 $262,000
Direct expenses
*Computation notes. Closing Department 200 will eliminate 70% of its insurance
expense and 25% of its miscellaneous office expense. Sales salaries will be reduced
by the amounts paid to the two clerks who will not be replaced. The office salary will not
Part 2
ELEGANT DECOR COMPANY
Forecasted Annual Income Statement
Under Plan to Eliminate Department 200
Sales $436,000
Cost of goods sold 262,000
Operating expenses
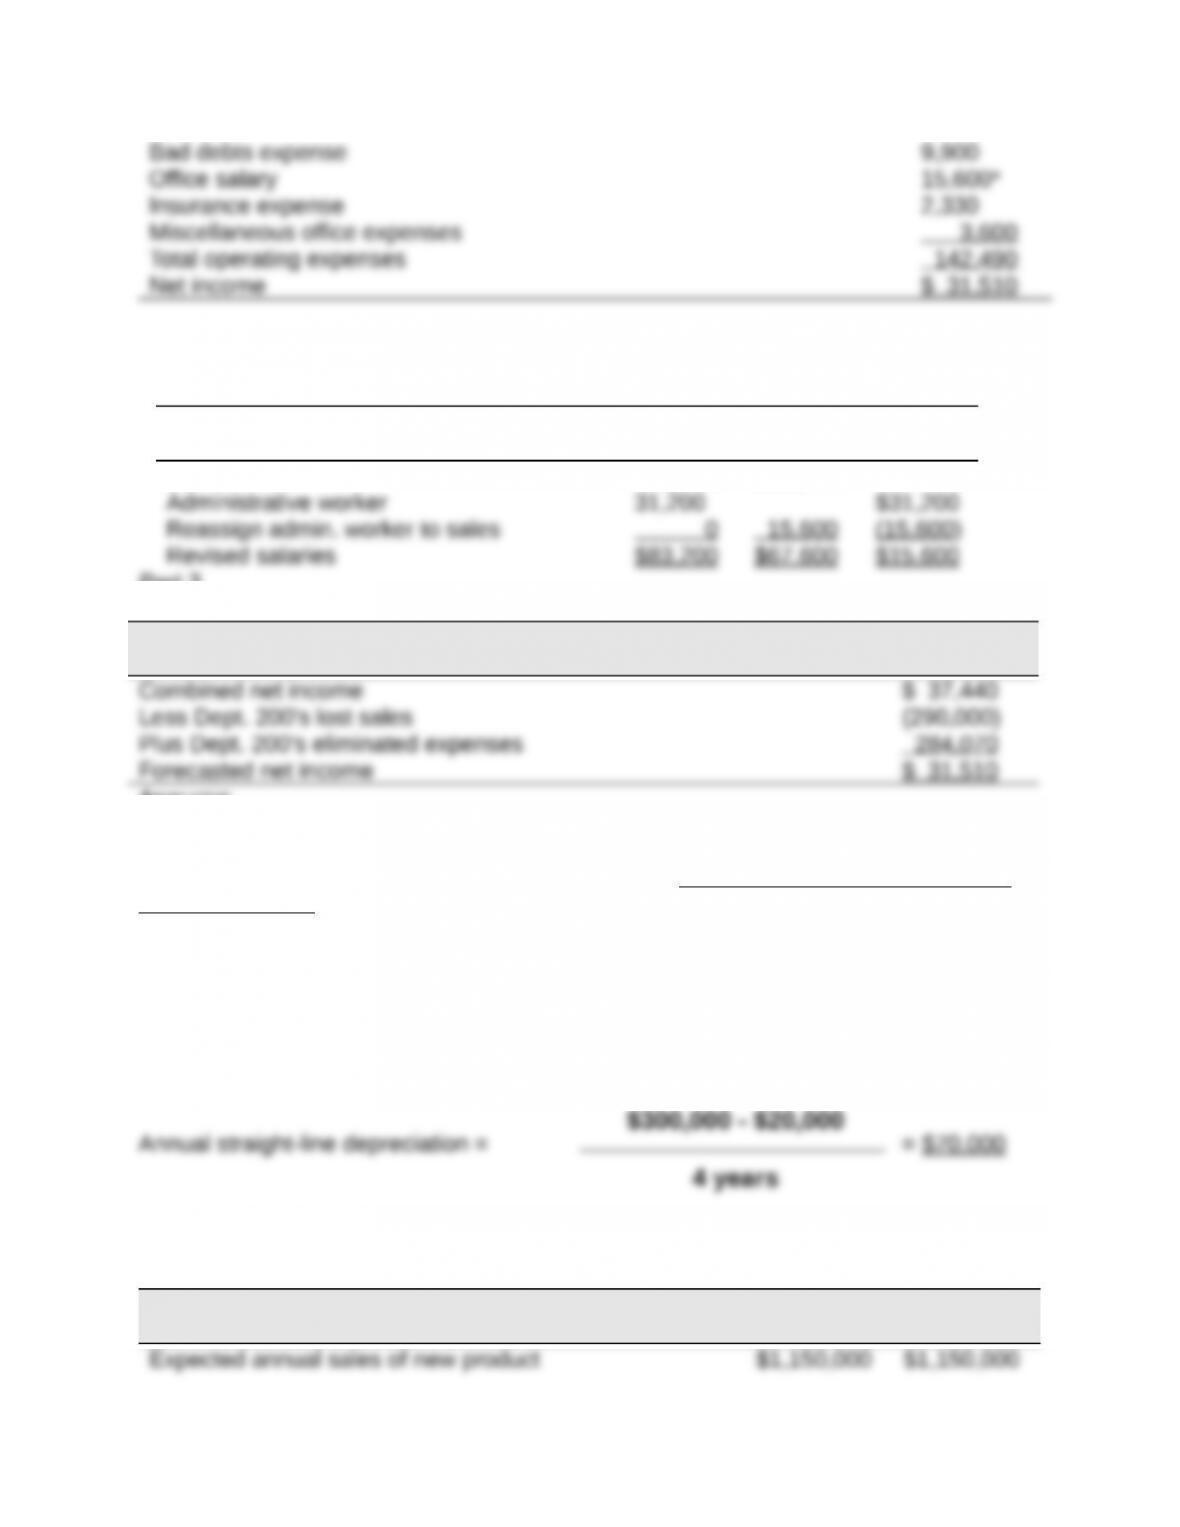
* Administrative salary reassignment
Total Sales Office
Salaries Salaries Salary
Salesclerks $52,000 $52,000
Part 3
ELEGANT DECOR COMPANY
Reconciliation of Combined Income With Forecasted Income
ANALYSIS
Department 200’s avoidable expenses of $284,070 are $5,930 less than its revenues of
$290,000. This means the company’s annual net income would be $5,930 less from
eliminating Department 200. This analysis suggests the department should probably
not be eliminated.
Title: Problem 25-1B
QA_Ori:
Part 1
Part 2
Net Net Cash
Income Flow
Expected annual sales of new product $1,150,000 $1,150,000
$300,000 – $20,000
4 years
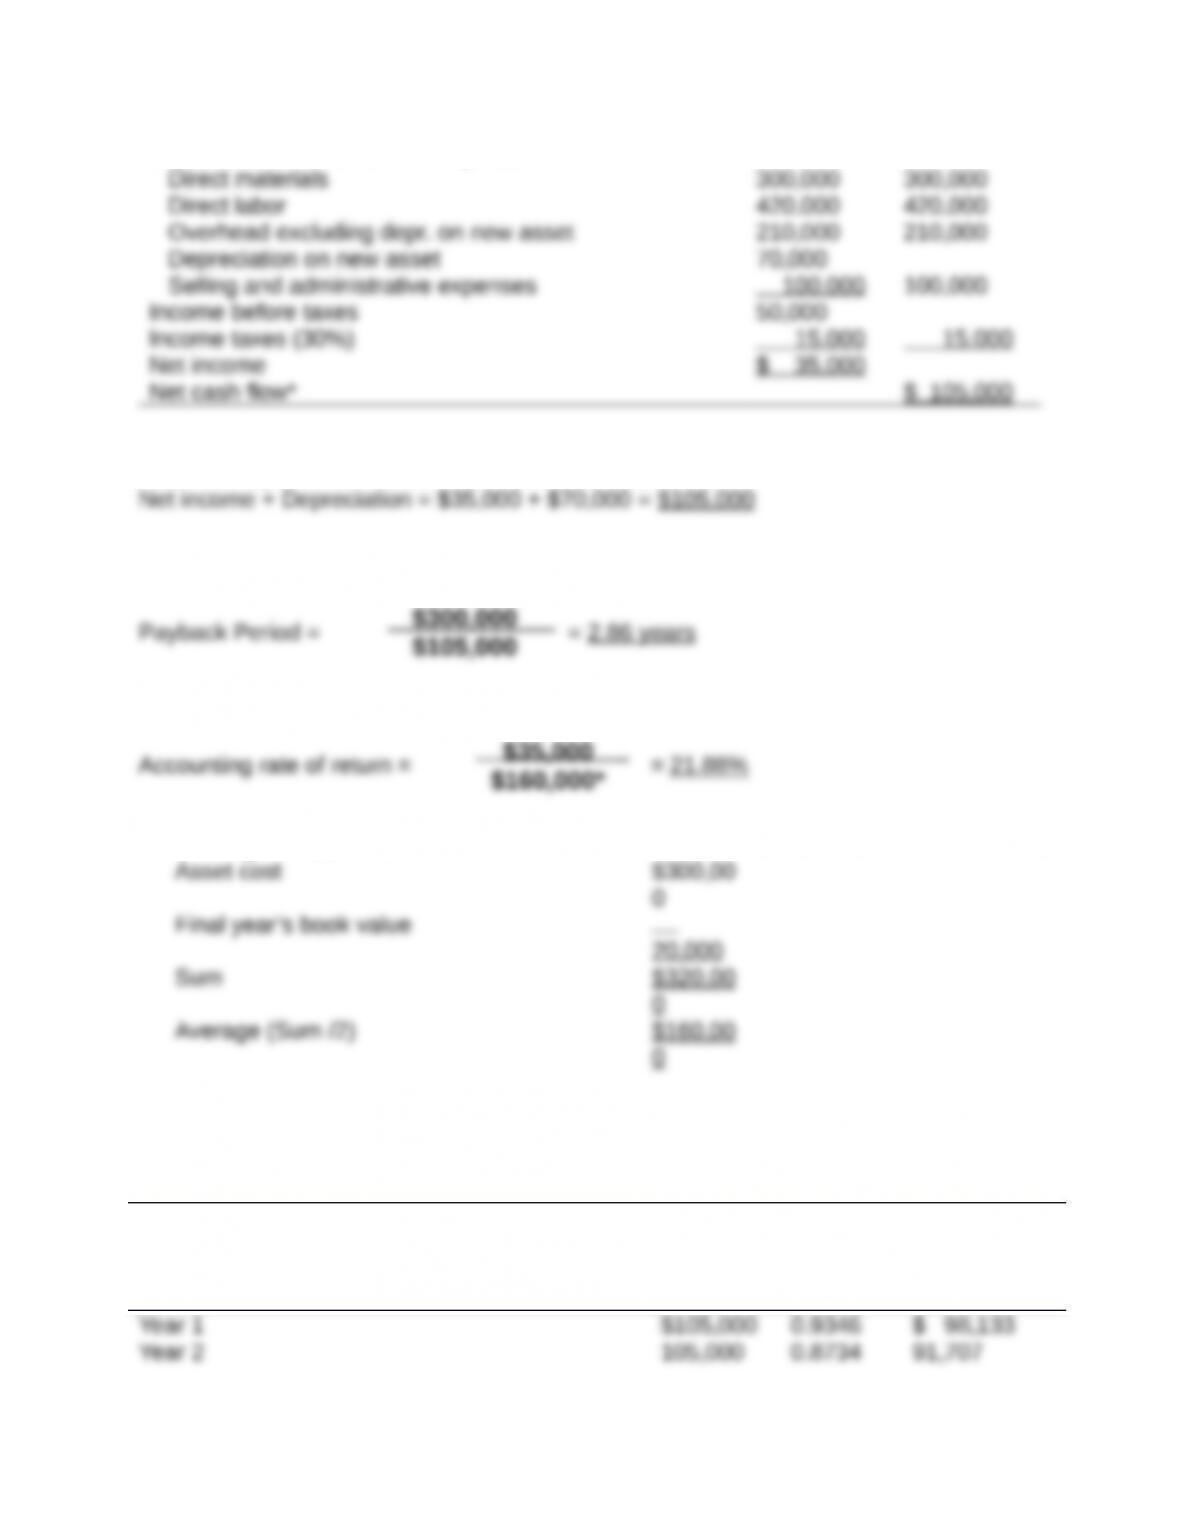
Expected annual costs of new product
*Alternatively, annual net cash flow can be computed as:
Part 3
Part 4
*Average investment
Part 5
Present Value of Net Cash Flows
Present
Present Value of
Net Cash
Flows
Value of
1 at 7%
Net Cash
Flows
Year 1 $105,000 0.9346 $ 98,133
Year 2 105,000 0.8734 91,707
$35,000
$160,000*
$300,000
$105,000
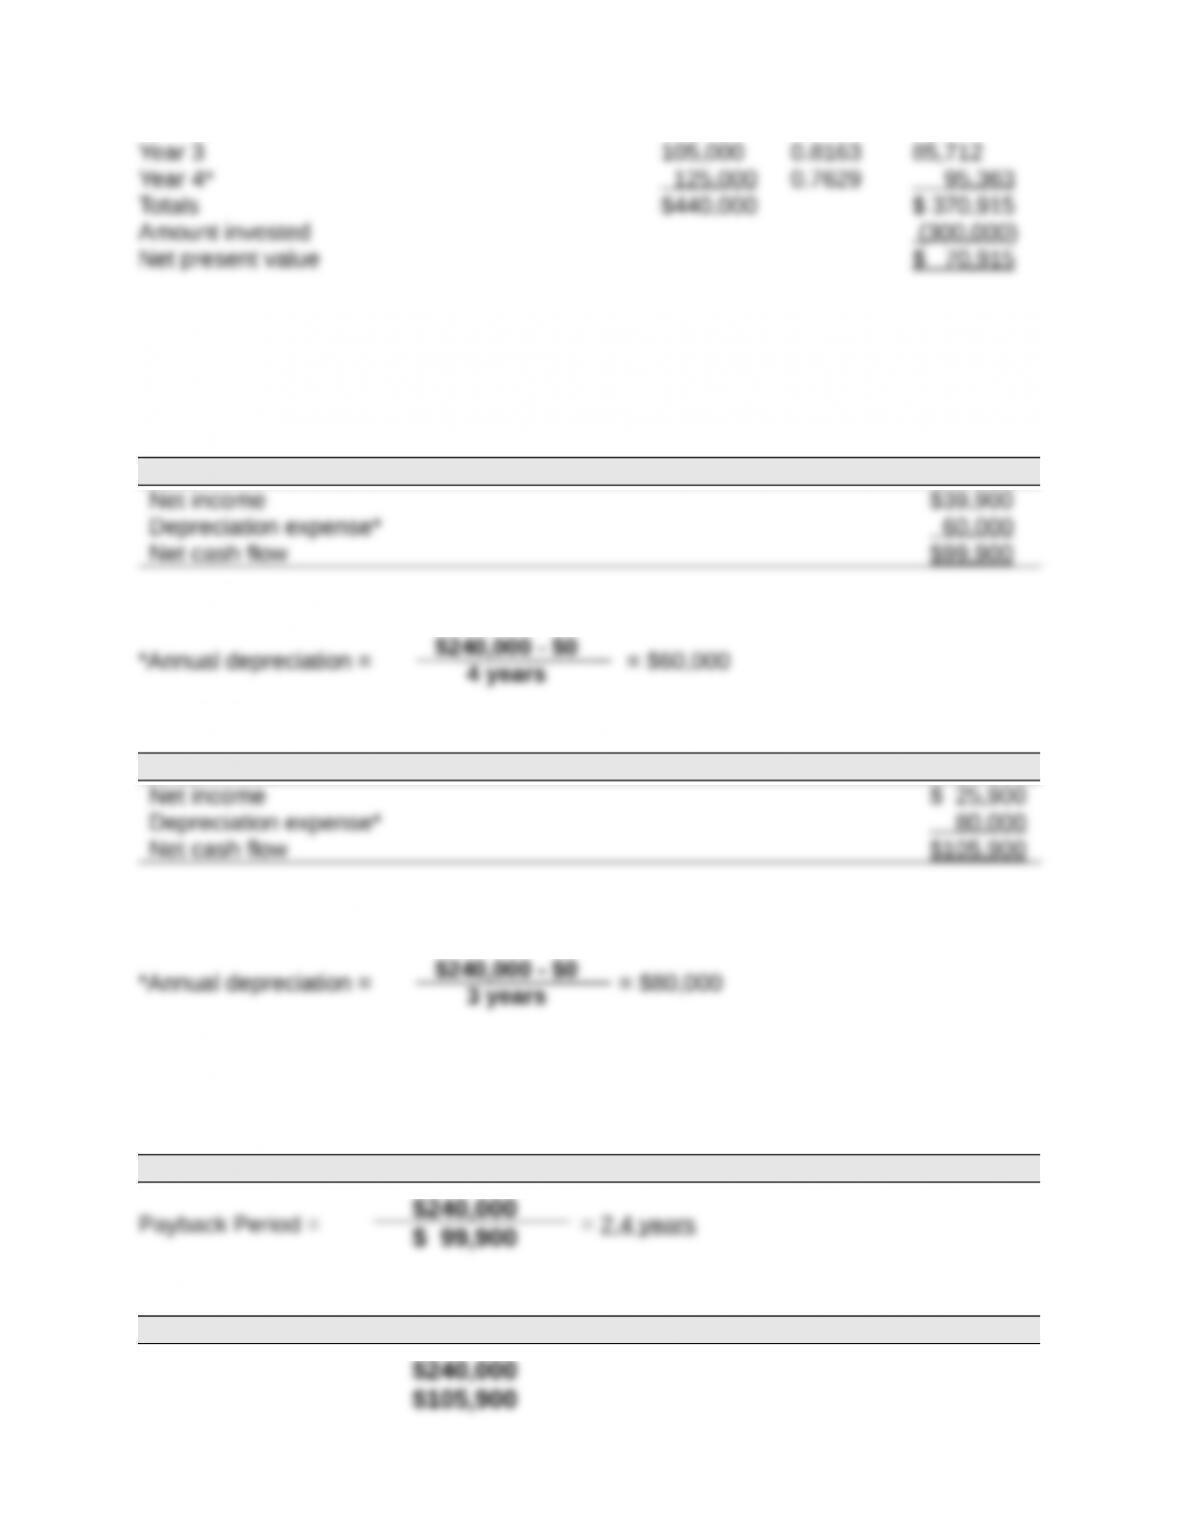
* Year 4’s cash flow includes the $20,000 salvage value.
Problem 25-2B
QA_Ori:
Part 1
PROJECT A
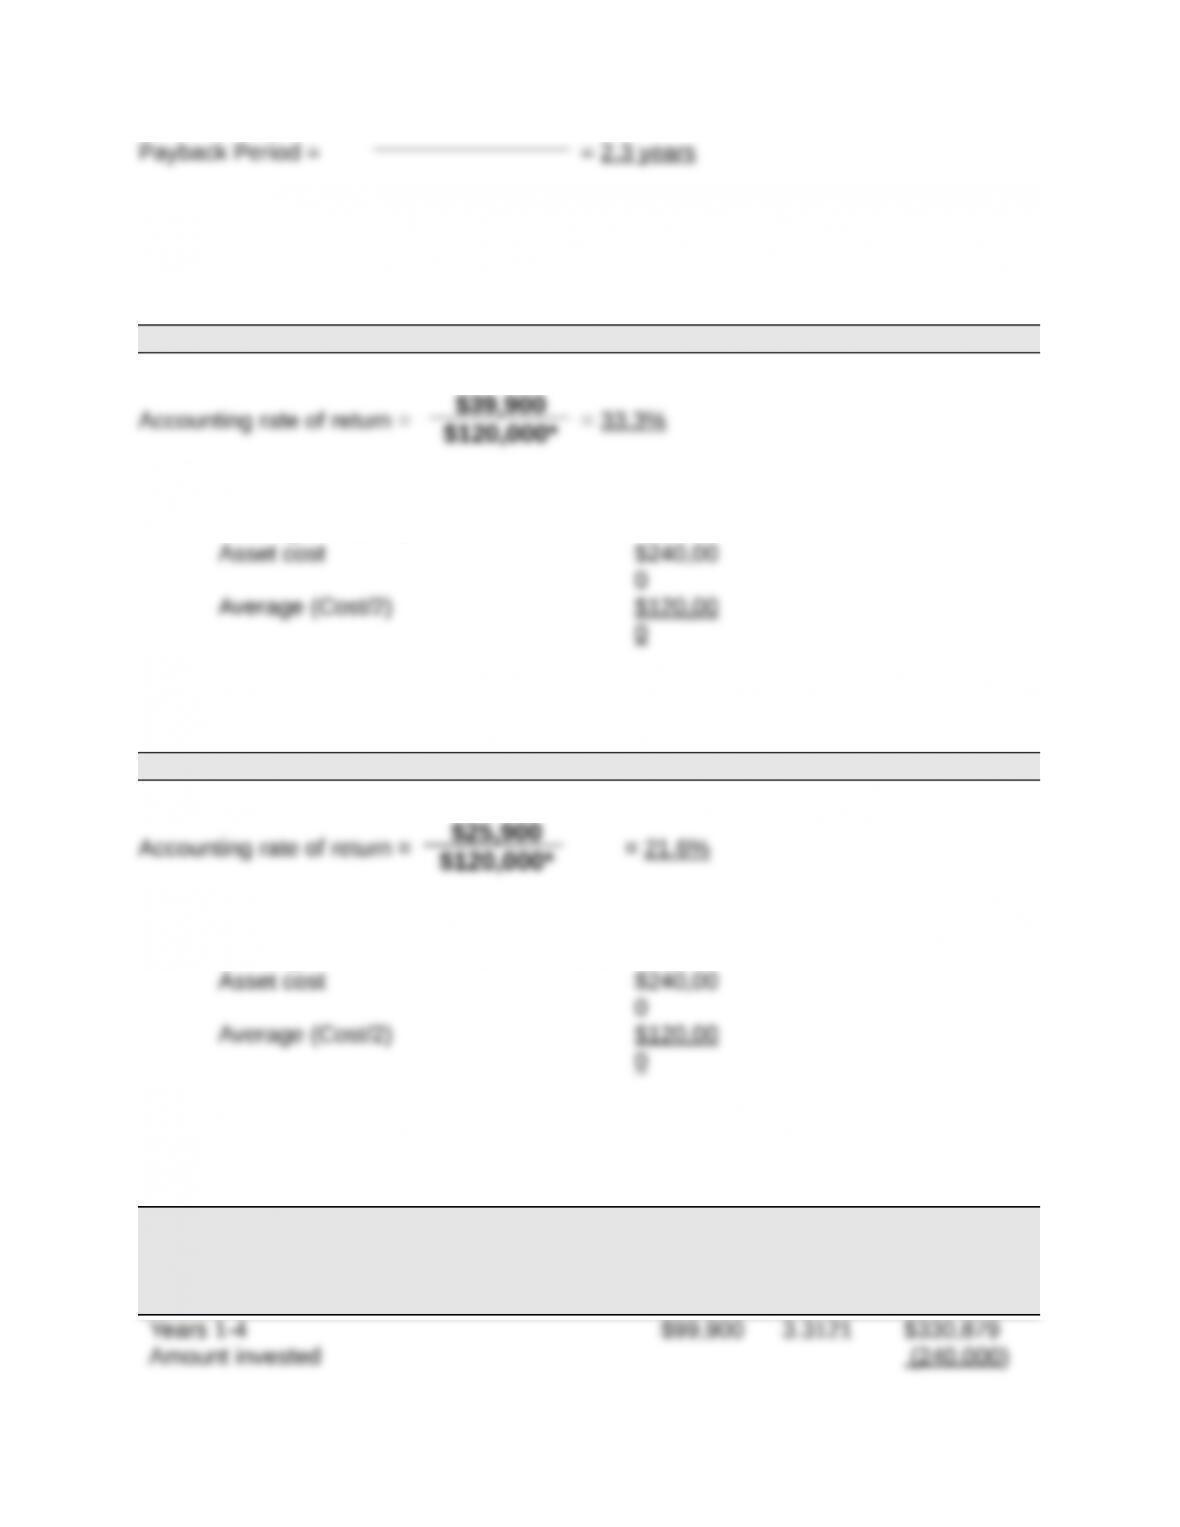
Part 3
PROJECT A
*Average investment
PROJECT B
*Average investment
Part 4
PROJECT A
Present Value of Net Cash Flows
Present Present
Value of Value of
Net Cash
Flows
1 at 8%
Annuity
Net Cash
Flows
Years 1-4 $99,900 3.3121 $330,879
Amount invested (240,000)
$39,900
$120,000*
$25,900
$120,000*
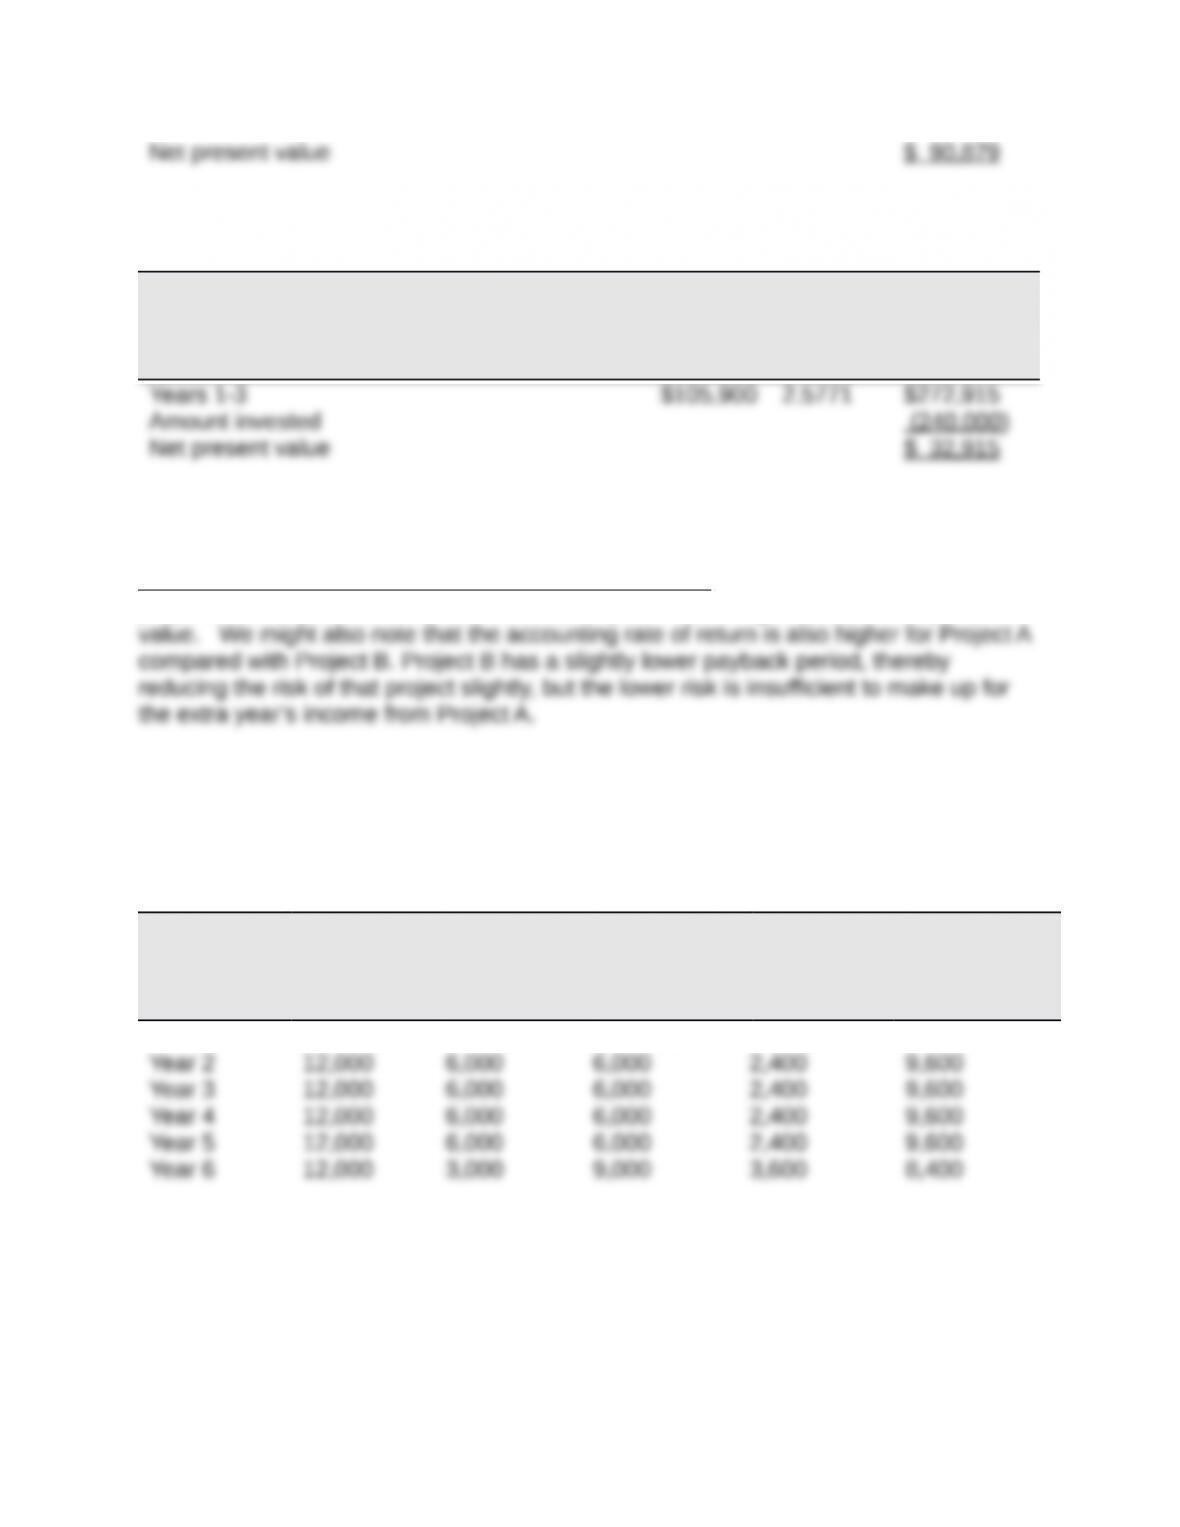
PROJECT B
Present Value of Net Cash Flows
Present Present
Value of Value of
Net Cash
Flows
1 at 8%
Annuity
Net Cash
Flows
Part 5
Recommendation to management is to pursue Project A. This is because although both
projects have a positive net present value, Project A has a higher positive net present
Title: Problem 25-3B
Part 1
RESULTS USING STRAIGHT-LINE DEPRECIATION
(a)
Income
Before
Deprec.
(b)
Straight-Line
Deprec.
(c)
Taxable
Income
(a) – (b)
(d)
40% Income
Taxes
(e)
Net Cash
Flows
(a) – (d)
Year 1 $12,000 $3,000 $ 9,000 $3,600 $8,400
Part 2
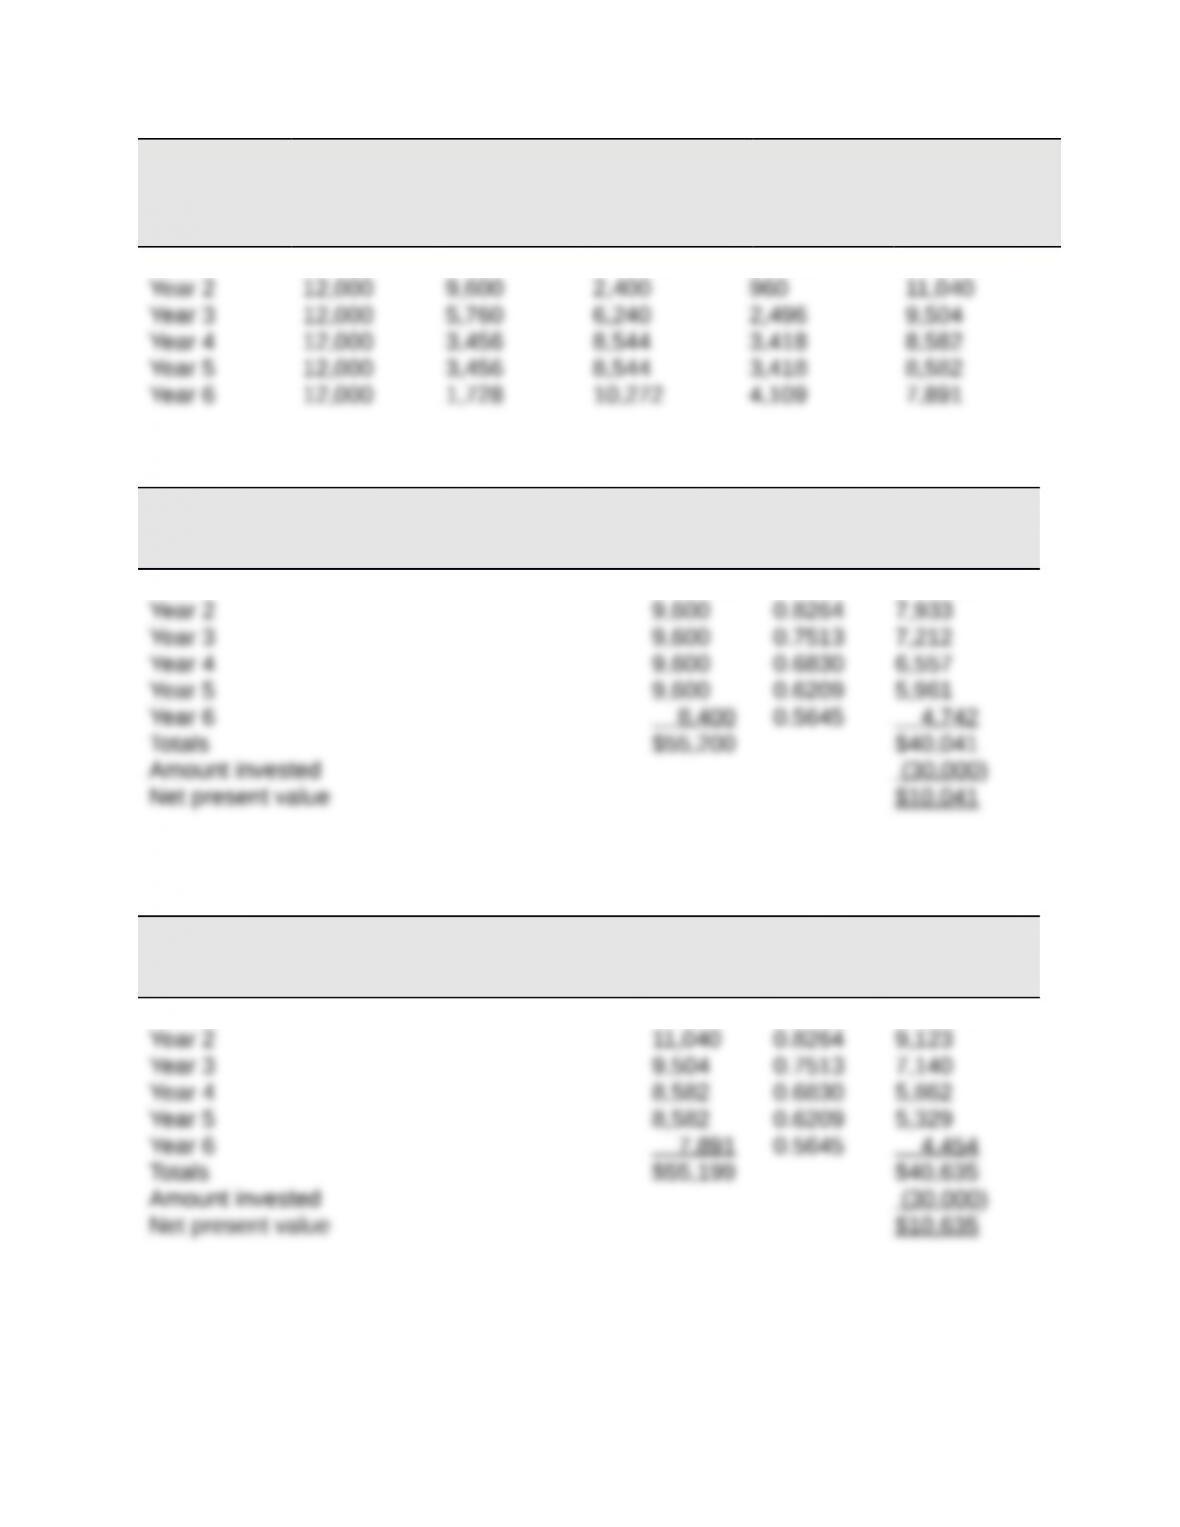
RESULTS USING MACRS DEPRECIATION
(a)
Income
Before
Deprec.
(b)
MACRS
Deprec.
(c)
Taxable
Income
(a) – (b)
(d)
40% Income
Taxes
(e)
Net Cash
Flows
(a) – (d)
Year 1 $12,000 $6,000 $ 6,000 $2,400 $ 9,600
Part 3
NET PRESENT VALUE OF ASSET USING STRAIGHT-LINE DEPRECIATION
Present Present
Net Cash Value of Value of Net
Flows 1 at 10% Cash Flows
Year 1 $ 8,400 0.9091 $ 7,636
Part 4
NET PRESENT VALUE OF ASSET USING MACRS DEPRECIATION
Present Present
Net Cash Value of Value of Net
Flows 1 at 10% Cash Flows
Year 1 $ 9,600 0.9091 $ 8,727
Part 5
Analysis: The net present value using MACRS depreciation is greater than the net
present value using straight-line depreciation because the cash flows are larger in the
earlier years of the asset’s life under MACRS depreciation. They are larger because the
depreciation deductions are larger, resulting in less income taxes paid in the earlier
years.