Title: Problem 25-2A
QA_Ori:
Part 1
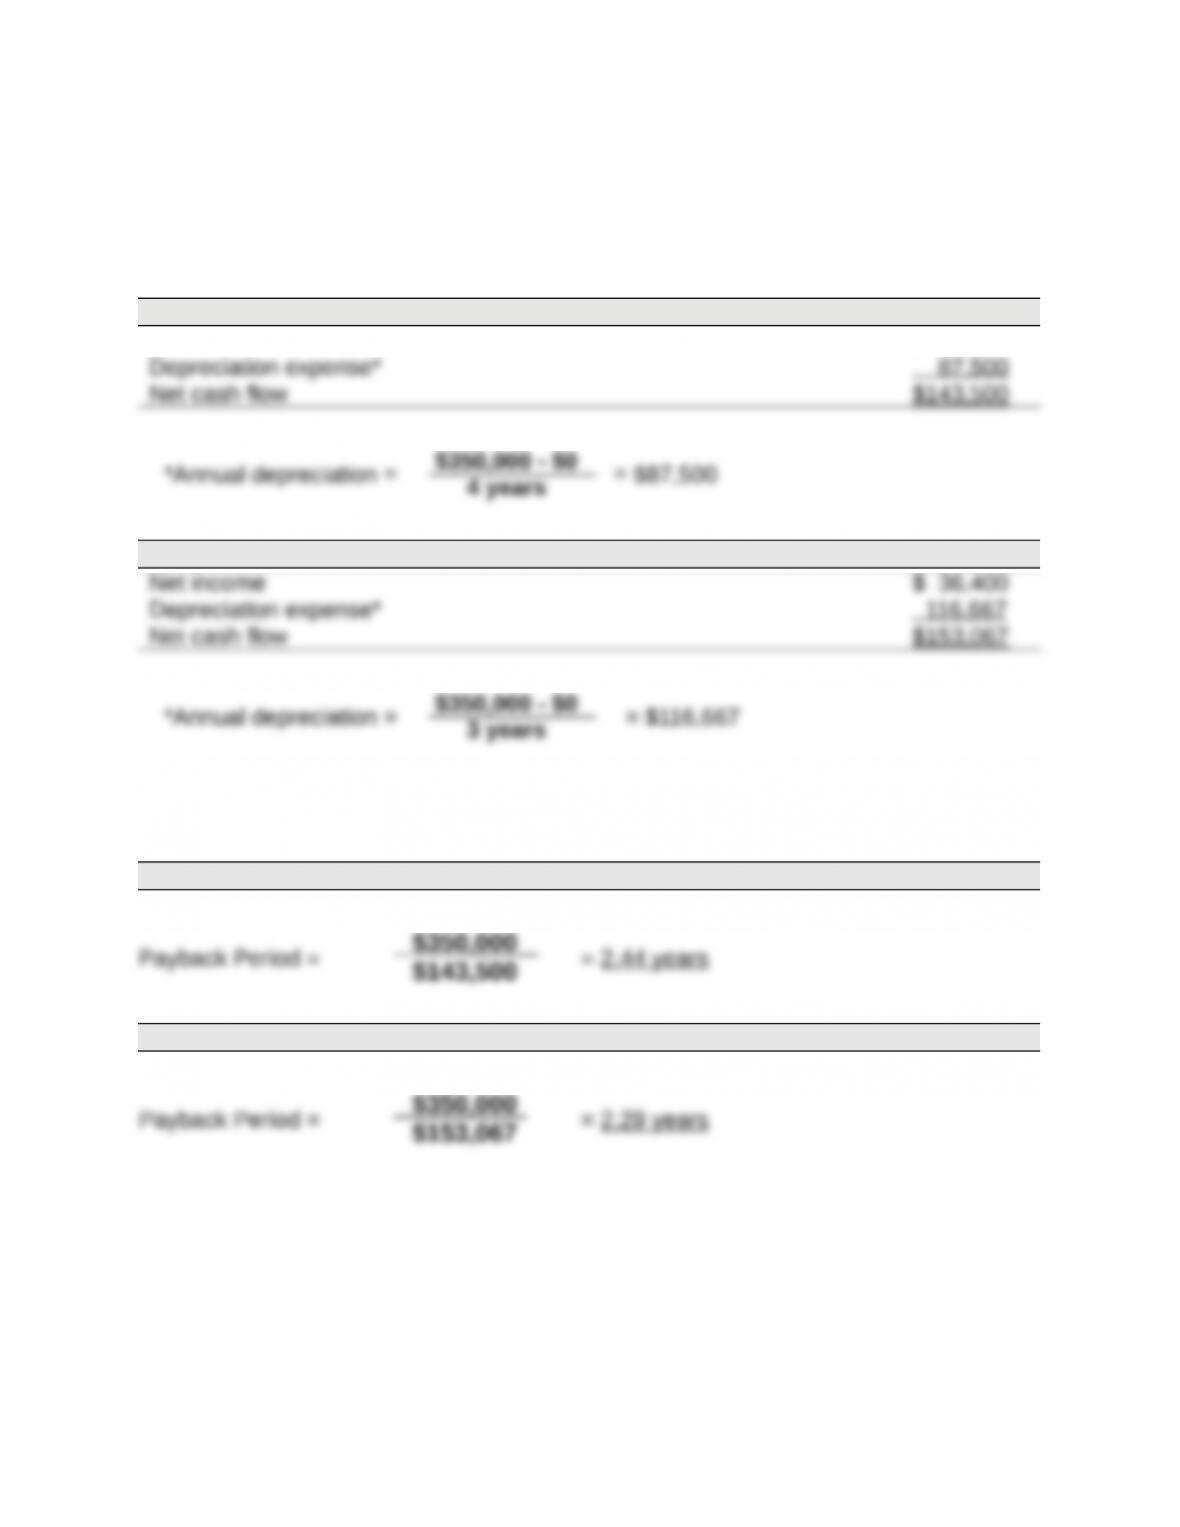
PROJECT Y
Net income $ 56,000
Title: Problem 25-2A
QA_Ori:
Part 3
PROJECT Y
*Average investment
PROJECT Z
*Average investment
Title: Problem 25-2A
QA_Ori:
Part 4
PROJECT Y
Present Value of Net Cash Flows
Present Present
Value of Value of
Net Cash
Flows
1 at 8%
Annuity
Net Cash
Flows
Years 1-4 $143,500 3.3121 $475,286
PROJECT Z
Present Value of Net Cash Flows
Present Present
Value of Value of
Net Cash
Flows
1 at 8%
Annuity
Net Cash
Flows
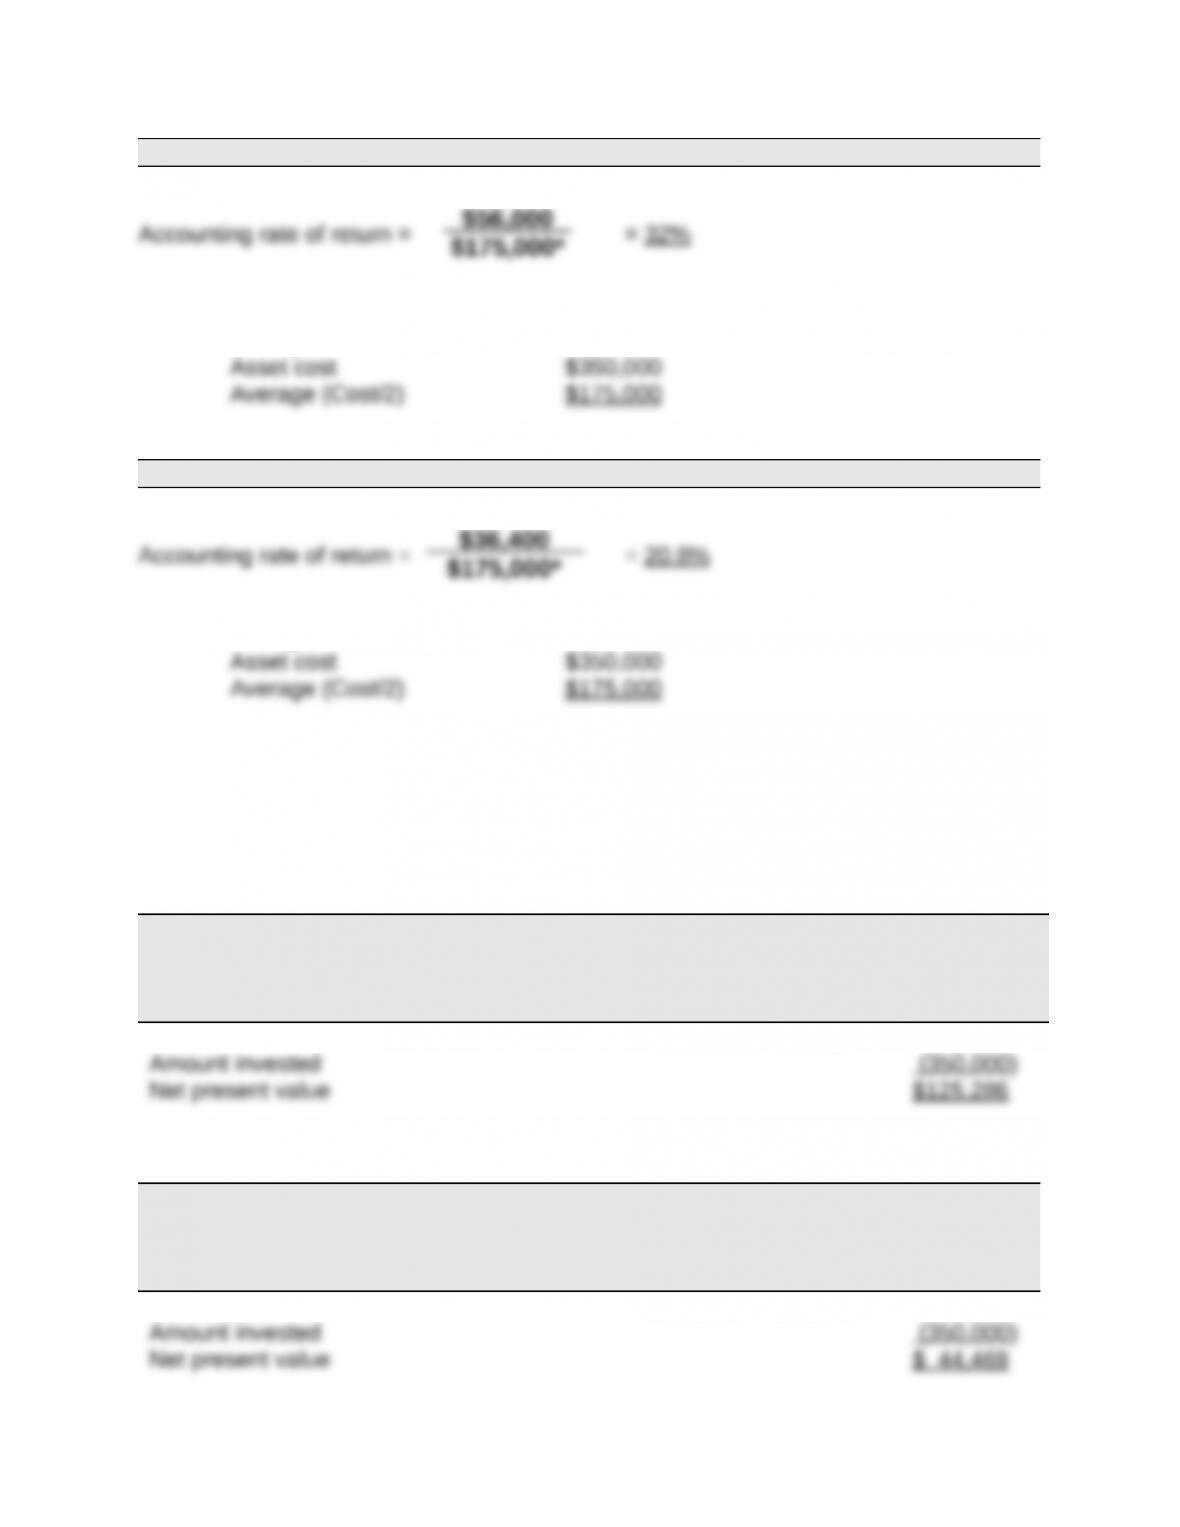
Years 1-3 $153,067 2.5771 $394,469
Amount invested (350,000)
Net present value $ 44,469
$56,000
$175,000*
$36,400
$175,000*
Part 5
Recommendation to management is to pursue Project Y. This is because Project Y has
a positive net present value, which means that we expect it to earn at least 8% on our
cash investment in the machine. Project Z also has a positive net present value, but its
Title: Problem 25-3A
QA_Ori:
Part 1
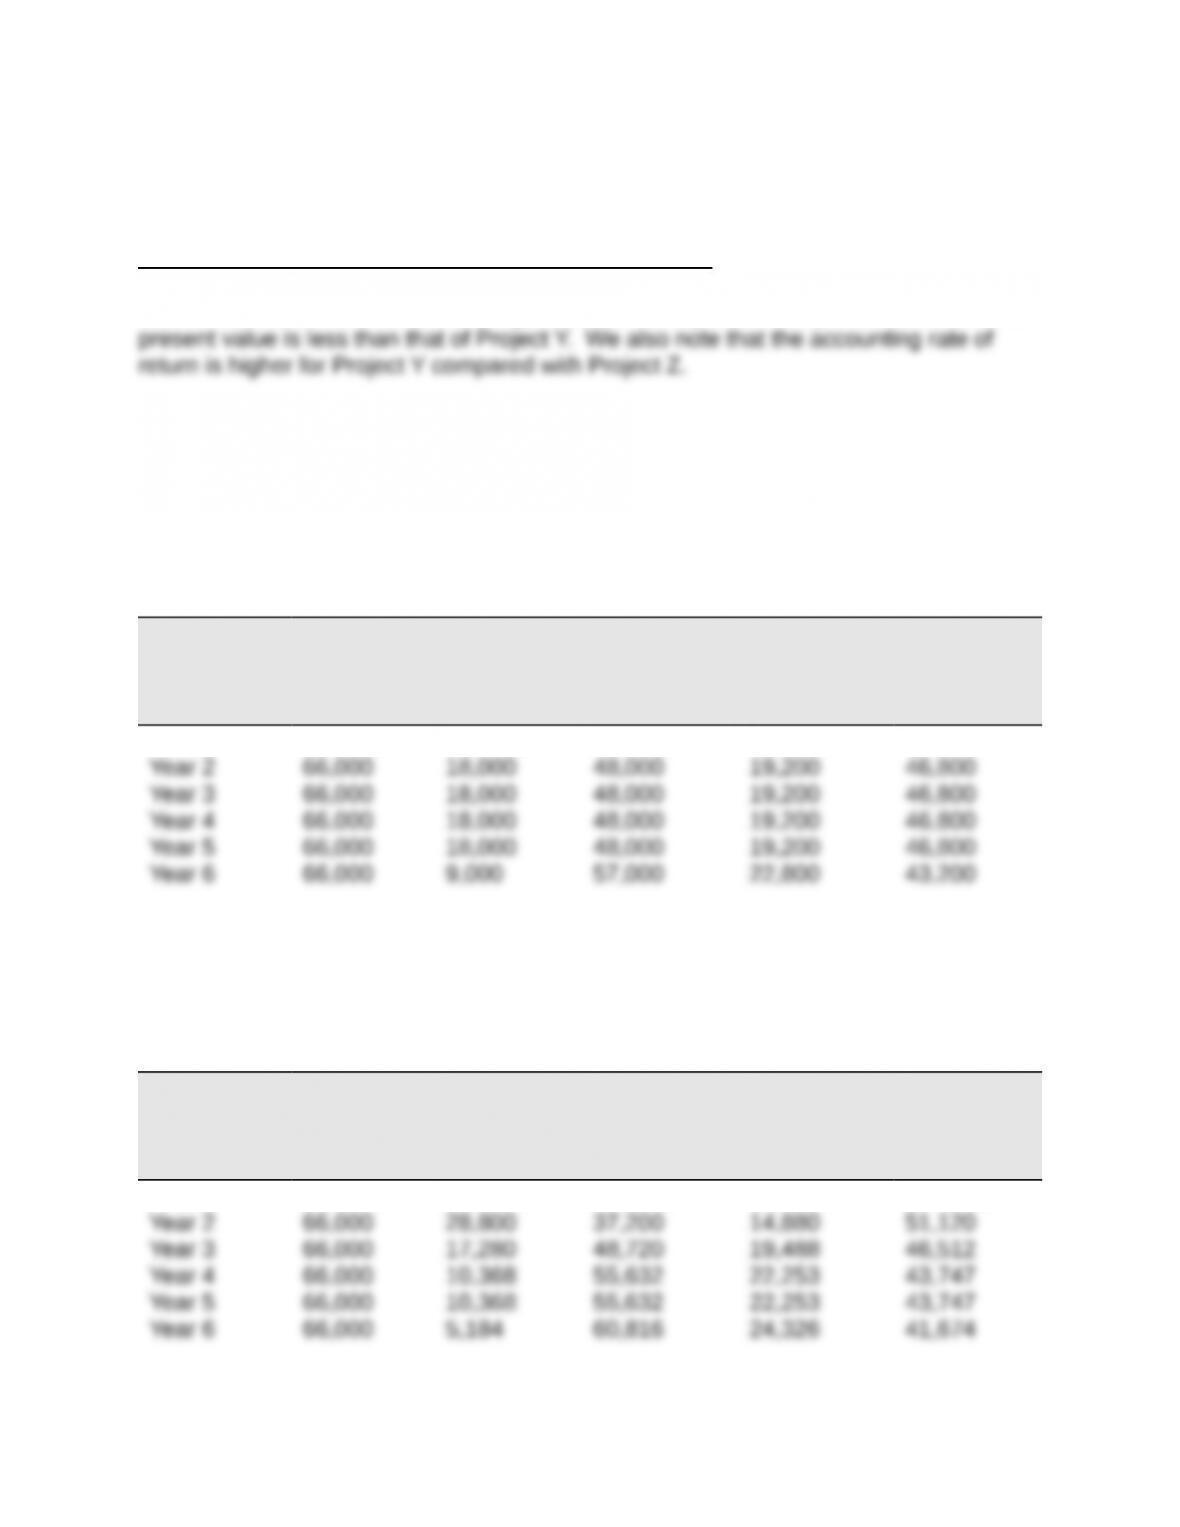
RESULTS USING STRAIGHT-LINE DEPRECIATION
(a)
Income
Before
Deprec.
(b)
Straight-Line
Deprec.
(c)
Taxable
Income
(a) – (b)
(d)
40% Income
Taxes
(e)
Net Cash
Flows
(a) – (d)
Year 1 $66,000 $ 9,000 $57,000 $22,800 $43,200
Part 2
RESULTS USING MACRS DEPRECIATION
(a)
Income
Before
Deprec.
(b)
MACRS
Deprec.
(c)
Taxable
Income
(a) – (b)
(d)
40% Income
Taxes
(e)
Net Cash
Flows
(a) – (d)
Year 1 $66,000 $18,000 $48,000 $19,200 $46,800
Part 3
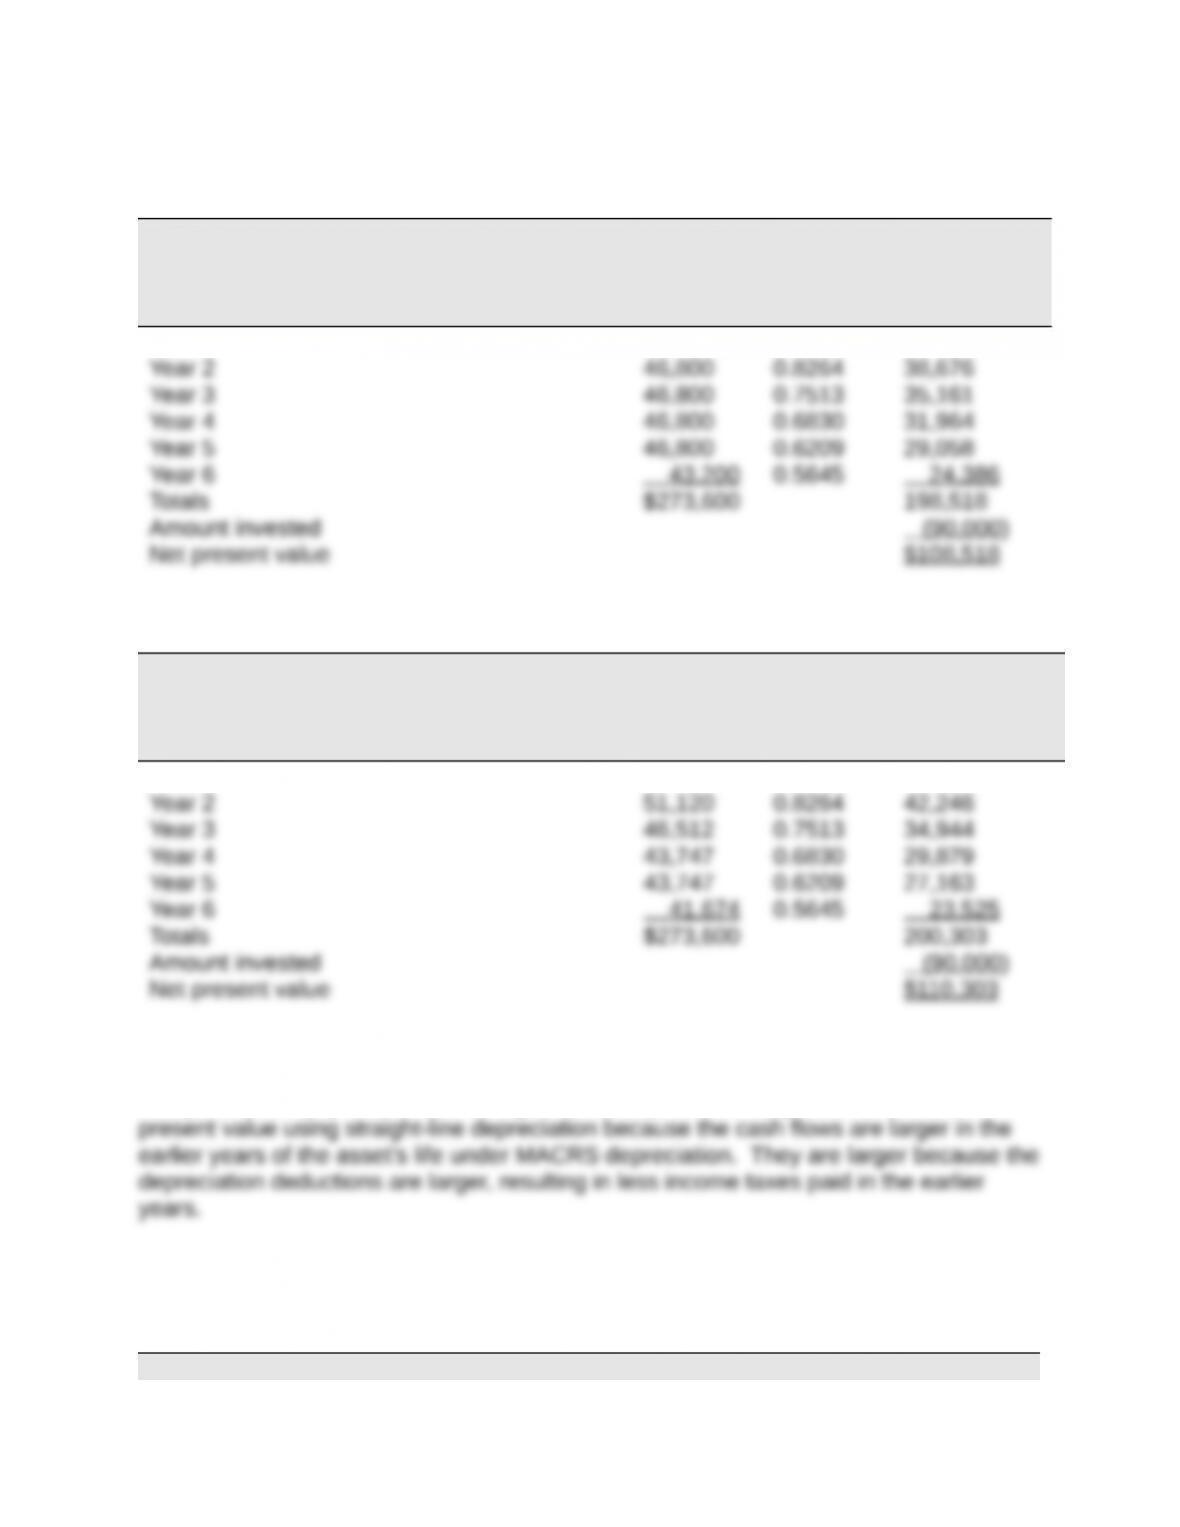
NET PRESENT VALUE OF ASSET USING STRAIGHT-LINE DEPRECIATION
Present
Present Value of
Net Cash
Flows
Value of
1 at 10%
Net Cash
Flows
Year 1 $ 43,200 0.9091 $ 39,273
Part 4
NET PRESENT VALUE OF ASSET USING MACRS DEPRECIATION
Present
Present Value of
Net Cash
Flows
Value of
1 at 10%
Net Cash
Flows
Year 1 $ 46,800 0.9091 $ 42,546
Part 5
Analysis: The net present value using MACRS depreciation is greater than the net
Title: Problem 25-4A
QA_Ori:
JONES PRODUCTS
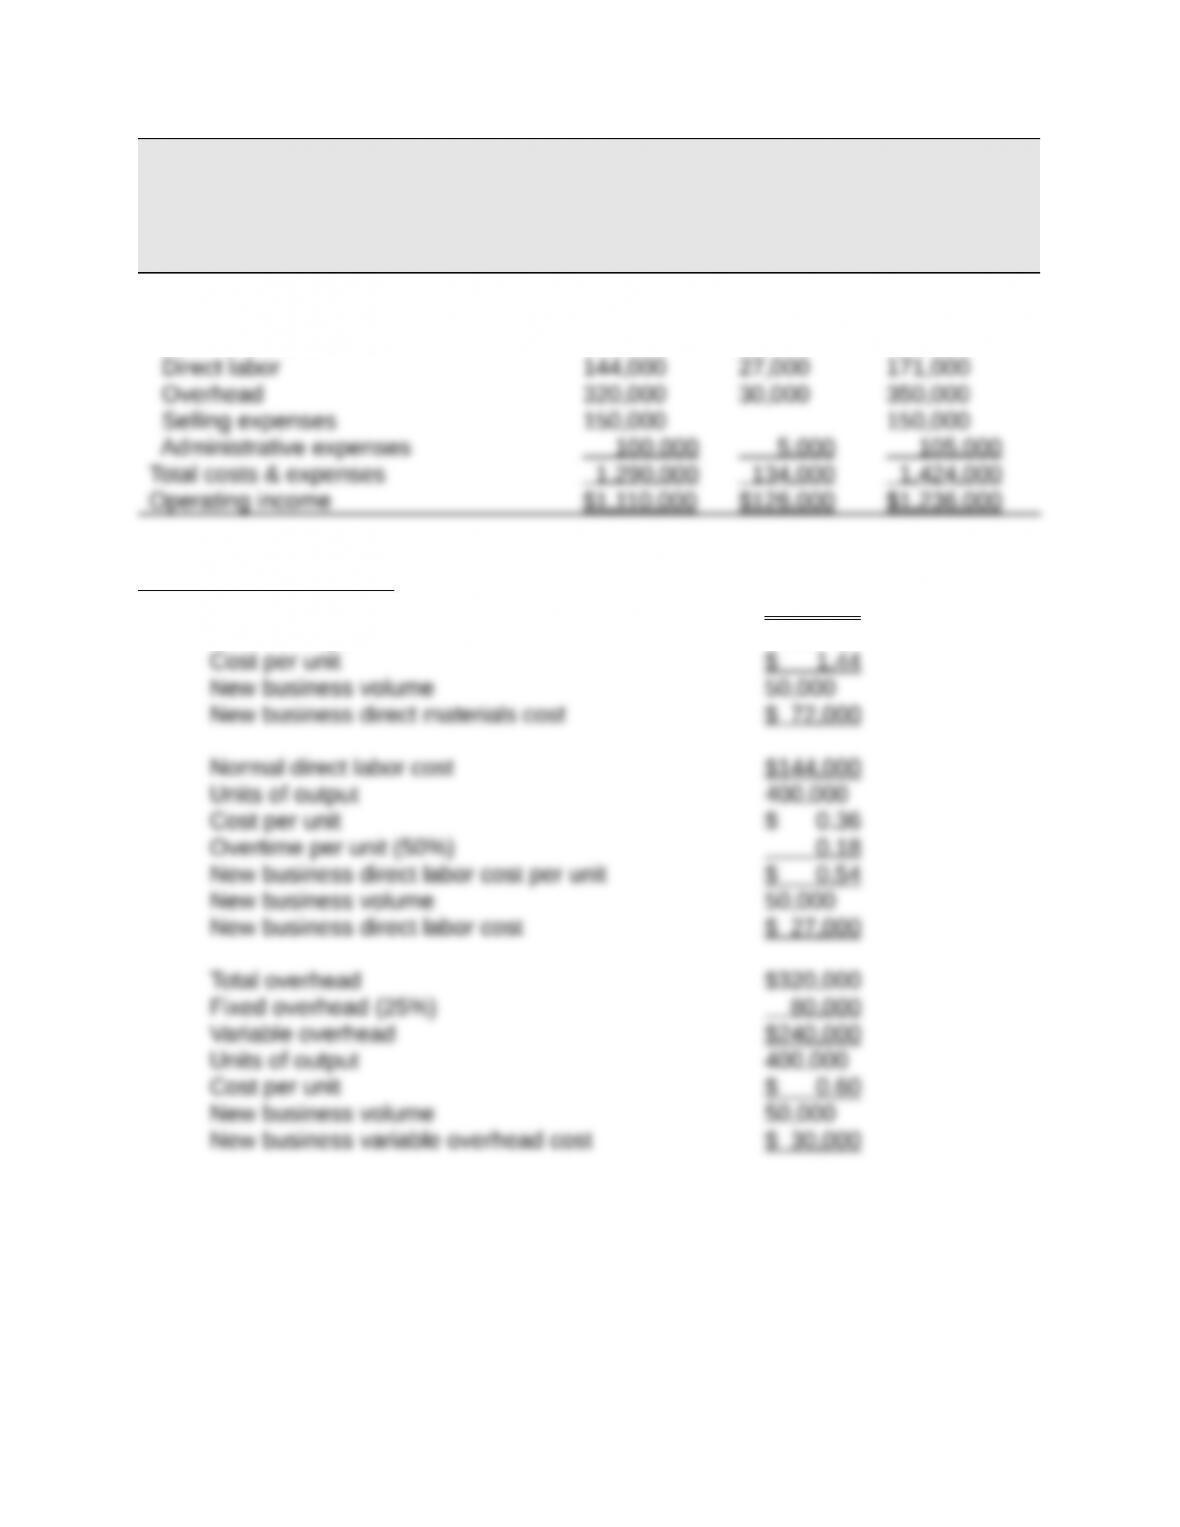
COMPARATIVE INCOME STATEMENTS
(1) (2) (3)
Normal New
Volume Business Combined
Sales $2,400,000 $260,000 $2,660,000
Costs and expenses
Direct materials 576,000 72,000 648,000
Supporting computations
Normal direct materials cost $576,000
Units of output 400,000
Title: Problem 25-5A
QA_Ori:
Part 1
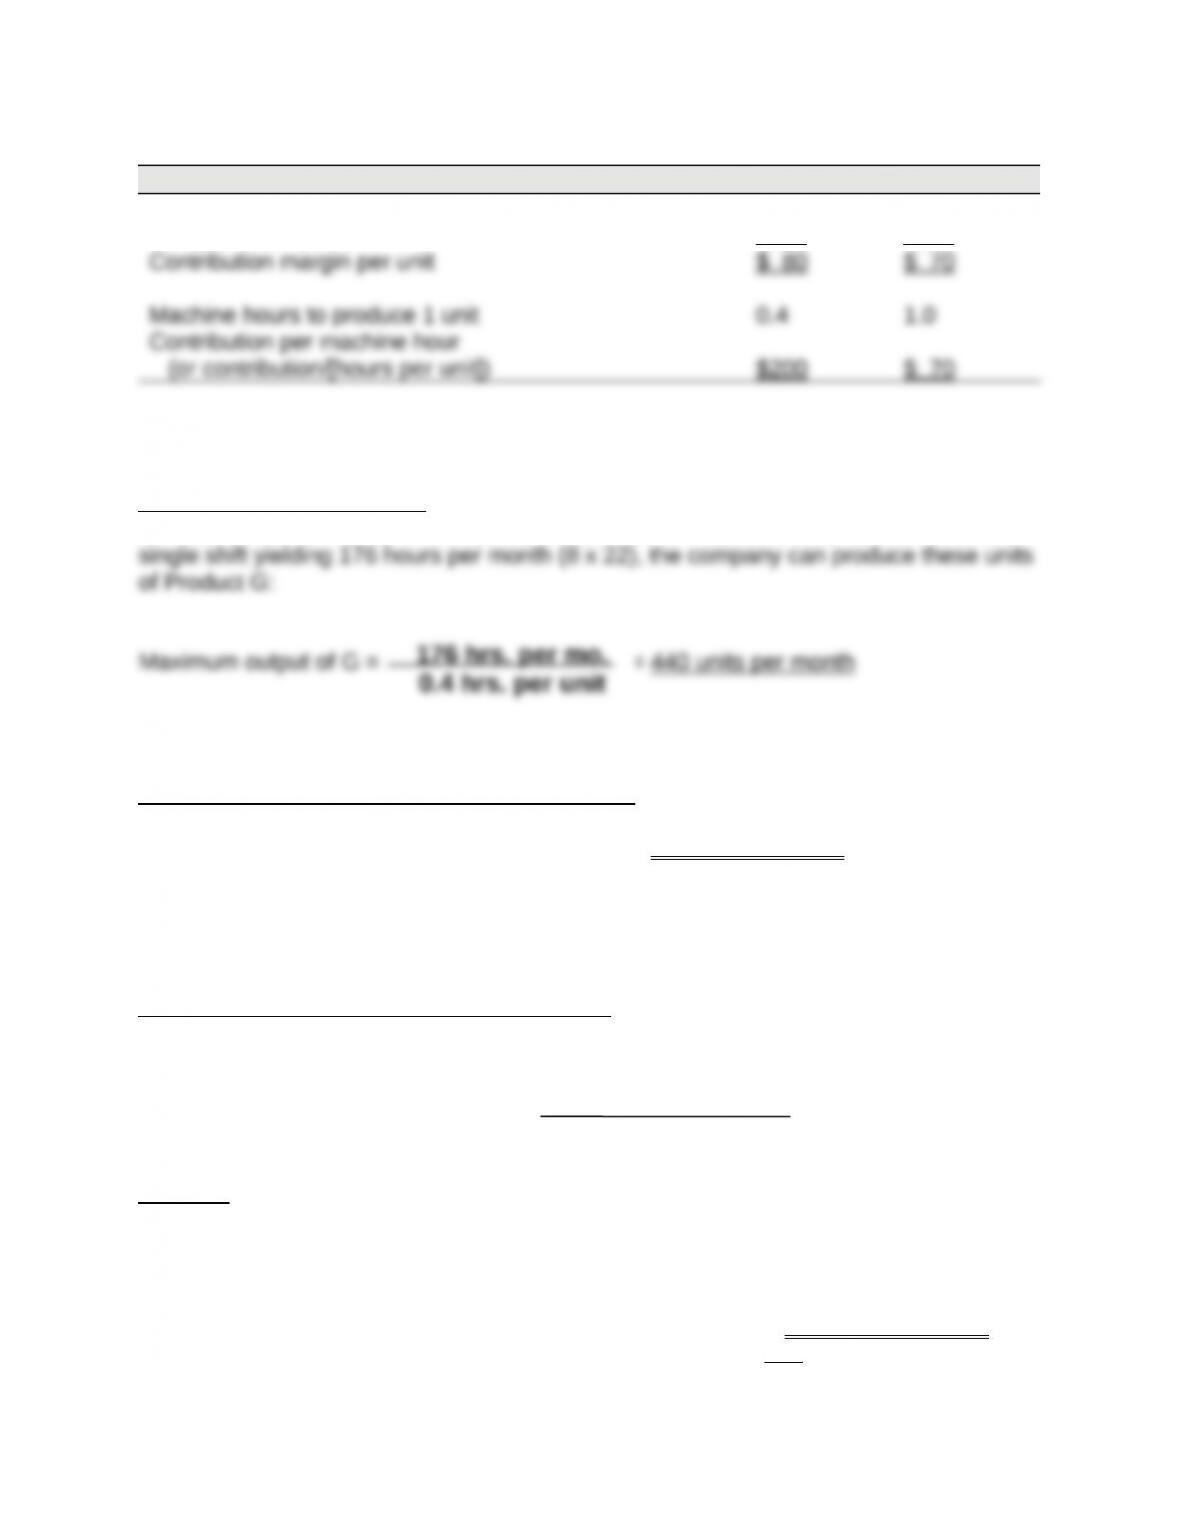
Product G Product B
Selling price per unit $120 $160
Variable costs per unit 40 90
Part 2
Sales Mix Recommendation. To the extent allowed by production and market
constraints, the company should produce as much of Product G as possible. With a
Contribution Margin at Recommended Sales Mix
Contribution margin = 440 units x $80 per unit = $35,200 per month
Part 3
Sales Mix Recommendation with Second Shift. If the second shift is added, the
maximum possible output of G will double
Maximum possible output of G = = 880 units per mo.
However, this level of output exceeds the company’s market constraint of 600 units of G
per month. This means the company should produce 600 units of Product G, and
commit the remainder of the productive capacity to Product B. This is computed as
follows
Units of Product G = 600 units per month
Hours per unit 0.4
352 hrs. per mo.
0.4 hrs. per unit
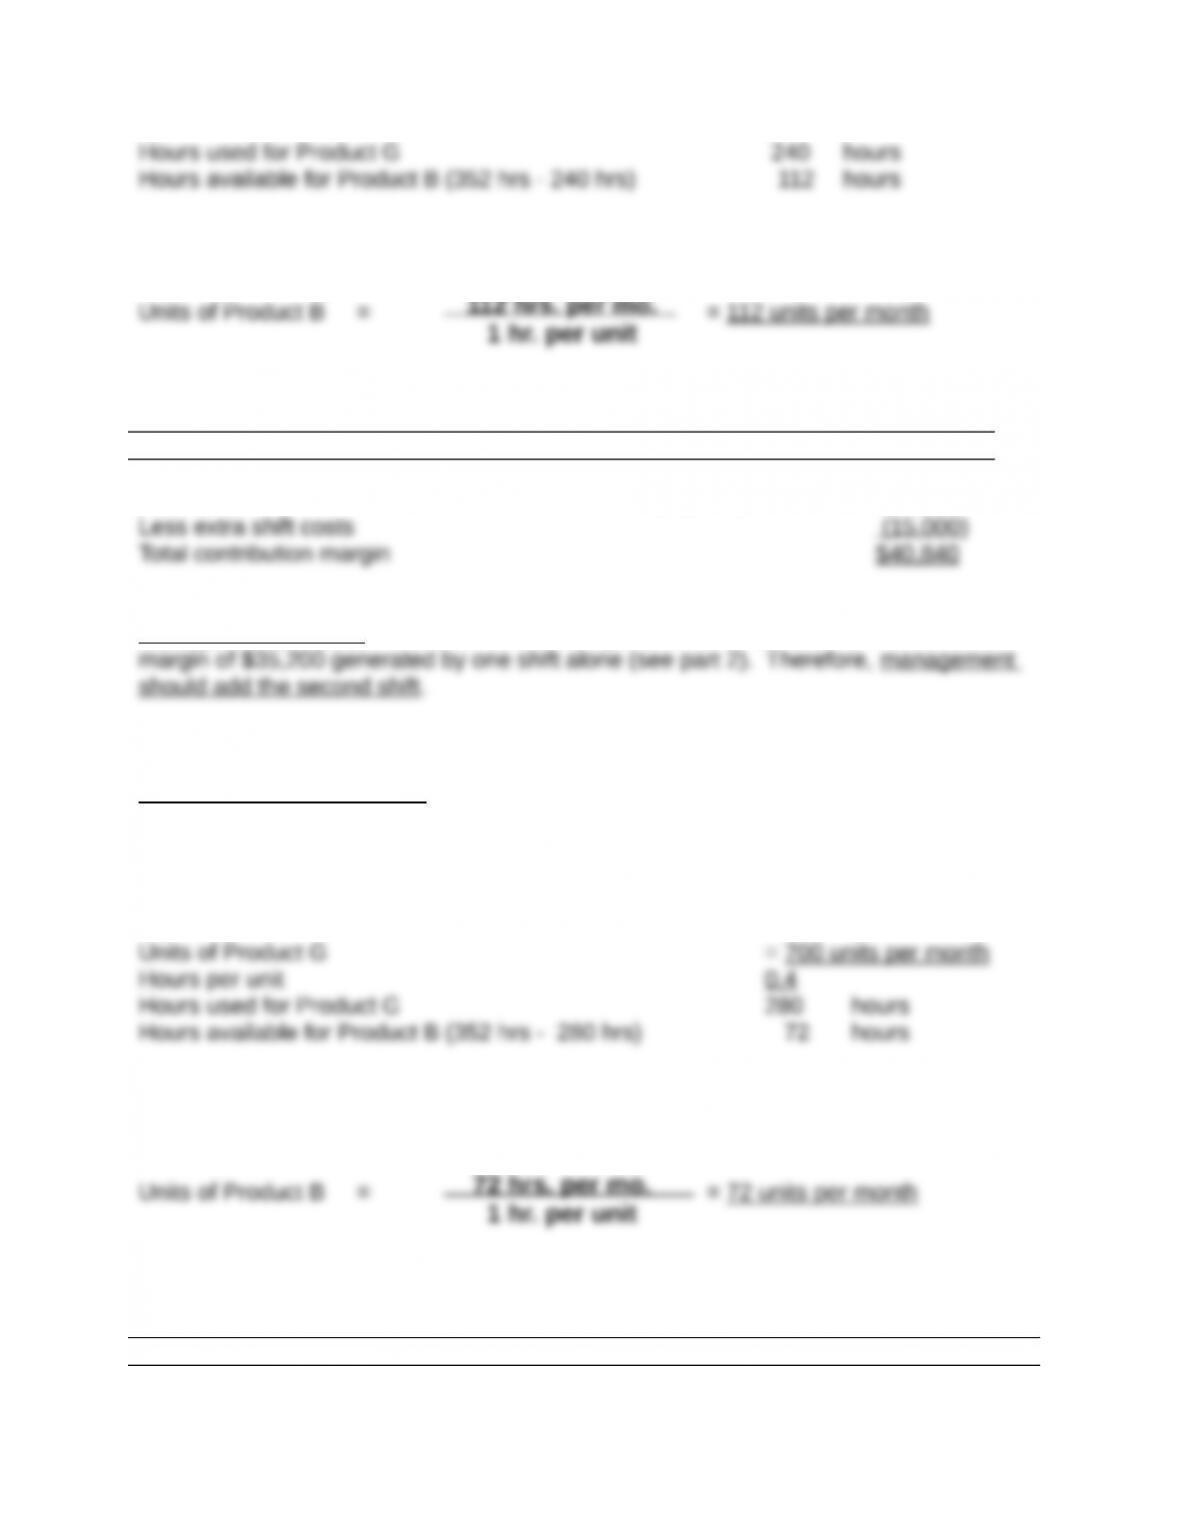
The output of Product B with 112 production hours is
Contribution Margin at This Sales Mix
Units Contr./unit Total
112 hrs. per mo.
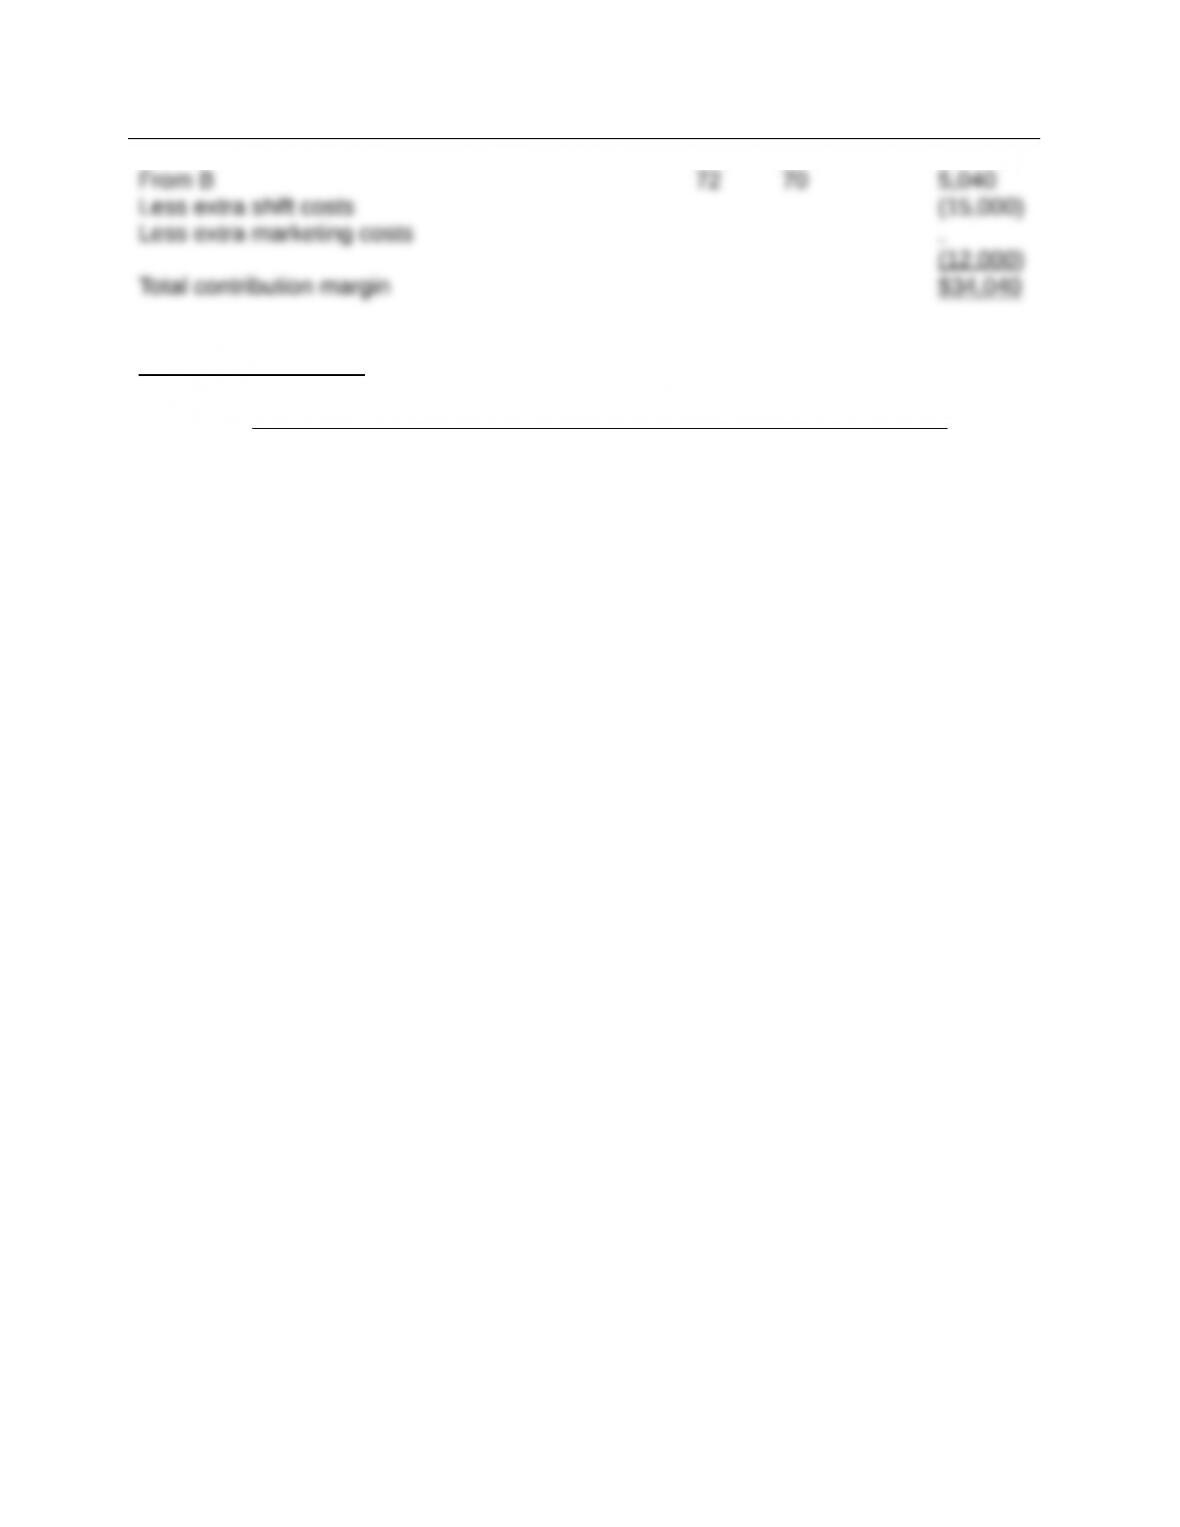
From G 700 $80 $56,000
Management decision. This contribution margin of $34,040 is less than the contribution
margin of $40,840 generated under the existing market constraint (see part 3).
Therefore, the marginal benefits generated do not warrant the marketing efforts.