Title: Exercise 25-7
QA_Ori:
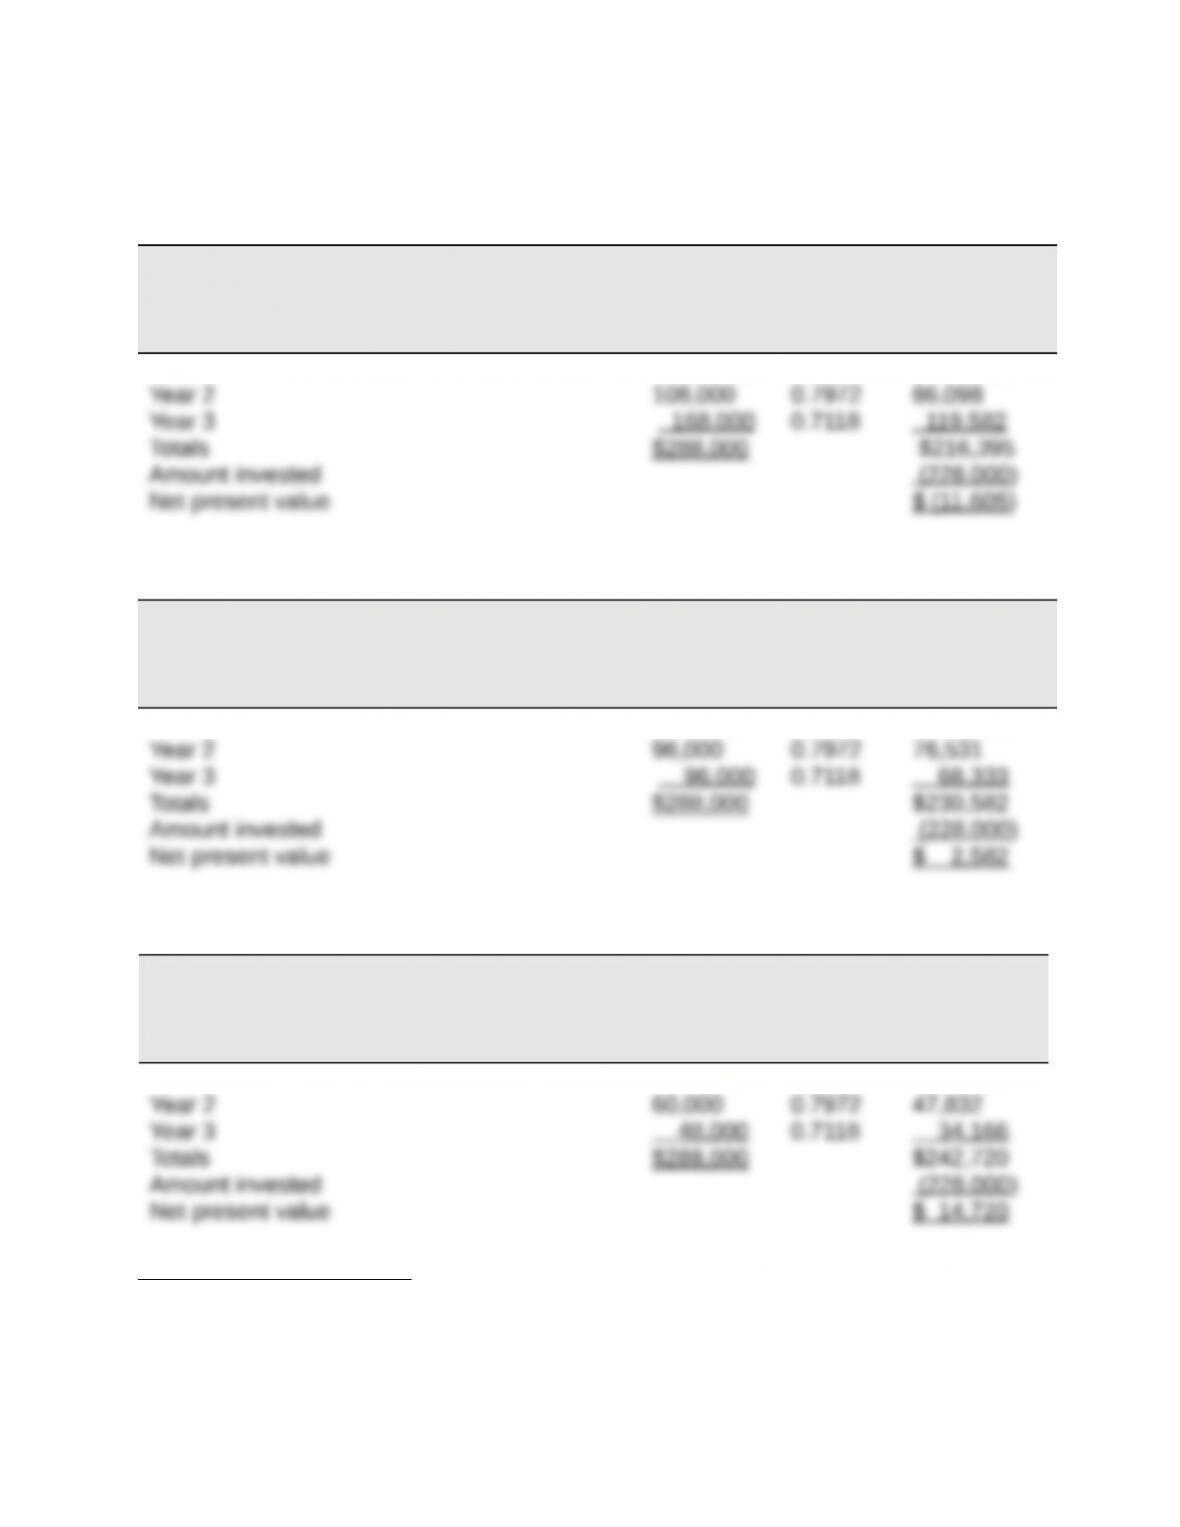
1.
PROJECT C1
Net Cash
Flows
Present
Value of
1 at 12%
Present
Value of Net
Cash Flows
Year 1 $ 12,000 0.8929 $ 10,715
PROJECT C2
Net Cash
Flows
Present
Value of
1 at 12%
Present
Value of Net
Cash Flows
Year 1 $ 96,000 0.8929 $ 85,718
PROJECT C3
Net Cash
Flows
Present
Value of
1 at 12%
Present
Value of Net
Cash Flows
Year 1 $180,000 0.8929 $160,722
Analysis and Interpretation: Both Project C2 and C3 yield a positive net present value.
Accordingly, both C2 and C3 are acceptable investments.
Title: Exercise 25-7
QA_Ori:
2. INTERNAL RATE OF RETURN VS. NET PRESENT VALUE FOR C2
Project C2 will have an internal rate of return higher than 12%.
We know this because Project C2 has a positive net present value using a 12% rate of
return.
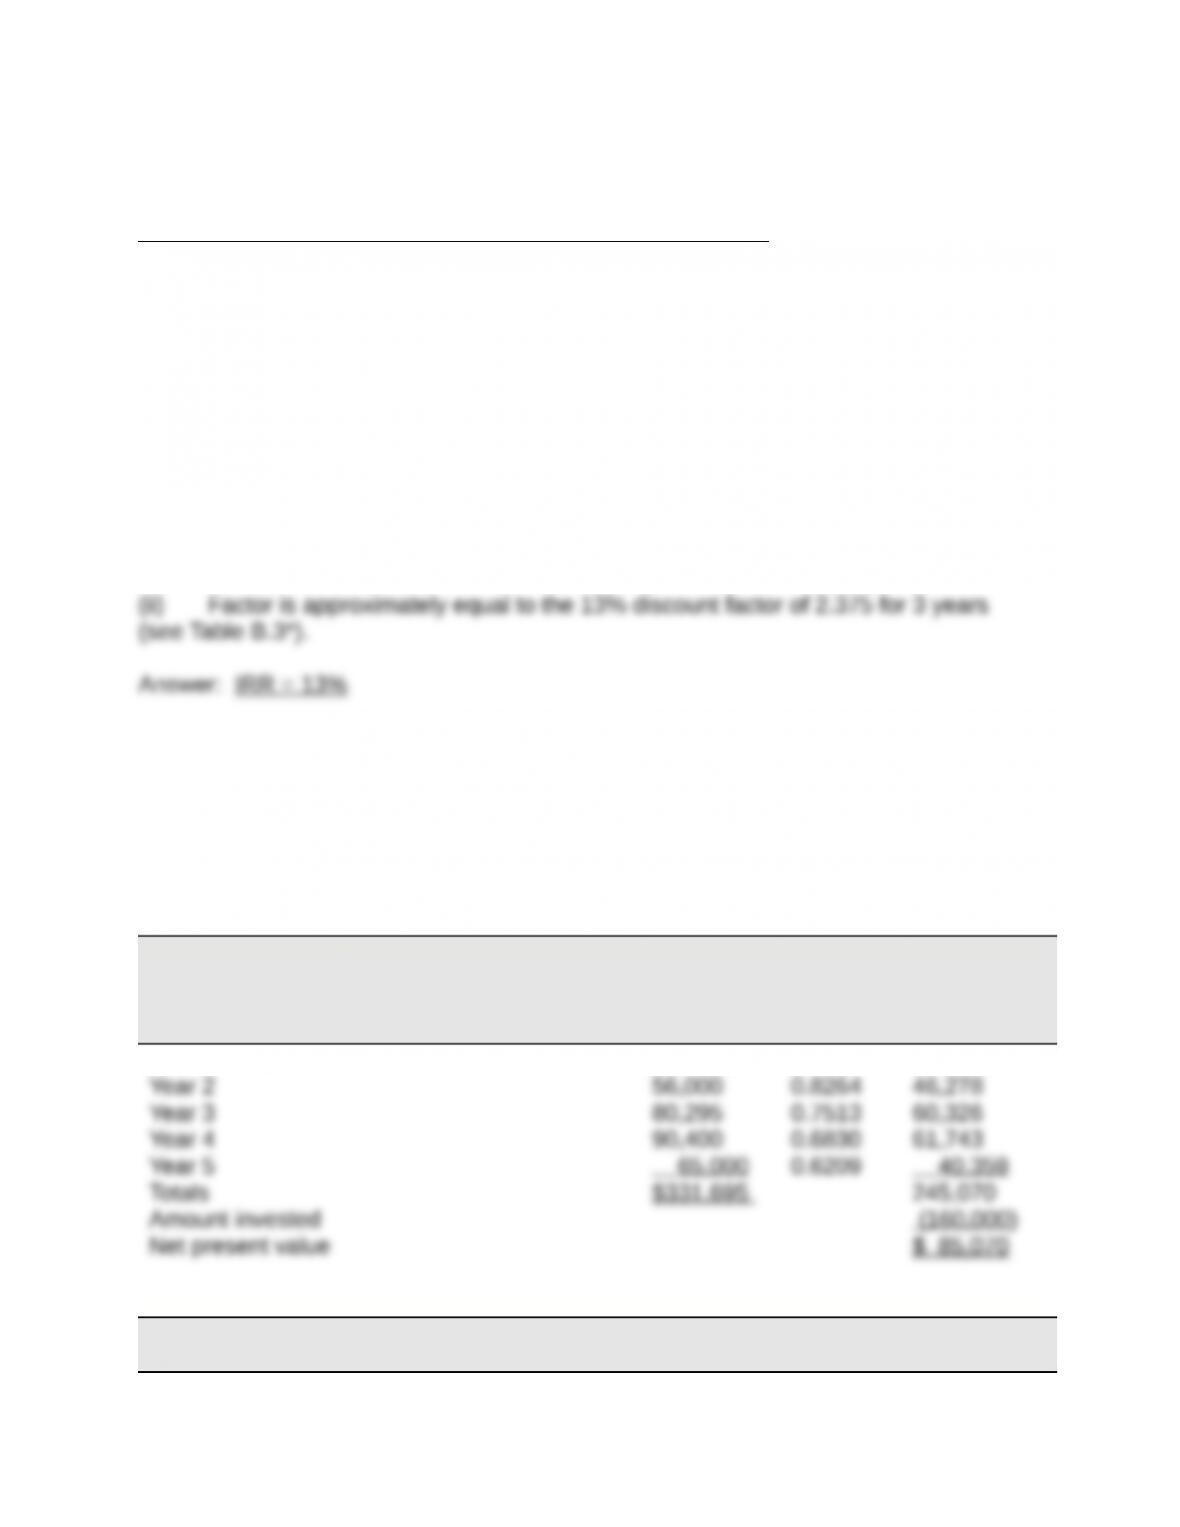
3. INTERNAL RATE OF RETURN FOR PROJECT C2
(i) Present value factor= Amount invested / Net cash flows
= $228,000 / $96,000 = 2.375
*Instructor note: There is not a 13% column in the PV tables; students will need to
interpolate —— 12% + [ (15%-12%) x ({2.4018 – 2.3750}/ 0.1186) ] = 12.68%.
Title: Exercise 25-8
QA_Ori:
PROJECT A
Net Cash
Flows
Present
Value of
1 at 10%
Present
Value of Net
Cash Flows
Year 1 $ 40,000 0.9091 $ 36,364
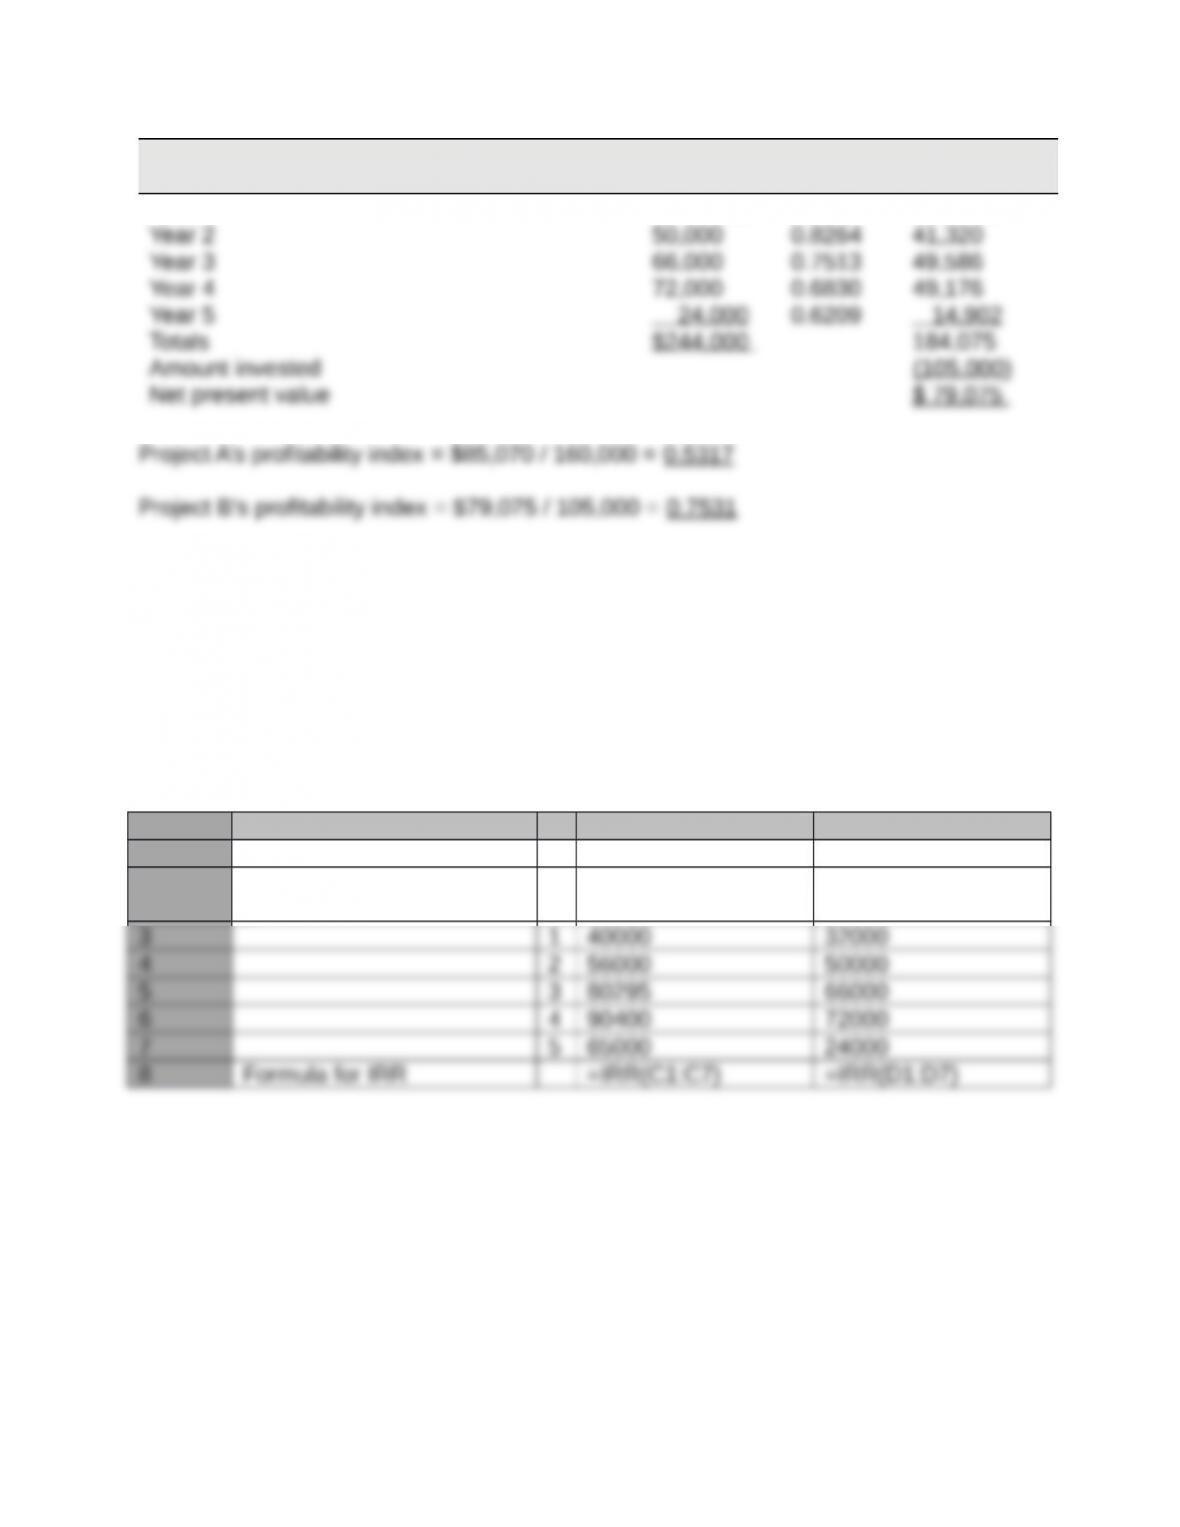
PROJECT B
Present
Present
Value of Net
Net Cash
Flows
Value of
1 at 10%
Cash Flows
Year 1 $ 32,000 0.9091 $ 29,091
Both projects have positive net present values. However, if the company can choose
only one project, it should select project B, since it has a higher profitability index.
Title: Exercise 25-9A
QA_Ori:
Using Excel, Project A (B) has an internal rate of return of 26.96 (35.00%).
Project A Project B
A B C D
1 Initial investment -160000 -105000
2Annual cash flows, end of
period
Title: Exercise 25-10
QA_Ori:
Sunk cost
Relevant benefits
Avoidable costs
Out-of-pocket cost
Opportunity cost
Title: Exercise 25-11
QA_Ori:
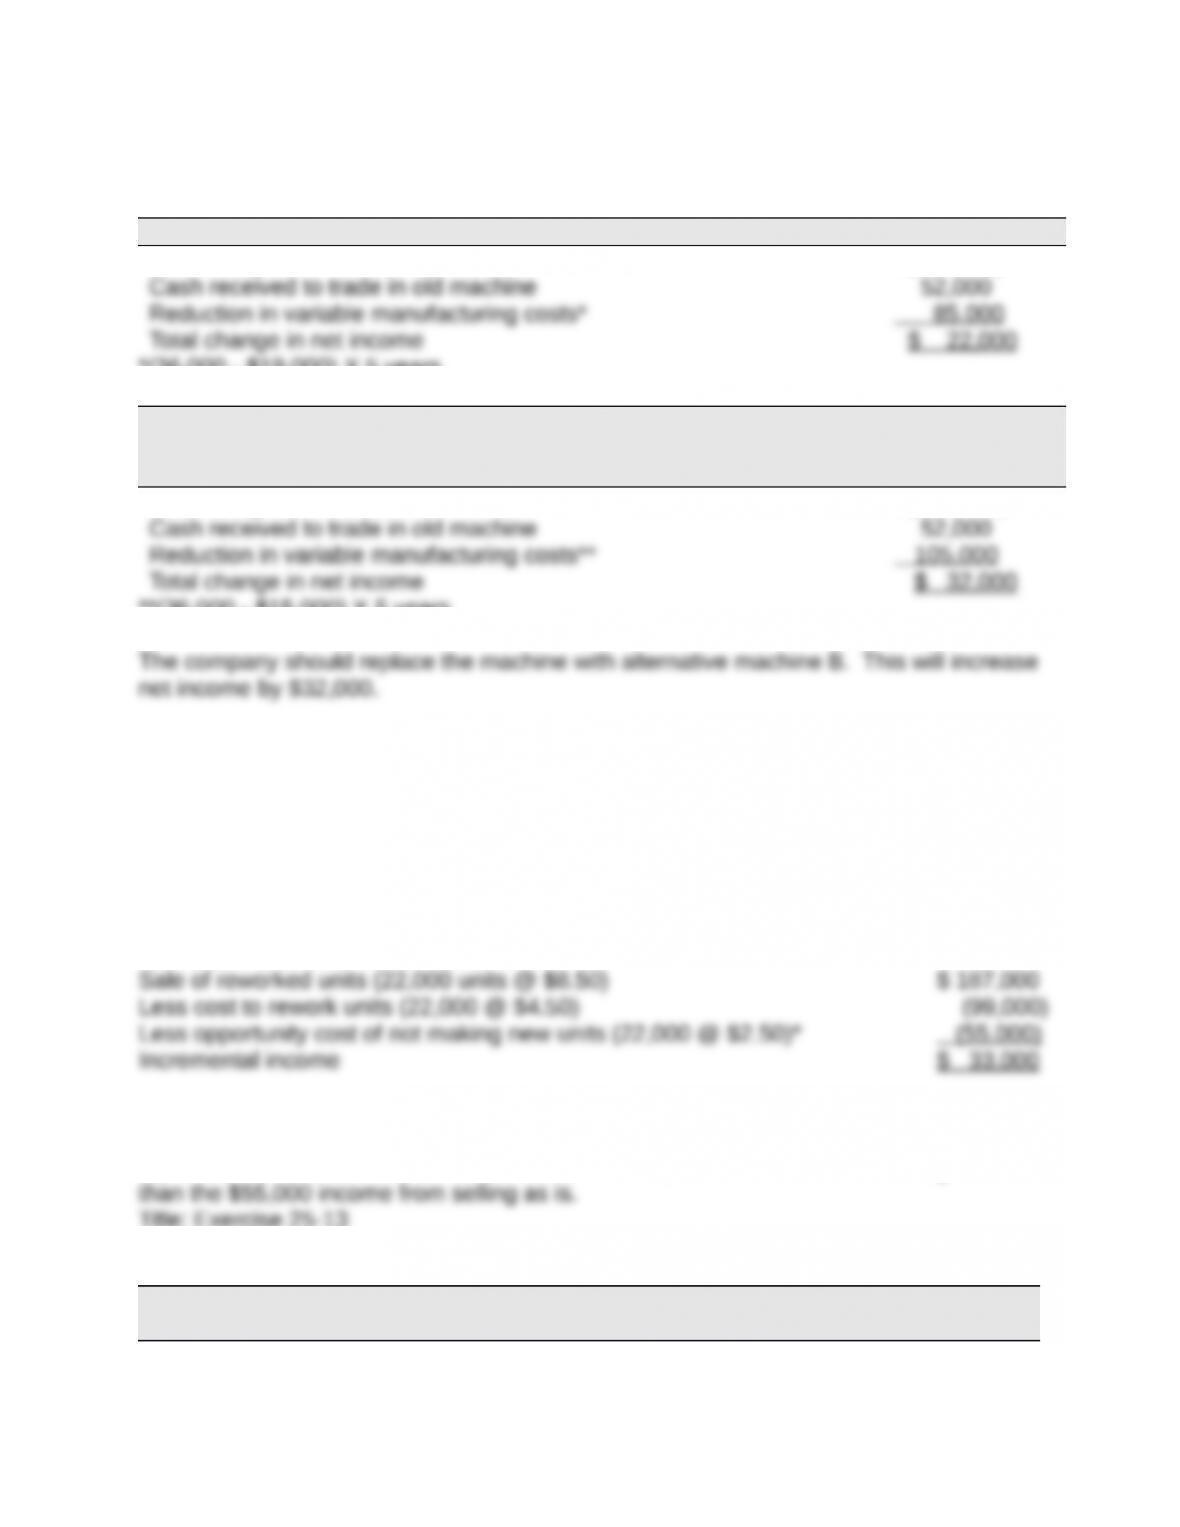
ALTERNATIVE A: INCREASE OR (DECREASE) IN NET INCOME
Cost to buy new machine $(115,000)
*(36,000 – $19,000) X 5 years
ALTERNATIVE B: INCREASE OR (DECREASE) IN NET INCOME
Cost to buy new machine $(125,000)
**(36,000 – $15,000) X 5 years
Title: Exercise 25-12
QA_Ori:
(1) The incremental income from selling as scrap is $55,000 (22,000 x $2.50).
(2)
INCREMENTAL INCOME FROM REWORK
*Sales price per unit – cost per unit = $8.50 – $6 = $2.50.
(3) The product should not be reworked as the $33,000 income from reworking is less
Title: Exercise 25-13
QA_Ori:
Normal Additional Combined
Volume Volume* Total
Sales $2,250,000 $180,000 $2,430,000
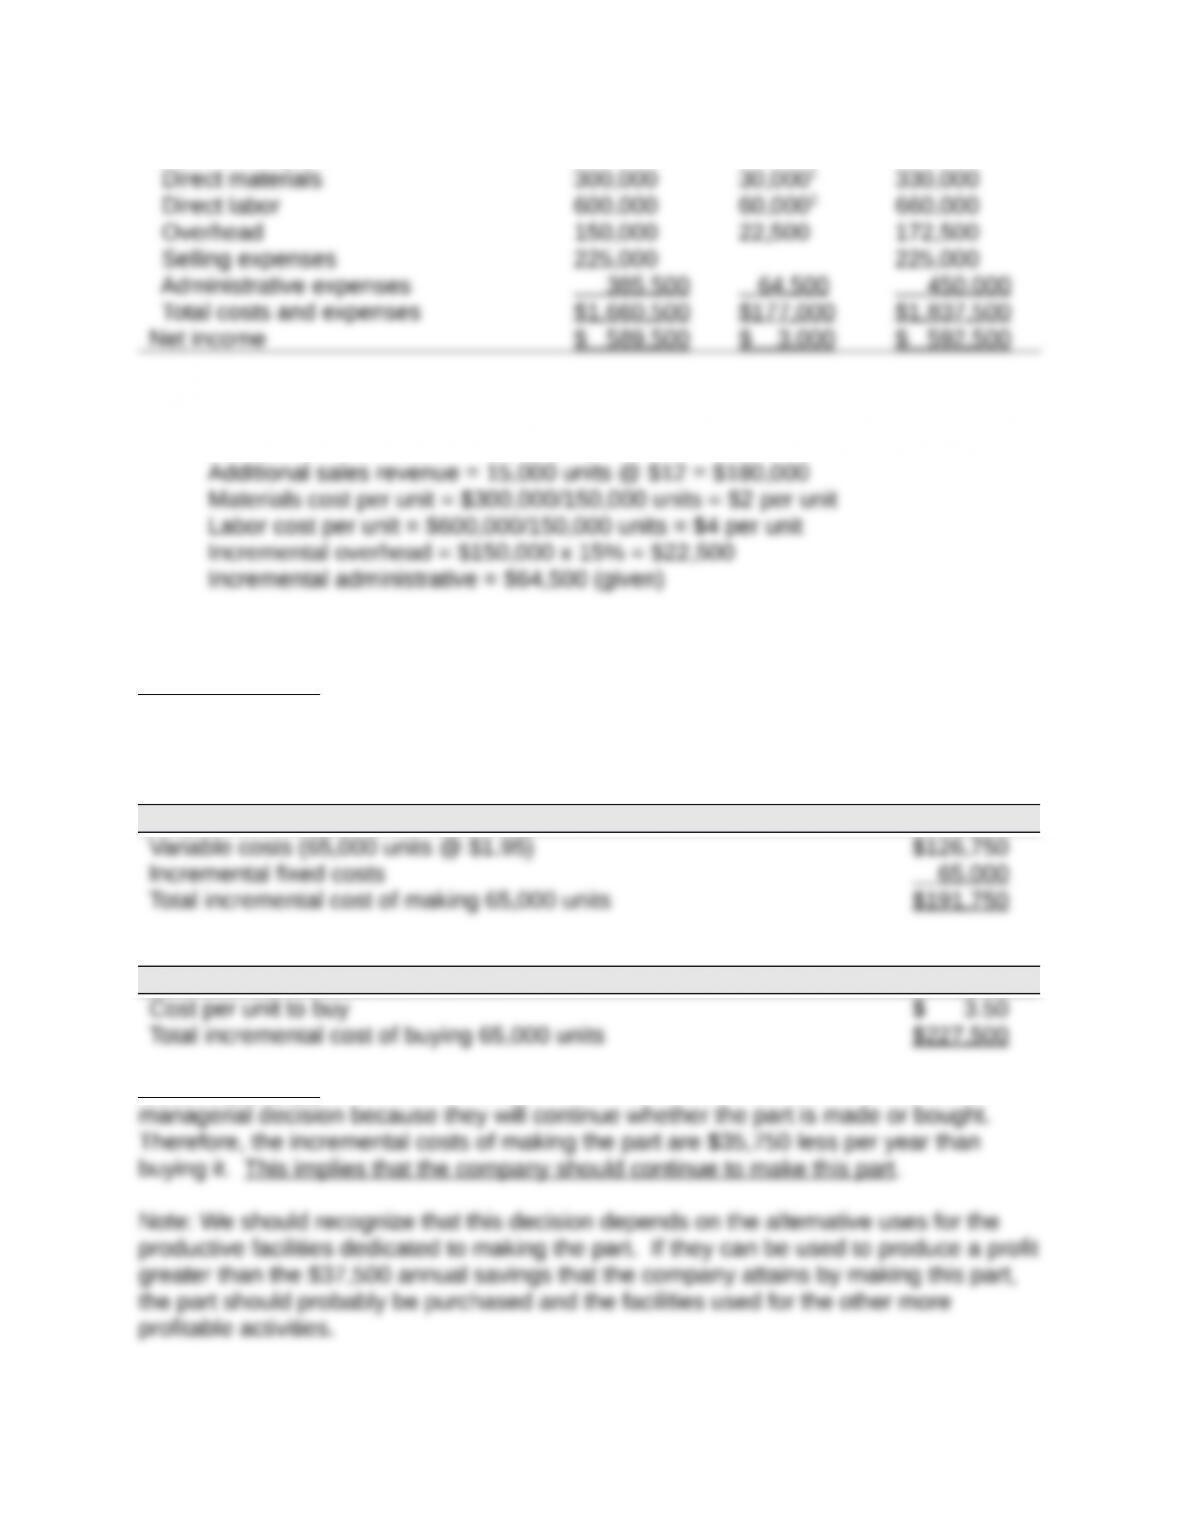
Costs and expenses
1(15,000 x $2) 2 (15,000 x $4)
*ADDITIONAL VOLUME COMPUTATIONS
RECOMMENDATION : The company should accept the offer because the additional sales
would yield an incremental net income of $3,000.
Title: Exercise 25-14
QA_Ori:
INCREMENTAL COST OF MAKING THE PART
INCREMENTAL COST OF BUYING THE PART
RECOMMENDATION : Note that the allocated fixed costs of $58,500 are not relevant to this
Title: Exercise 25-15
QA_Ori:
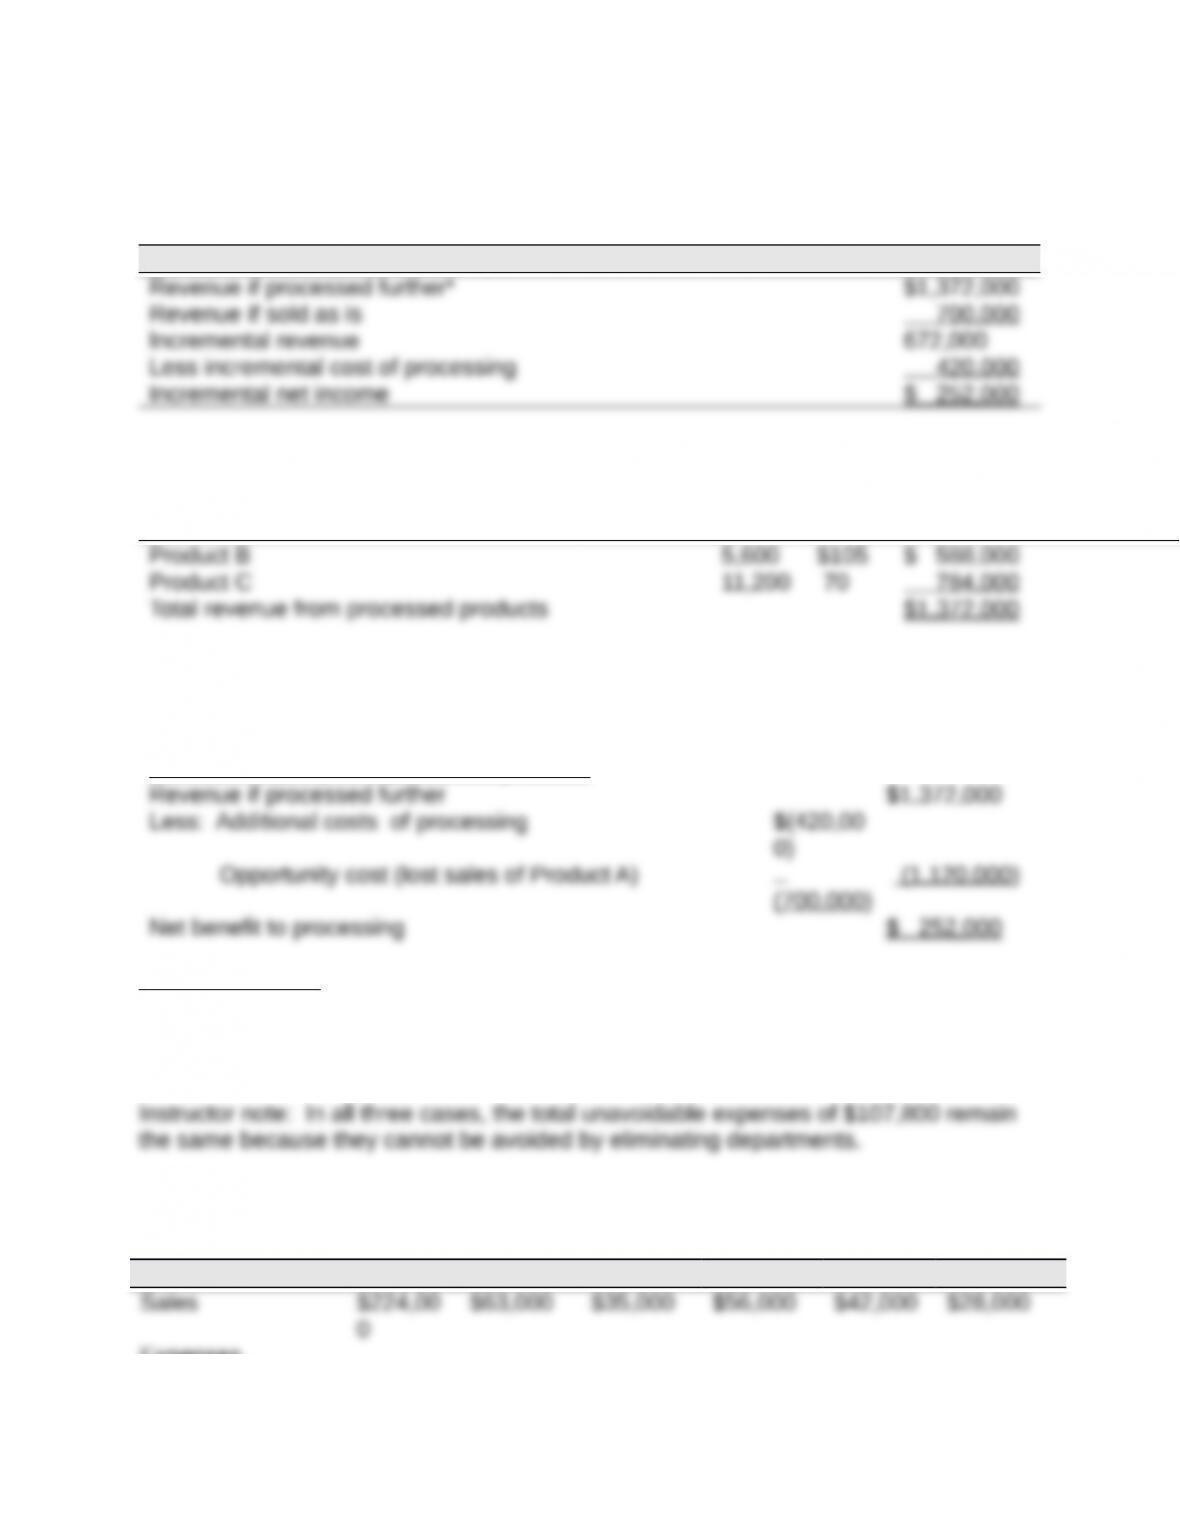
INCREMENTAL REVENUE AND COST OF ADDITIONAL PROCESSING
*Revenue from processed products
Units Price Total
ALTERNATE SOLUTION FORMAT
Net income (loss) from processed products
RECOMMENDATION : This analysis shows that the company will be better off by $252,000
if it chooses to process Product A into the two products of B and C. (Note that the $28
per unit cost of manufacturing Product A is sunk and irrelevant to this decision.)
Title: Exercise 25-16
QA_Ori:
1. NO DEPARTMENTS ELIMINATED
Total M N O P T
0
Expenses
(4,200)
1,400
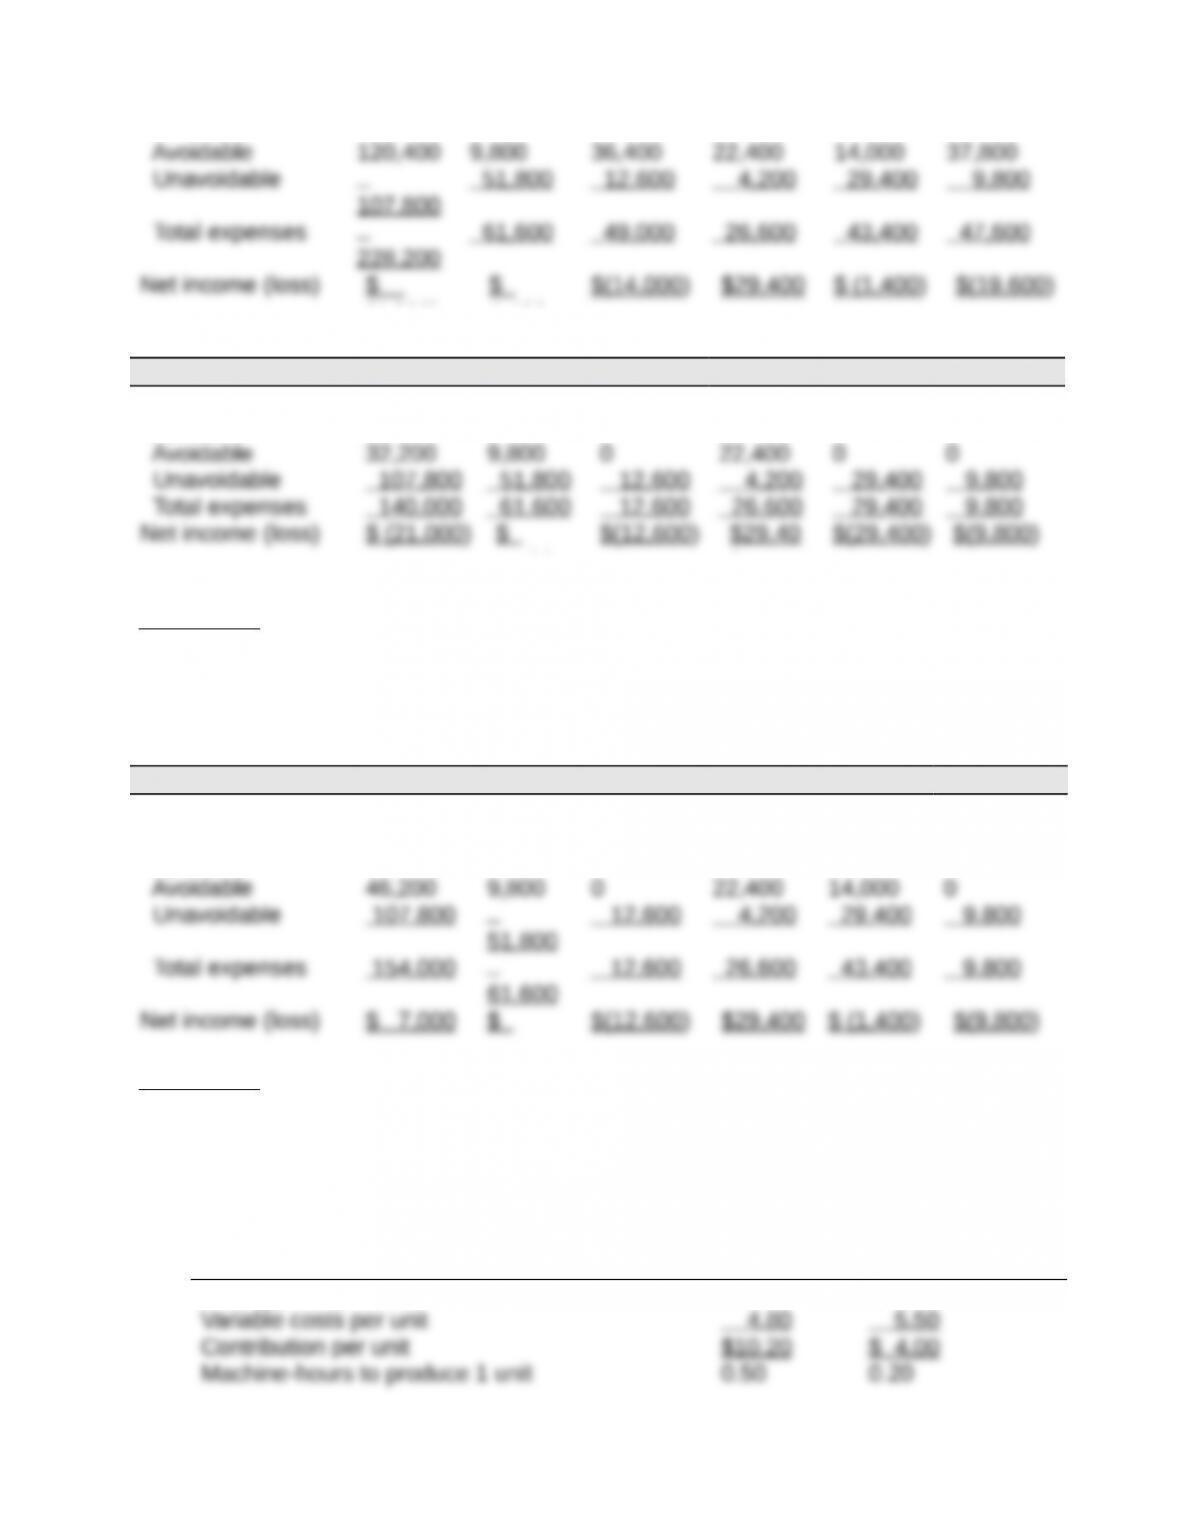
2. DEPARTMENTS WITH EXPECTED NET LOSSES ELIMINATED
Total M N O P T
Sales $119,000 $63,000 $ 0 $56,000 $ 0 $ 0
Expenses
1,400
0
Explanation: This income statement reflects elimination of Departments N, P, and T. The
sales and avoidable expenses are the combined amounts for Departments M and O.
The net loss has actually increased because the excess of sales dollars over avoidable
expenses has declined and less remains to cover unavoidable expenses.
3. DEPARTMENTS WITH LESS SALES THAN AVOIDABLE EXPENSES ELIMINATED
Total M N O P T
Sales $161,000 $63,00
0
$ 0 $56,000 $42,000 $ 0
Expenses
1,400
Explanation: This income statement reflects the Departments M, O, and P. Departments
N and T are eliminated because their sales dollars do not cover their avoidable costs.
Title: Exercise 25-17
QA_Ori:
Preliminary computations
Contribution margin per hour Product TLX Product MTV
Selling price per unit $15.00 $ 9.50
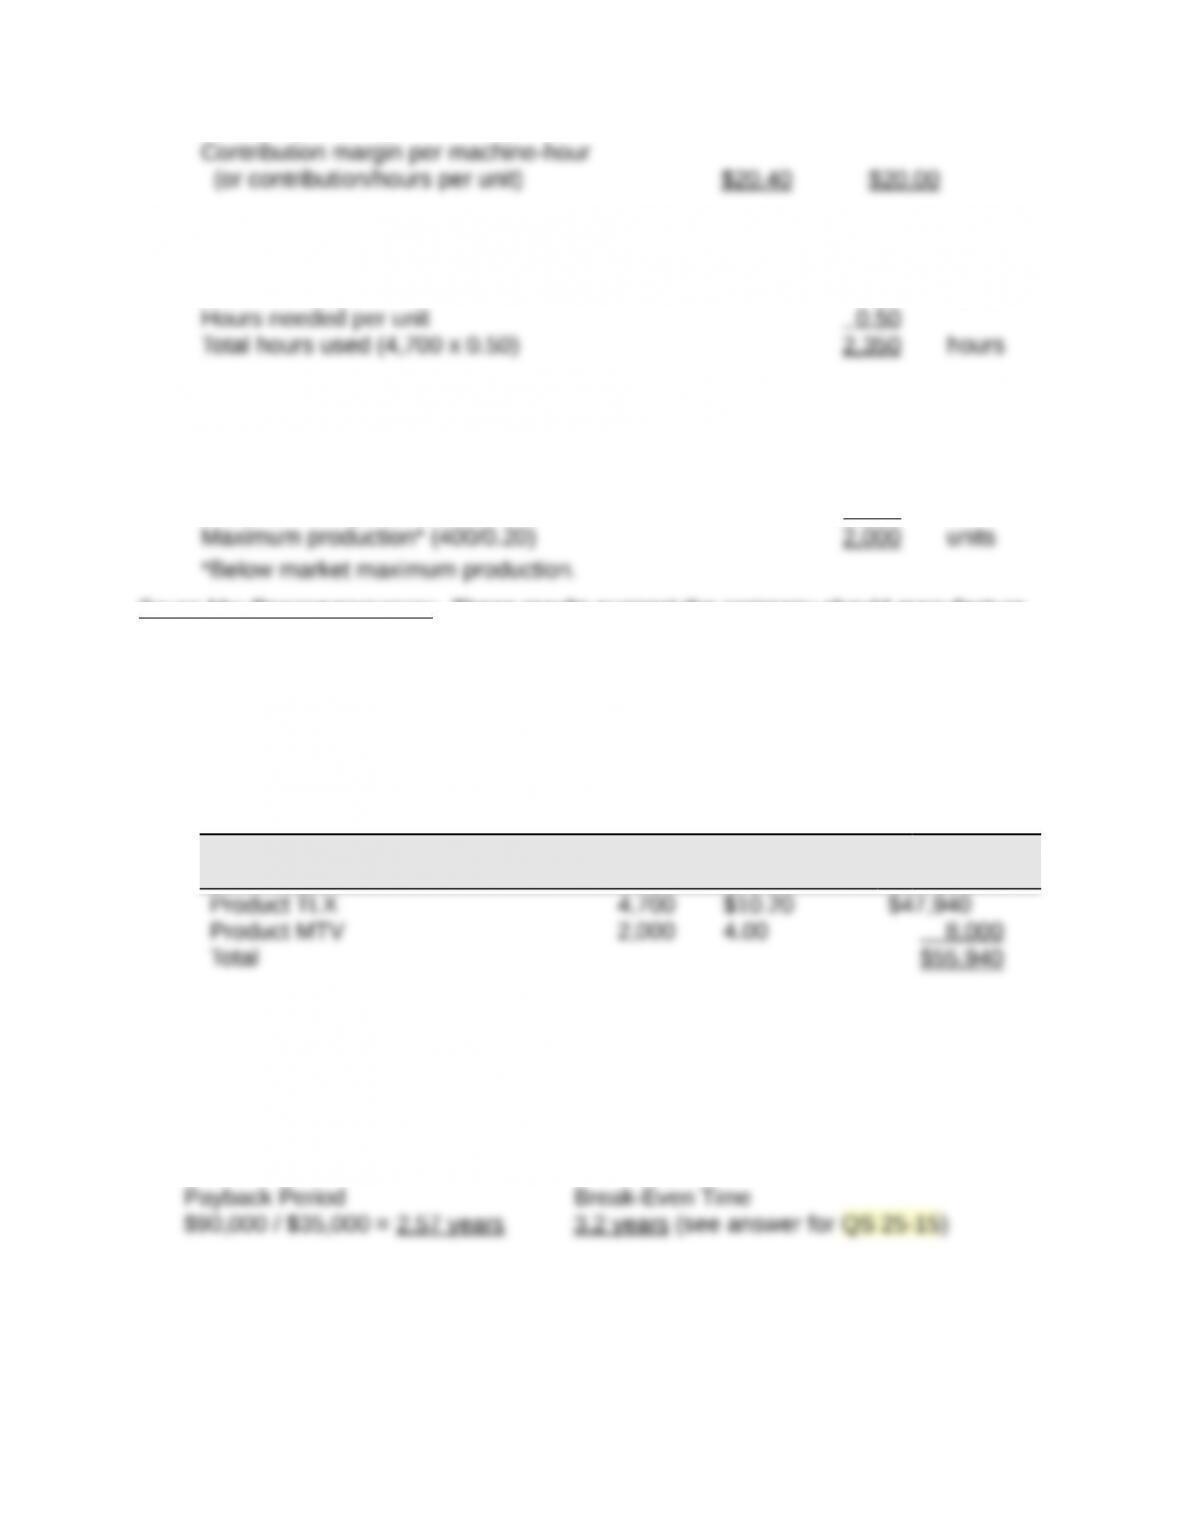
1. FOR PRODUCT TLX
Maximum sales 4,700 units
FOR PRODUCT MTV
Remaining hours (2,750 – 2,350) 400 hours
Hours needed per unit 0.20
SALES MIX RECOMMENDATION : These results suggest the company should manufacture
as many units of Product TLX as it can produce and sell until reaching a (market or
production) constraint. Thereafter, any remaining capacity should be devoted to
Product MTV, up to the maximum that can be produced and/or sold.
2. CONTRIBUTION MARGIN FROM THE RECOMMENDED SALES MIX
Units
Contribution per
Unit Total
Title: Exercise 25-18
QA_Ori:
1. Recovery time computation
2. The advantage of break-even time is that it considers the time value of money.
This means break-even time should provide a superior estimate of the recovery time
relative to the payback period method.
3. When (1) the interest rate is very low, 1% for example, and (2) the payback
period is very short, then payback period and break-even time will yield similar results.
Title: Problem 25-1A
QA_Ori:
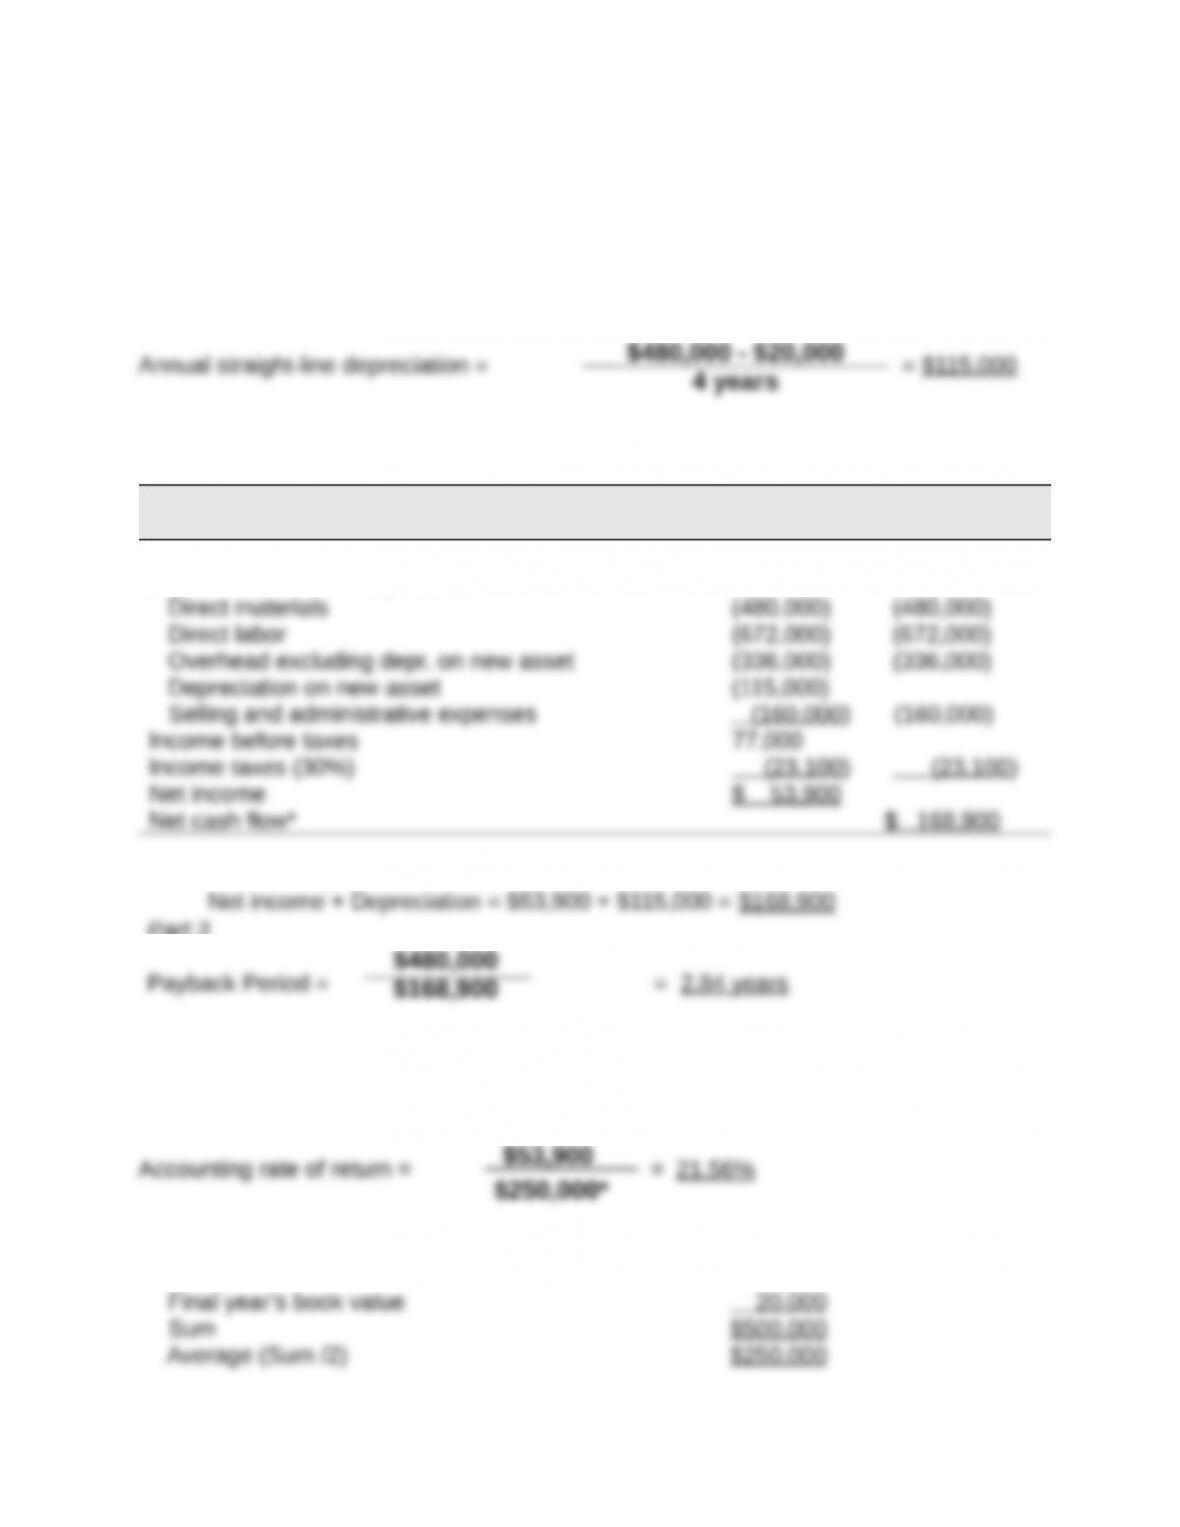
Part 1
Part 2
Net Net Cash
Income Flow
Expected annual sales of new product $1,840,000 $1,840,000
Expected costs of new product
* Alternatively, annual net cash flow can be computed as
Part 3
QA_Ori:
Part 4
* Average investment
Asset cost $480,000
Final year’s book value 20,000
Sum $500,000
Average (Sum /2) $250,000
$480,000 – $20,000
4 years
$53,900
$250,000*
$480,000
$168,900
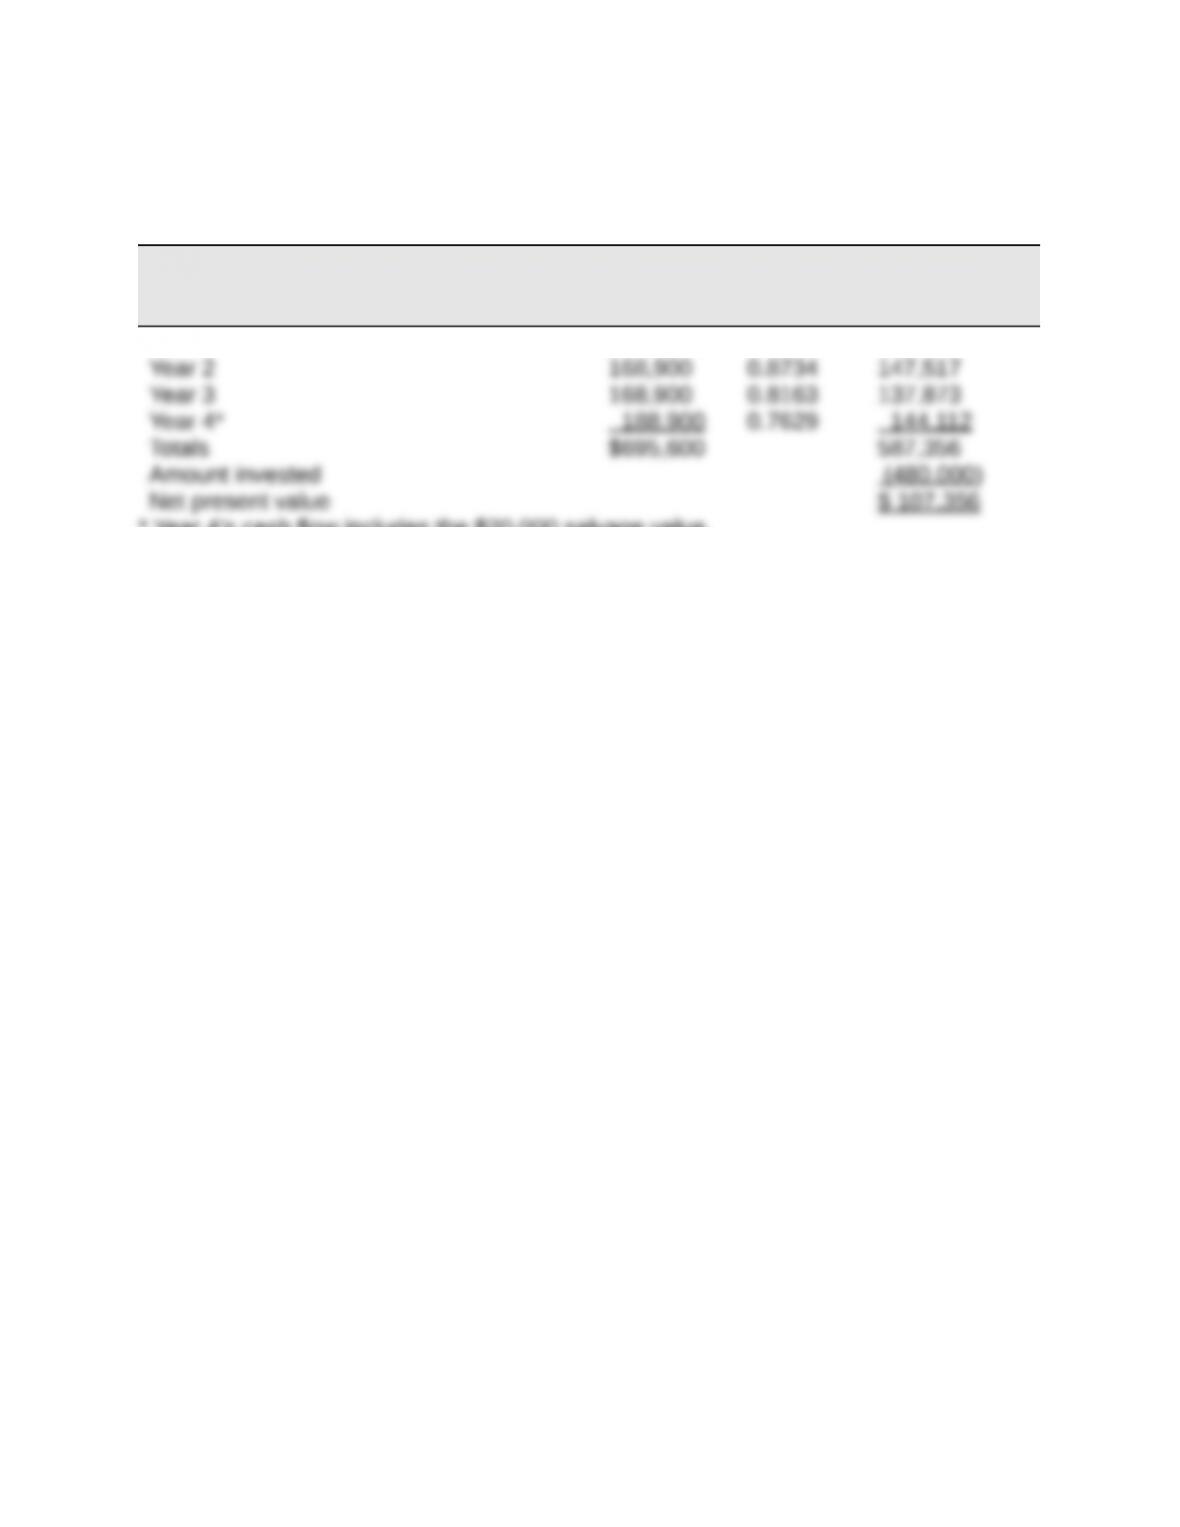
Part 5
Present Value of Net Cash Flows
Present Present
Net Cash Value of Value of Net
Flows 1 at 7% Cash Flows
Year 1 $168,900 0.9346 $ 157,854
* Year 4’s cash flow includes the $20,000 salvage value.