Fundamental Accounting Principles, 21st Edition
1478
Exercise 25-11 (20 minutes)
ALTERNATIVE A: INCREASE OR (DECREASE) IN NET INCOME
Cost to buy new machine ……………………………………………………....
$(115,000)
Cash received to trade in old machine …………………………………..………….
52,000
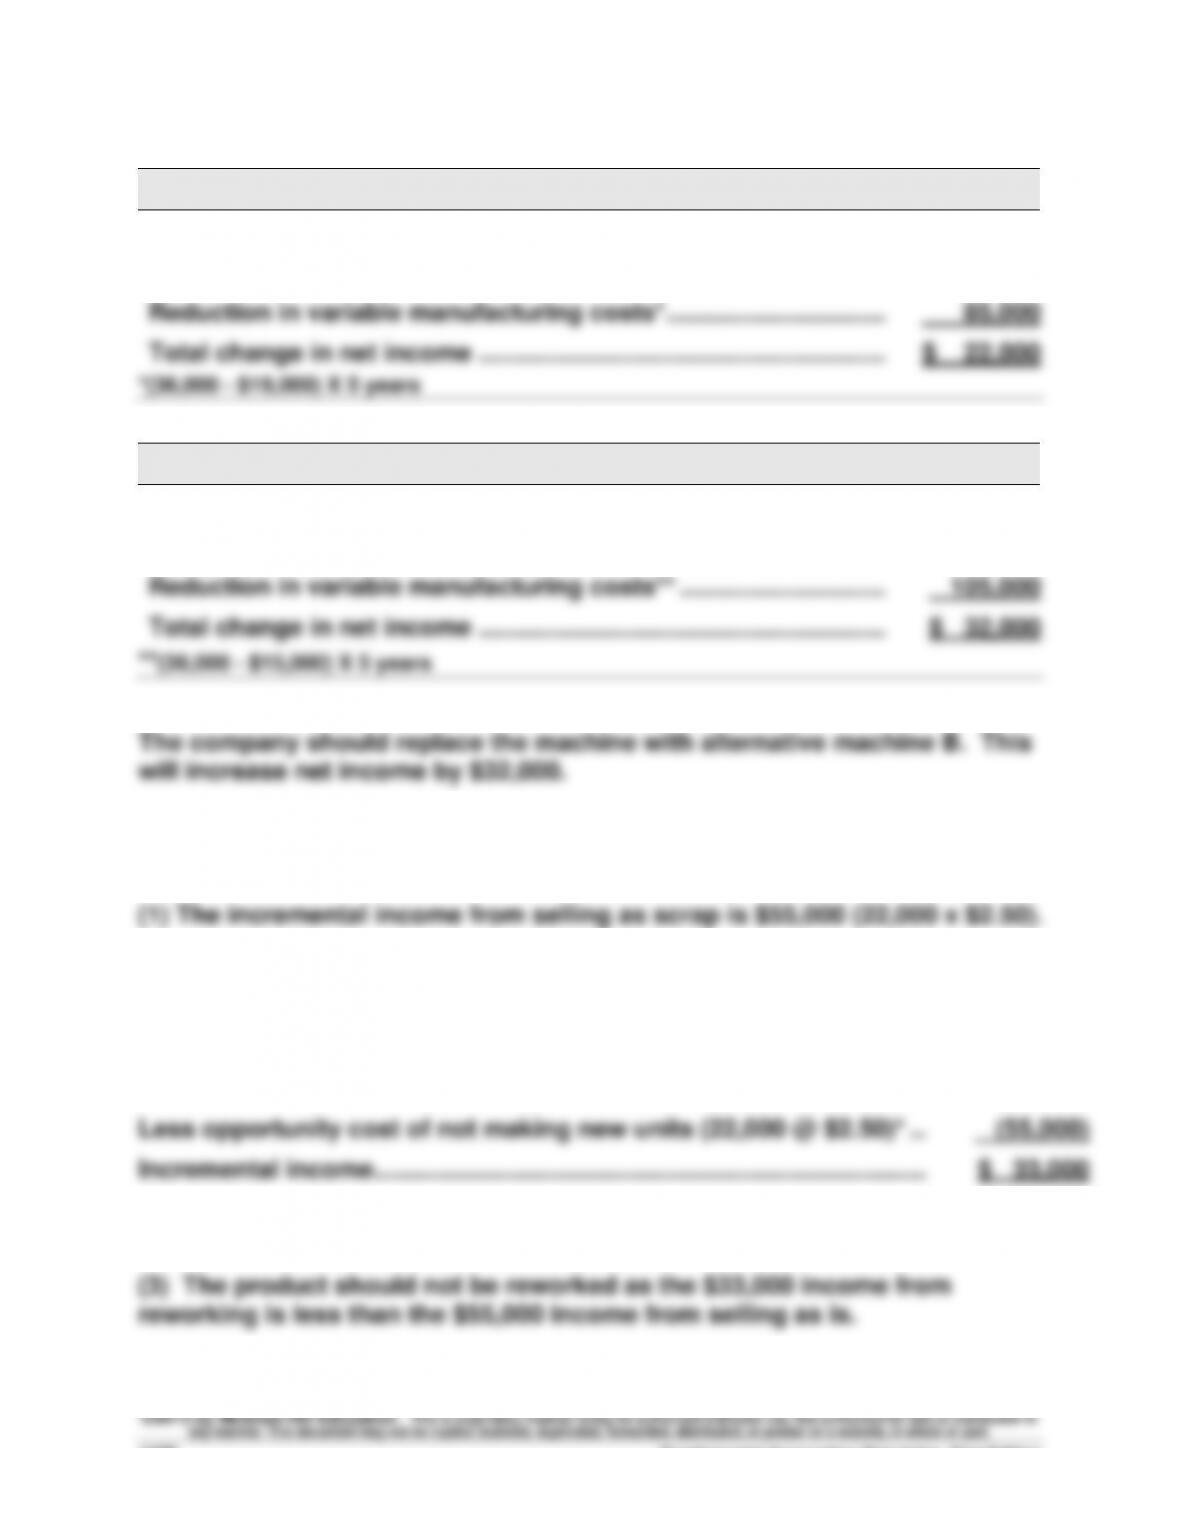
Reduction in variable manufacturing costs* …………………………..
85,000
Total change in net income …………………………………………………..…..
$ 22,000
*(36,000 – $19,000) X 5 years
ALTERNATIVE B: INCREASE OR (DECREASE) IN NET INCOME
Cost to buy new machine ……………………………………………………....
$(125,000)
Cash received to trade in old machine …………………………………..………….
52,000
Reduction in variable manufacturing costs** …………………………..
105,000
Total change in net income …………………………………………………..…..
$ 32,000
**(36,000 – $15,000) X 5 years
Exercise 25-12 (15 minutes)
(2)
INCREMENTAL INCOME FROM REWORK
Sale of reworked units (22,000 units @ $8.50) …………………………………..
$ 187,000
Less cost to rework units (22,000 @ $4.50) …………………………………..…..
(99,000)
Less opportunity cost of not making new units (22,000 @ $2.50)* ……..
(55,000)
Incremental income ……………………………………………………………………..…..
$ 33,000
*Sales price per unit – cost per unit = $8.50 – $6 = $2.50.
Exercise 25-13 (25 minutes)
Normal
Additional
Combined
Volume
Volume*
Total
Sales …………………………………………..
$2,250,000
$180,000
$2,430,000
Costs and expenses
Direct materials …………………………
300,000
30,0001
330,000
Direct labor ……………………………….
600,000
60,0002
660,000
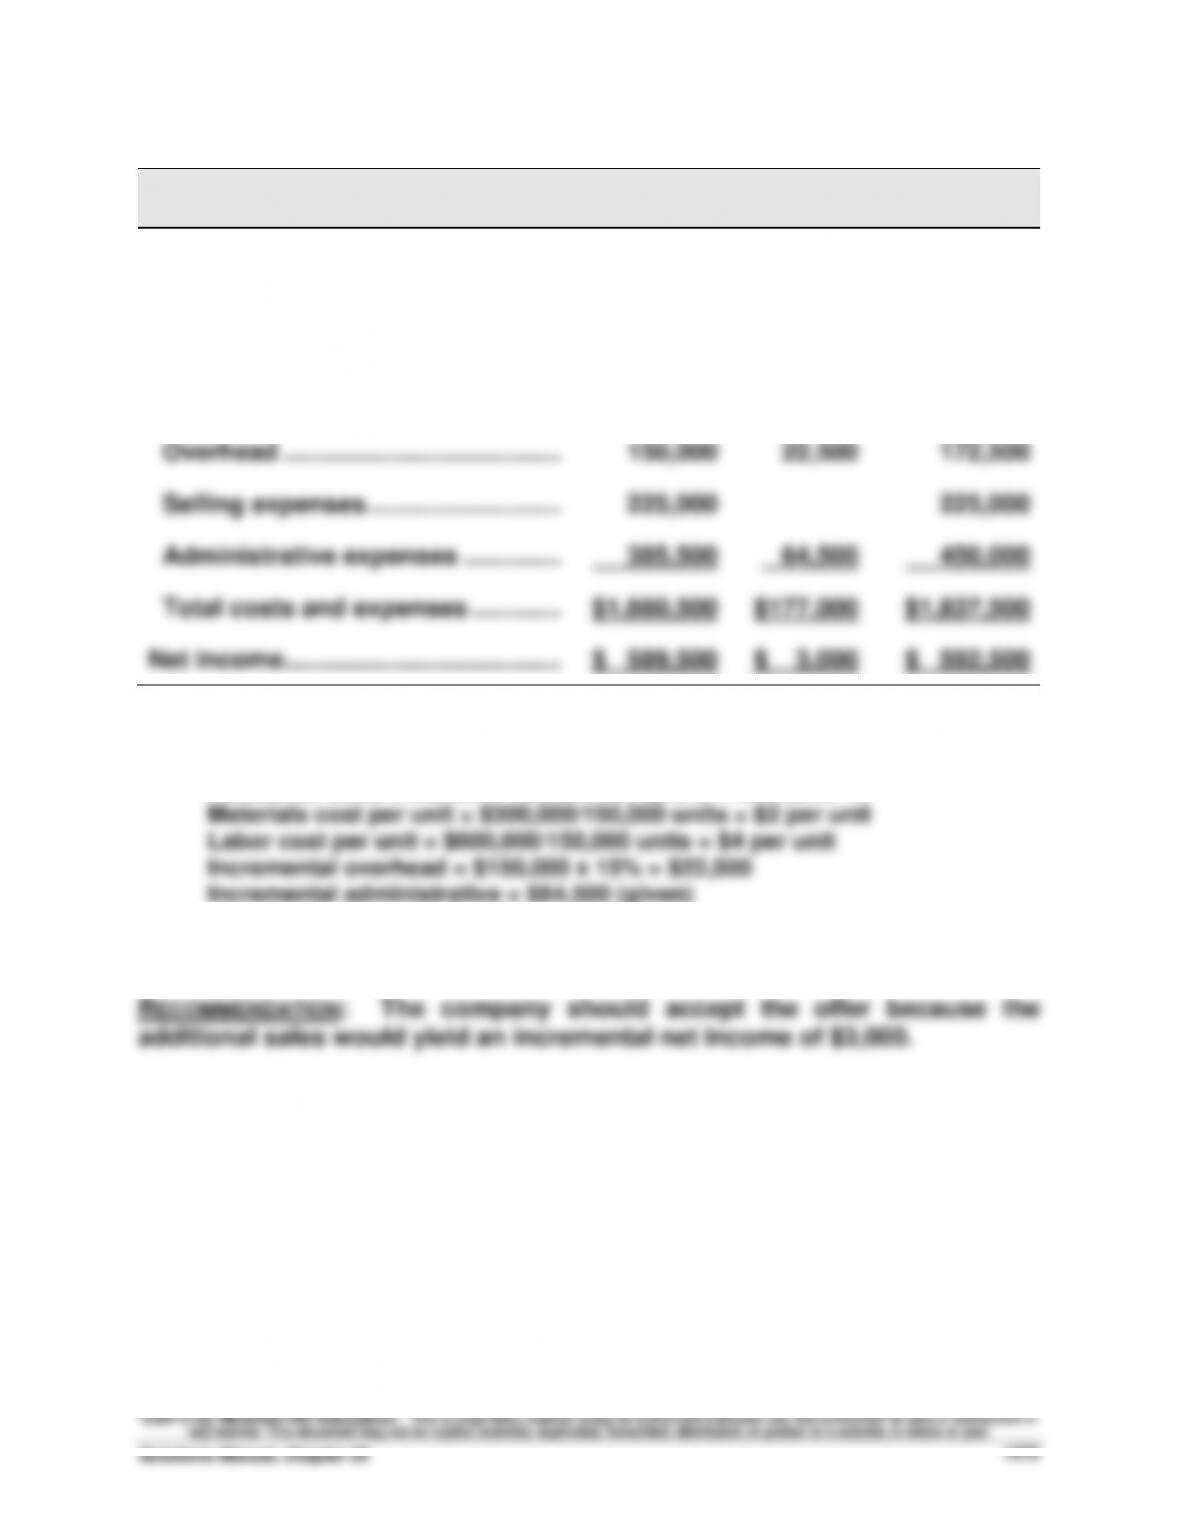
Overhead ………………………………….
150,000
22,500
172,500
Selling expenses ……………………….
225,000
225,000
Administrative expenses …………..
385,500
64,500
450,000
Total costs and expenses ………….
$1,660,500
$177,000
$1,837,500
Net income ………………………………….
$ 589,500
$ 3,000
$ 592,500
1 (15,000 x $2) 2 (15,000 x $4)
* ADDITIONAL VOLUME COMPUTATIONS
Additional sales revenue = 15,000 units @ $12 = $180,000
Fundamental Accounting Principles, 21st Edition
1480
Exercise 25-14 (20 minutes)
INCREMENTAL COST OF MAKING THE PART
Variable costs (65,000 units @ $1.95) ………………………………………………..
$126,750
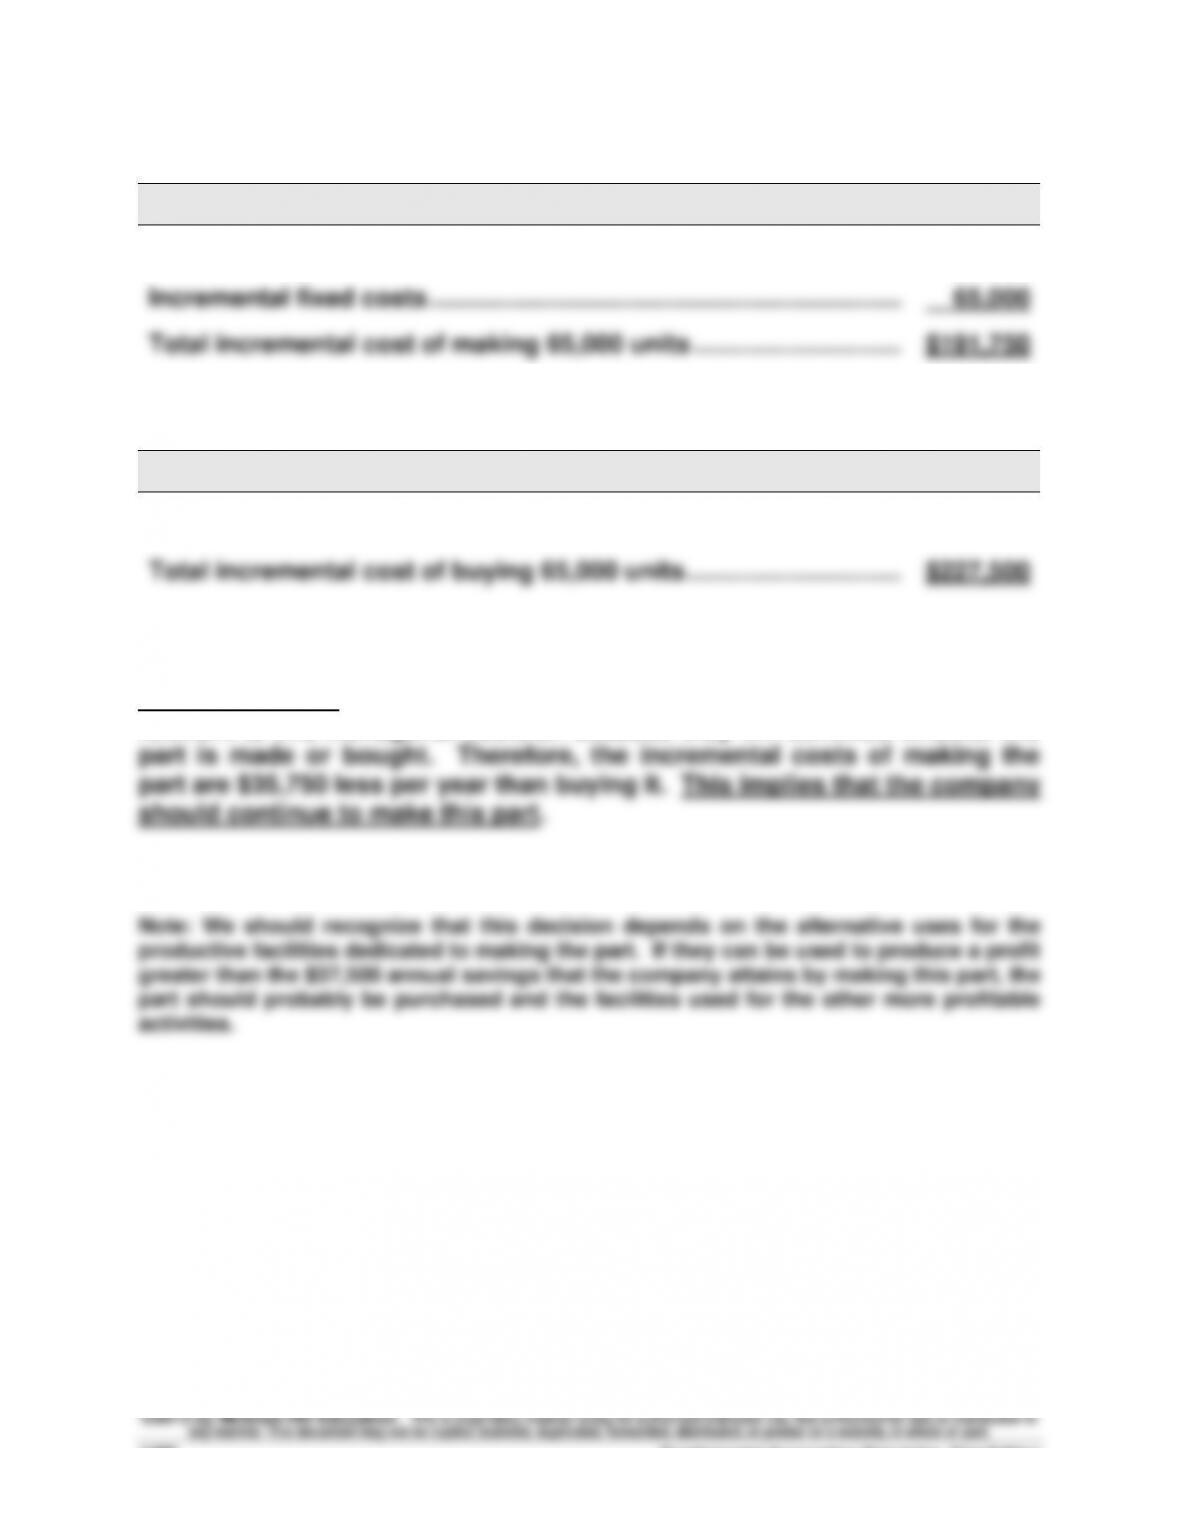
Incremental fixed costs …………………………………………………………..………..
65,000
Total incremental cost of making 65,000 units …………………………..
$191,750
INCREMENTAL COST OF BUYING THE PART
Cost per unit to buy ………………………………………………………………..………..
$ 3.50
Total incremental cost of buying 65,000 units …………………………..
$227,500
RECOMMENDATION: Note that the allocated fixed costs of $58,500 are not
relevant to this managerial decision because they will continue whether the
Exercise 25-15 (25 minutes)
INCREMENTAL REVENUE AND COST OF ADDITIONAL PROCESSING
Revenue if processed further* ………………………………………………..…
$1,372,000
Revenue if sold as is ……………………………………………………………..…
700,000
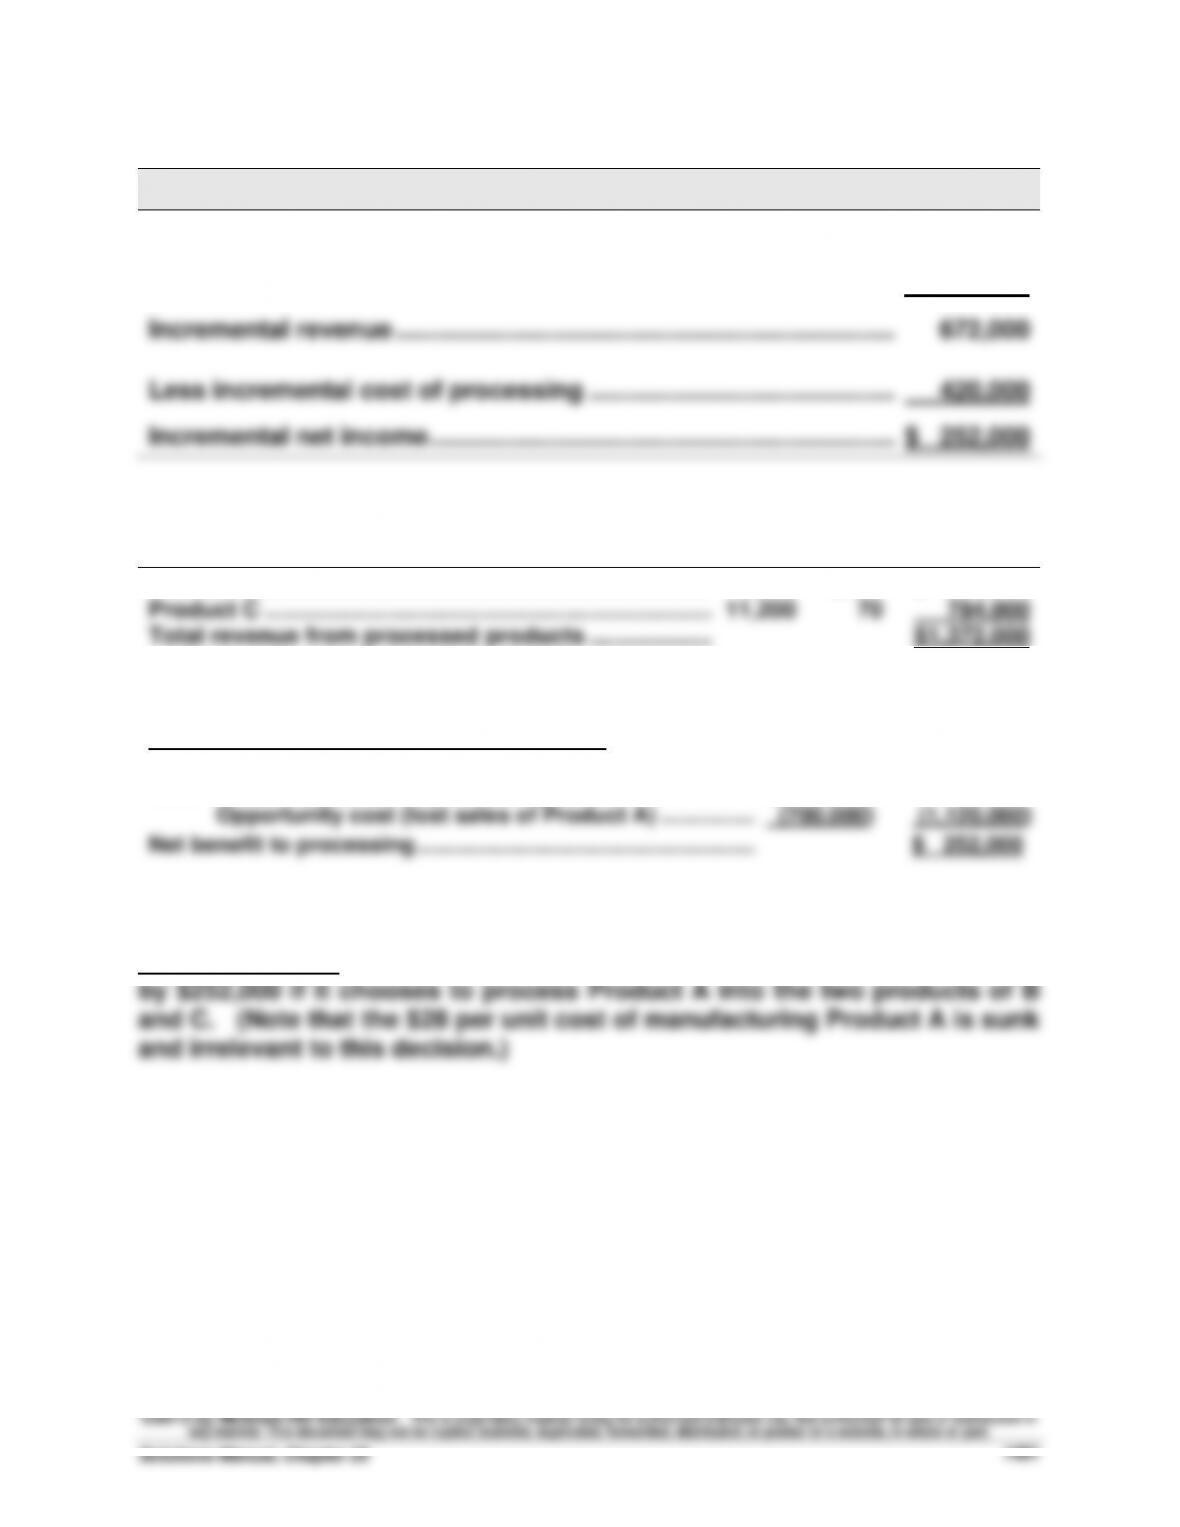
Incremental revenue …………………………………………………………………
672,000
Less incremental cost of processing ……………………………………..…
420,000
Incremental net income ………………………………………………………….…
$ 252,000
*Revenue from processed products
Units
Price
Total
Product B ……………………………………………………………………
5,600
$105
$ 588,000
Product C ……………………………………………………………………
11,200
70
784,000
Total revenue from processed products ……………….………
$1,372,000
ALTERNATE SOLUTION FORMAT
Net income (loss) from processed products
Revenue if processed further…………………………………………
$1,372,000
Less: Additional costs of processing…………………………...
$(420,000)
Opportunity cost (lost sales of Product A) ……………
(700,000)
(1,120,000)
Net benefit to processing ………………………………………………
$ 252,000
RECOMMENDATION: This analysis shows that the company will be better off
Fundamental Accounting Principles, 21st Edition
1482
Exercise 25-16 (30 minutes)
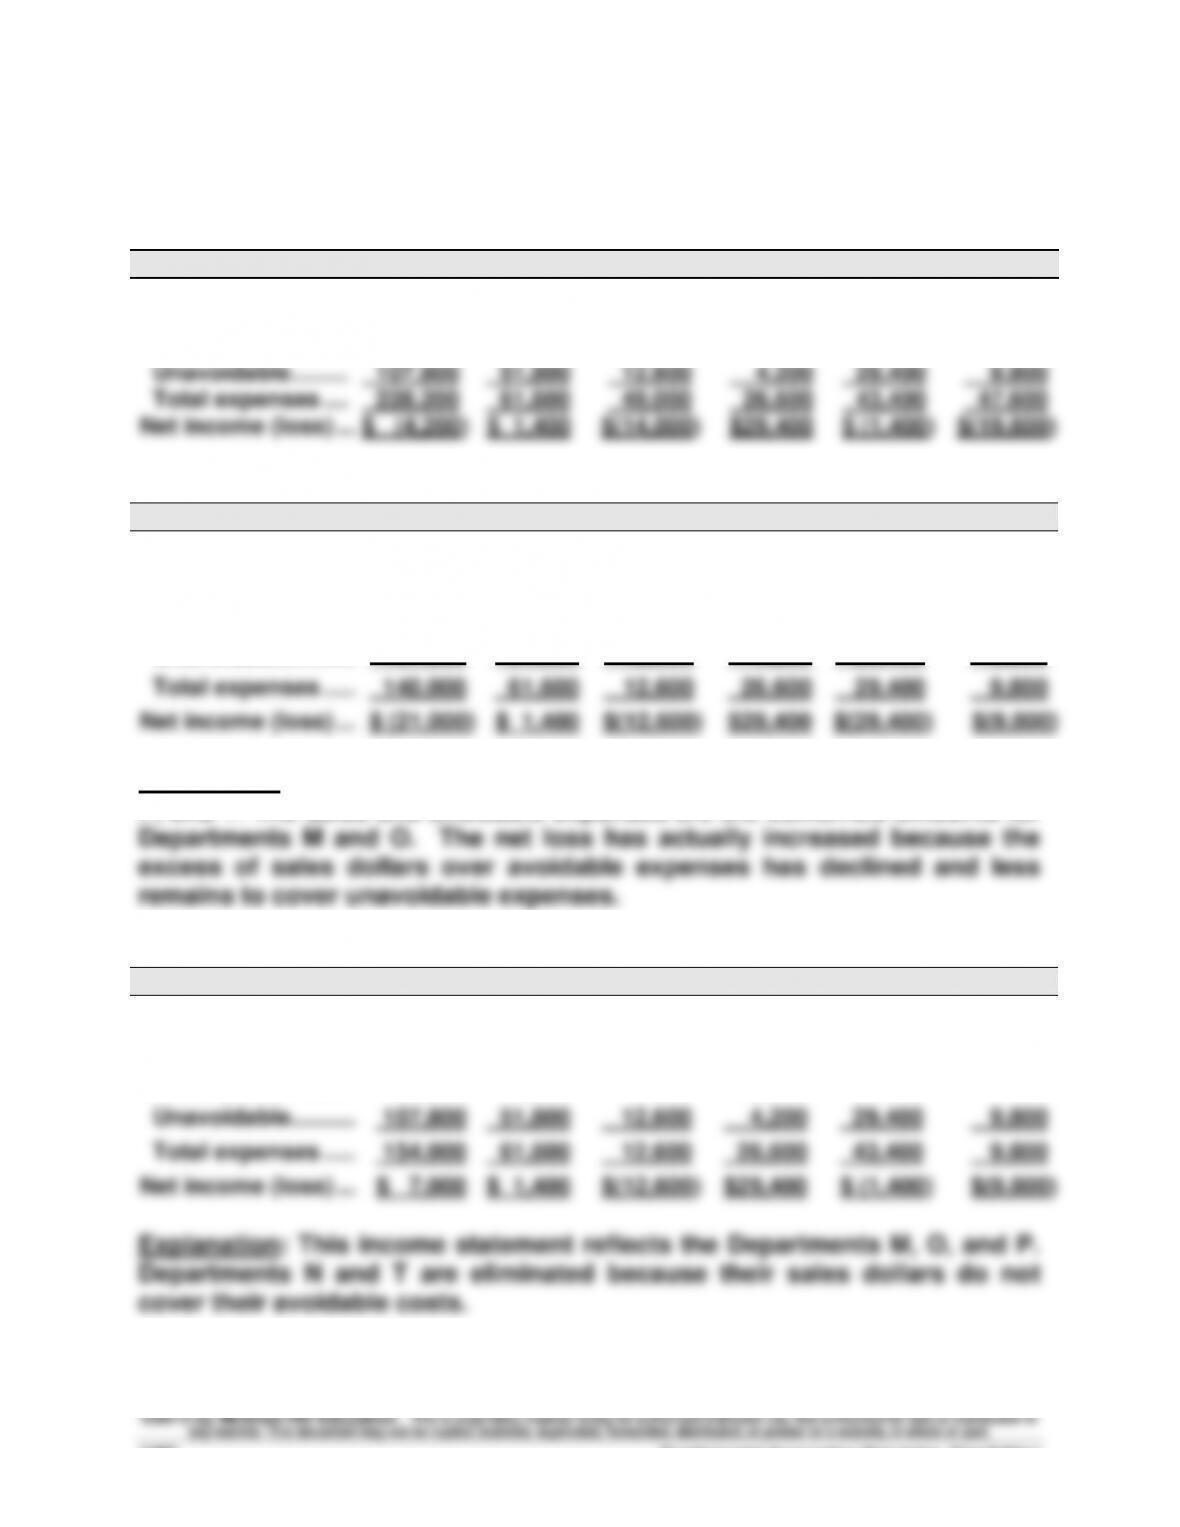
Instructor note: In all three cases, the total unavoidable expenses of $107,800 remain the
same because they cannot be avoided by eliminating departments.
1. NO DEPARTMENTS ELIMINATED
Total
M
N
O
P
T
Sales…………………..………
$224,000
$63,000
$35,000
$56,000
$42,000
$28,000
Expenses
Avoidable ………….……….
120,400
9,800
36,400
22,400
14,000
37,800
Unavoidable ……………….
107,800
51,800
12,600
4,200
29,400
9,800
Total expenses ….……….
228,200
61,600
49,000
26,600
43,400
47,600
Net income (loss) …………
$ (4,200)
$ 1,400
$(14,000)
$29,400
$ (1,400)
$(19,600)
2. DEPARTMENTS WITH EXPECTED NET LOSSES ELIMINATED
Total
M
N
O
P
T
Sales…………………………..
$119,000
$63,000
$ 0
$56,000
$ 0
$ 0
Expenses
Avoidable …………..………………
32,200
9,800
0
22,400
0
0
Unavoidable ……….………………….
107,800
51,800
12,600
4,200
29,400
9,800
Total expenses …..………………………
140,000
61,600
12,600
26,600
29,400
9,800
Net income (loss) …………………………..
$ (21,000)
$ 1,400
$(12,600)
$29,400
$(29,400)
$(9,800)
Explanation: This income statement reflects elimination of Departments N,
P, and T. The sales and avoidable expenses are the combined amounts for
3. DEPARTMENTS WITH LESS SALES THAN AVOIDABLE EXPENSES ELIMINATED
Total
M
N
O
P
T
Sales…………………………..
$161,000
$63,000
$ 0
$56,000
$42,000
$ 0
Expenses
Avoidable …………..………………
46,200
9,800
0
22,400
14,000
0
Unavoidable ……….………………….
107,800
51,800
12,600
4,200
29,400
9,800
Total expenses …..………………………
154,000
61,600
12,600
26,600
43,400
9,800
Net income (loss) …………………………..
$ 7,000
$ 1,400
$(12,600)
$29,400
$ (1,400)
$(9,800)
Explanation: This income statement reflects the Departments M, O, and P.
Departments N and T are eliminated because their sales dollars do not
cover their avoidable costs.
Exercise 25-17 (30 minutes)
Preliminary computations
Contribution margin per hour
Product TLX
Product MTV
Selling price per unit …………………………………….……
$15.00
$ 9.50
Variable costs per unit ………………………………….……
4.80
5.50
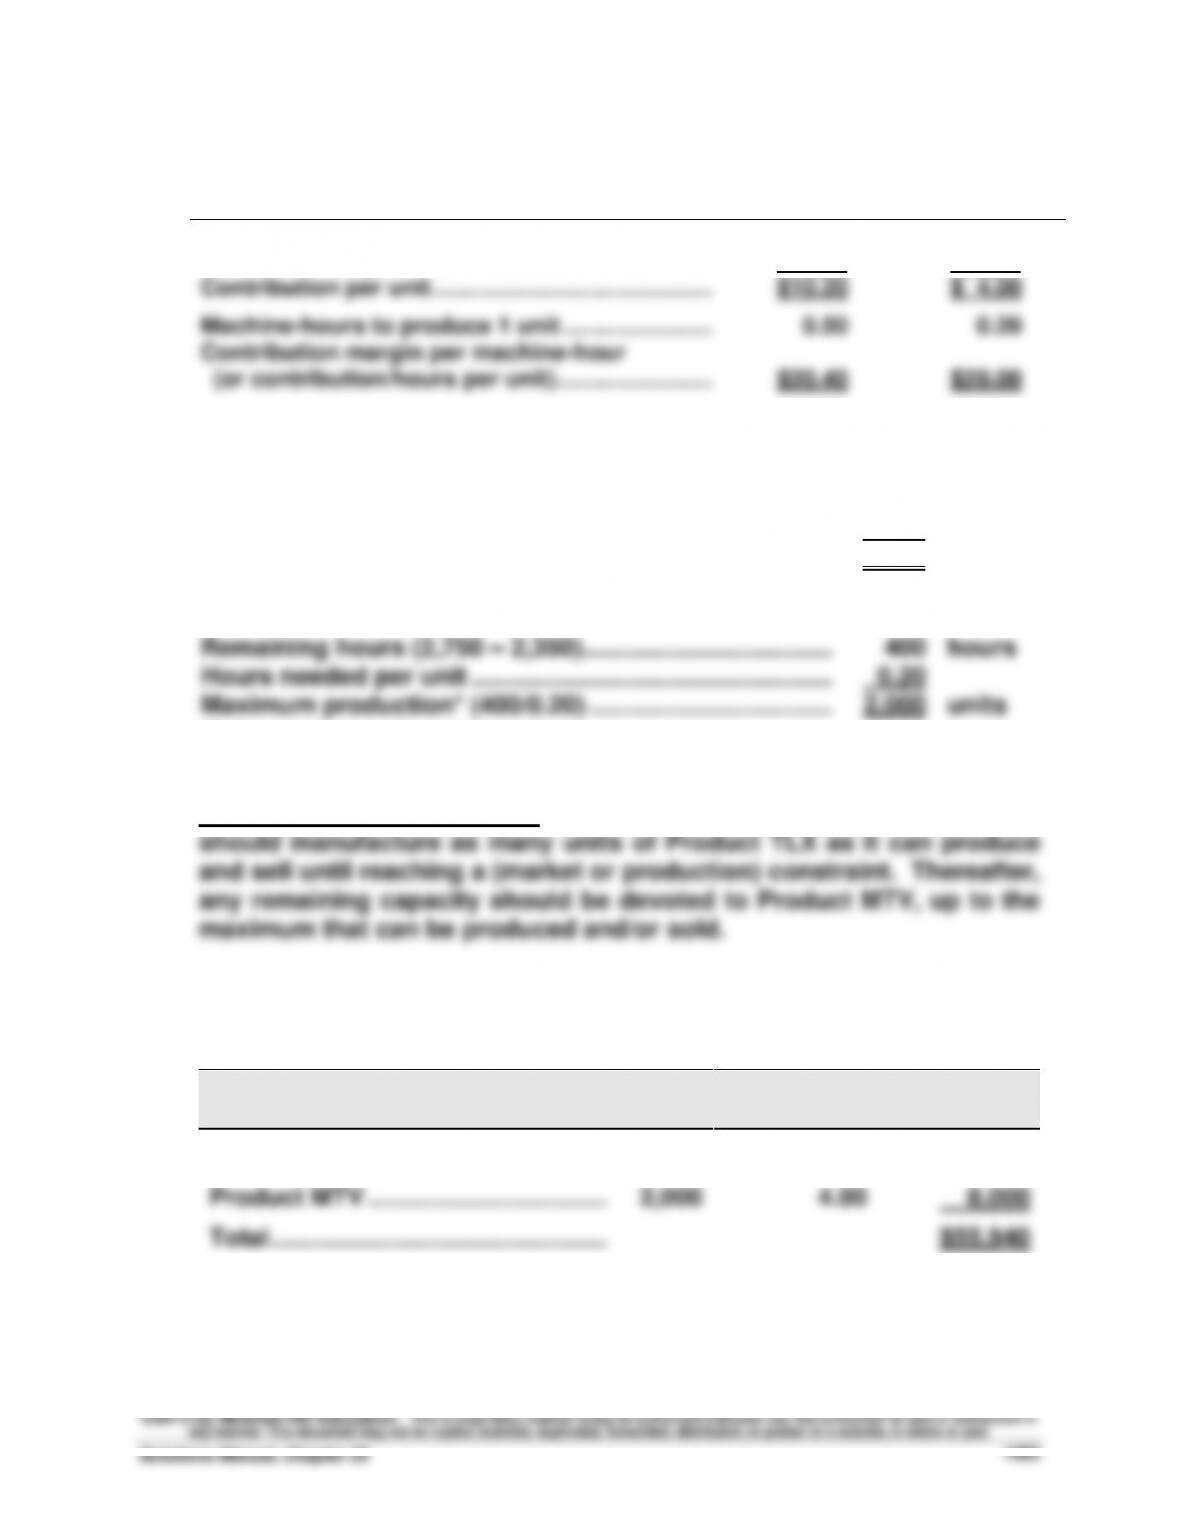
Contribution per unit …………………………………….……
$10.20
$ 4.00
Machine-hours to produce 1 unit …………………..……
0.50
0.20
Contribution margin per machine-hour
(or contribution/hours per unit) …………………………
$20.40
$20.00
1. FOR PRODUCT TLX
Maximum sales ……………………………………………………….
4,700
units
Hours needed per unit …………………………………………….……..
0.50
Total hours used (4,700 x 0.50) ………………………………..……..
2,350
hours
FOR PRODUCT MTV
Remaining hours (2,750 – 2,350)……………………………………..
400
hours
Hours needed per unit …………………………………………….……..
0.20
Maximum production* (400/0.20) ……………………………..……..
2,000
units
*Below market maximum production.
SALES MIX RECOMMENDATION: These results suggest the company
2. CONTRIBUTION MARGIN FROM THE RECOMMENDED SALES MIX
Units
Contribution
per Unit
Total
Product TLX …………………………..…...
4,700
$10.20
$47,940
Product MTV ……………………………....
2,000
4.00
8,000
Total …………………………………………...
$55,940
Fundamental Accounting Principles, 21st Edition
1484
Exercise 25-18 (15 minutes)
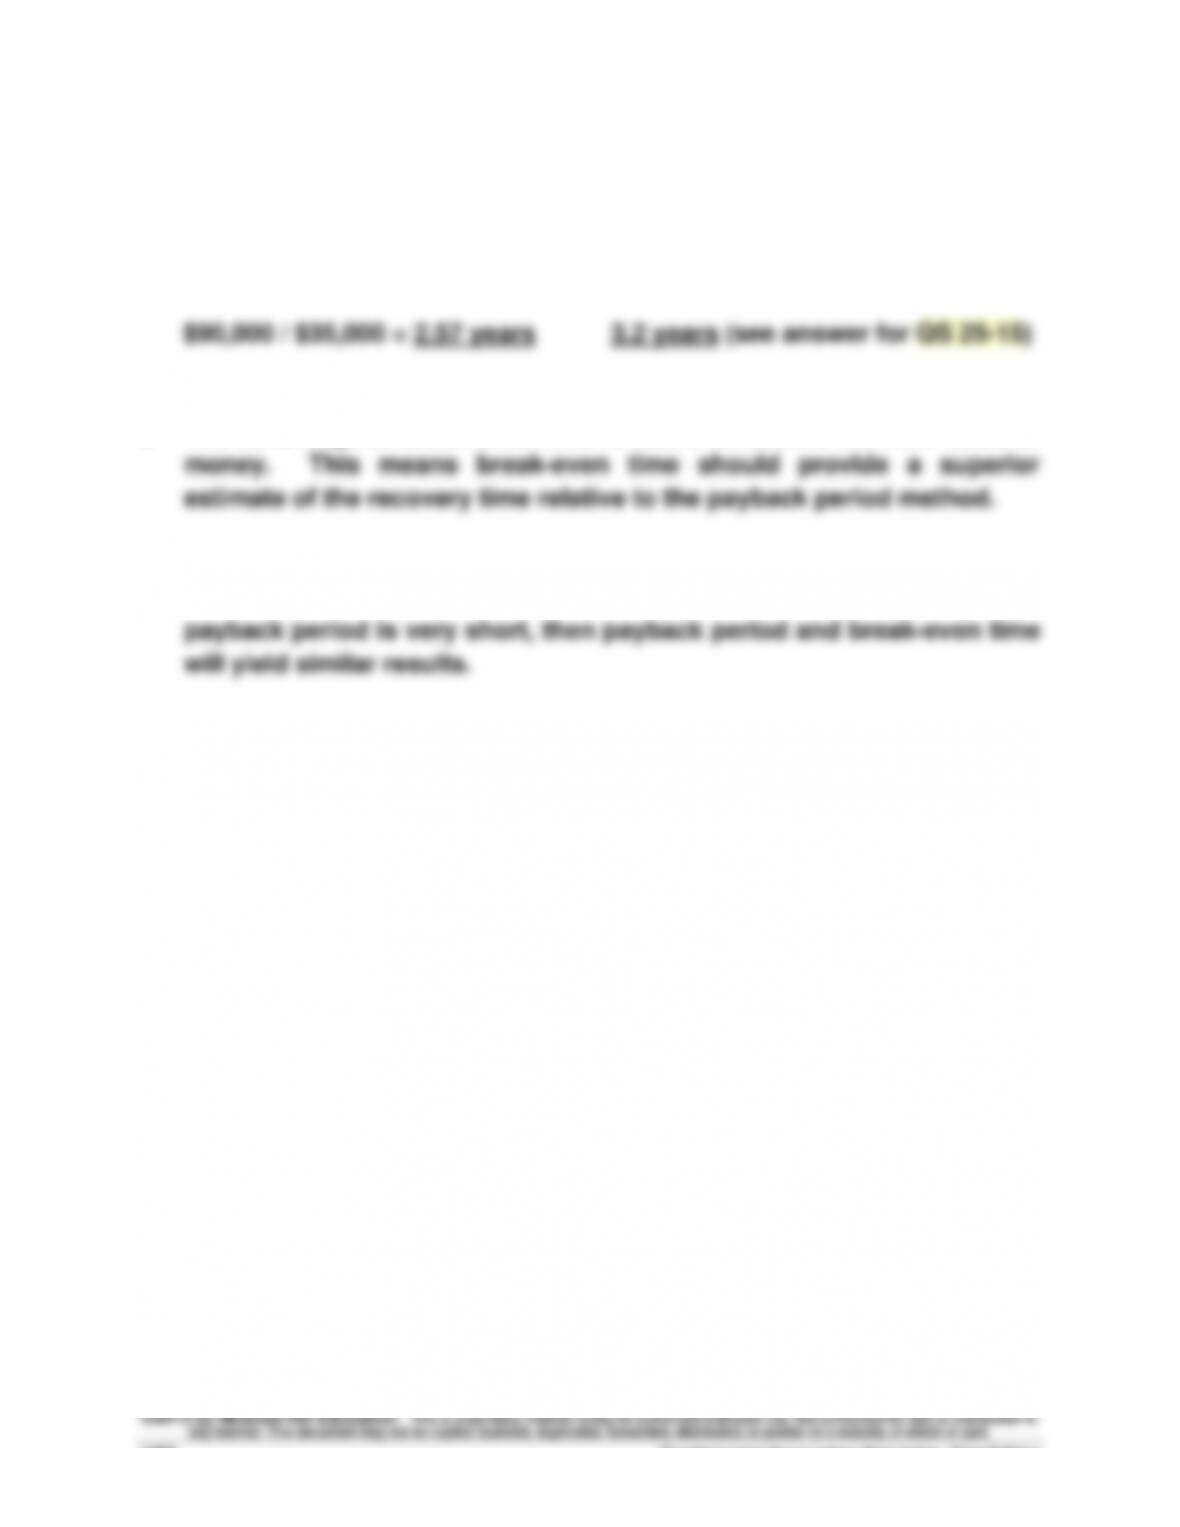
1. Recovery time computation
Payback Period
Break-Even Time
$90,000 / $35,000 = 2.57 years
3.2 years (see answer for QS 25-15)
2. The advantage of break-even time is that it considers the time value of
3. When (1) the interest rate is very low, 1% for example, and (2) the
PROBLEM SET A
Problem 25-1A (50 minutes)
Part 1
Part 2
Net
Net Cash
Income
Flow
Expected annual sales of new product ……………...
$1,840,000
$1,840,000
Expected costs of new product
Direct materials ……………………………………………...
(480,000)
(480,000)
Direct labor …………………………………………………....
(672,000)
(672,000)
Overhead excluding depr. on new asset ………....
(336,000)
(336,000)
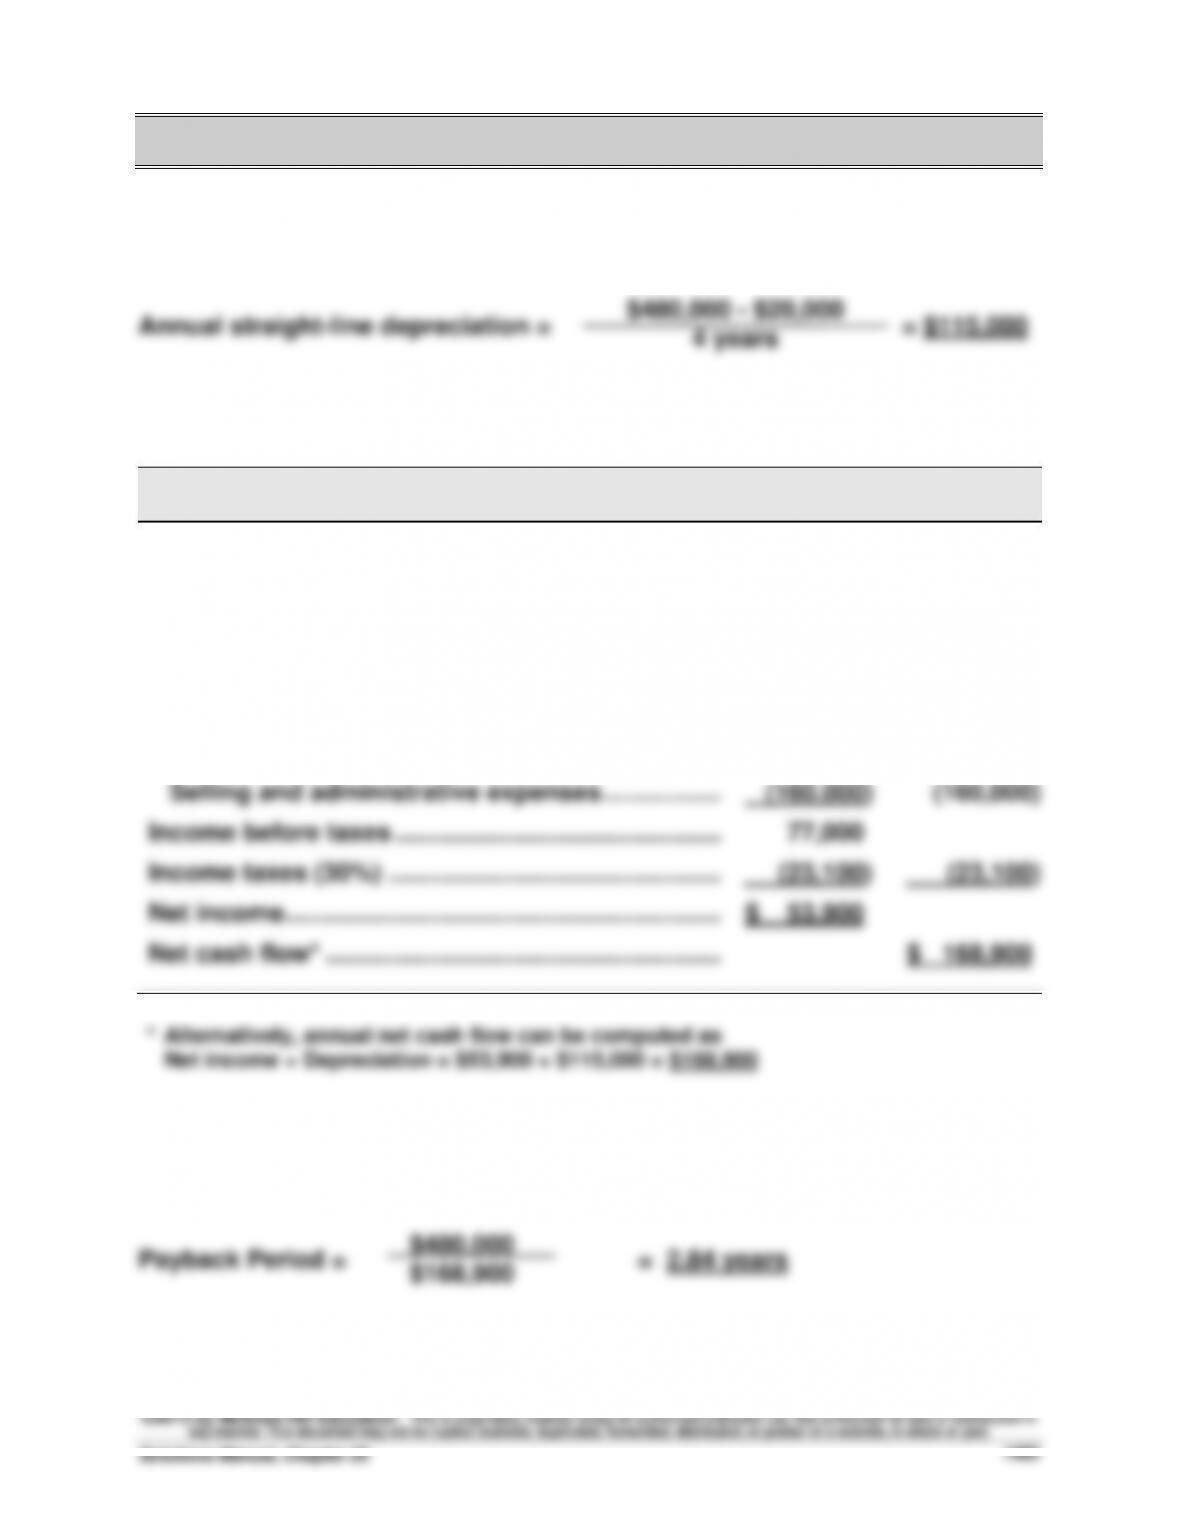
Depreciation on new asset ……………………………..
(115,000)
Selling and administrative expenses ……………....
(160,000)
(160,000)
Income before taxes ………………………………………....
77,000
Income taxes (30%) …………………………………………..
(23,100)
(23,100)
Net income ……………………………………………………….
$ 53,900
Net cash flow* …………………………………………………..
$ 168,900
Part 3
4 years
Fundamental Accounting Principles, 21st Edition
1486
Problem 25-1A (Continued)
Part 4
Accounting rate of return = = 21.56%
* Average investment
Asset cost ………………………………………………………………..……..
$480,000
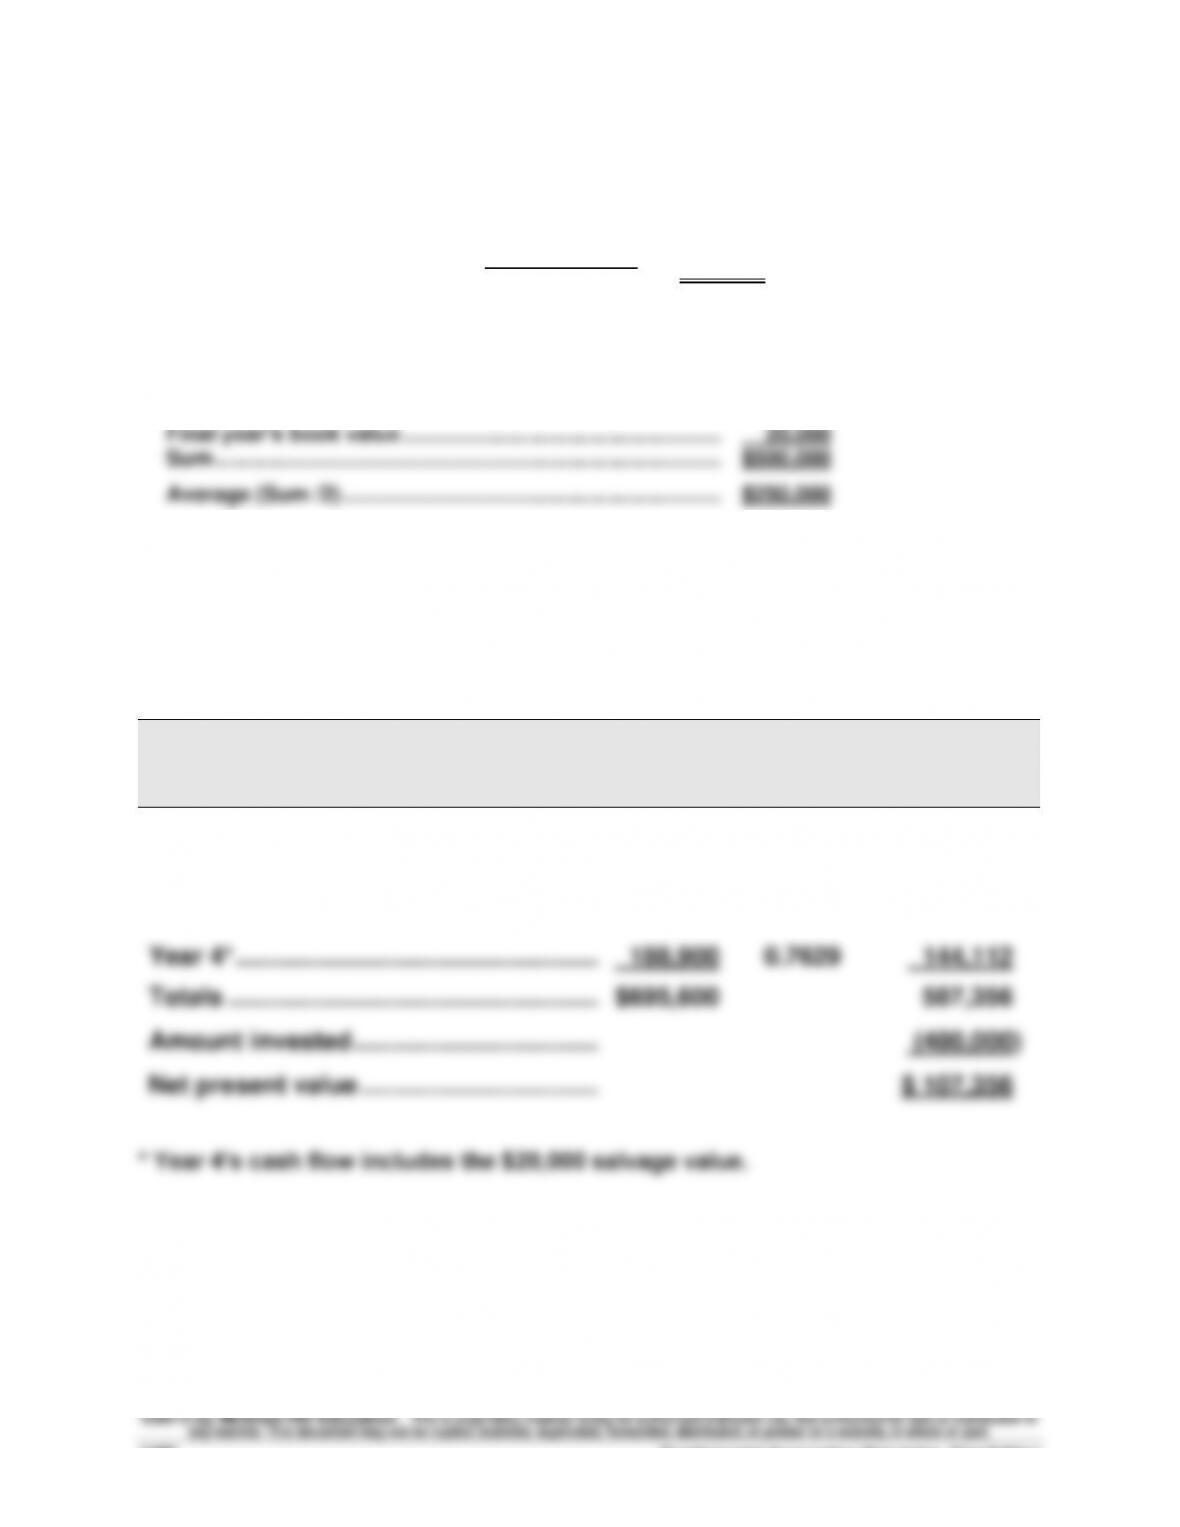
Final year’s book value ……………………………………………..……..
20,000
Sum ………………………………………………………………………………..
$500,000
Average (Sum /2) ……………………………………………………….
$250,000
Part 5
Present Value of Net Cash Flows
Present
Present
Net Cash
Value of
Value of Net
Flows
1 at 7%
Cash Flows
Year 1 ………………………………………………….
$168,900
0.9346
$ 157,854
Year 2 ………………………………………………….
168,900
0.8734
147,517
Year 3 ………………………………………………….
168,900
0.8163
137,873
Year 4* ……………………………………………..….
188,900
0.7629
144,112
Totals ………………………………………………….
$695,600
587,356
Amount invested ………………………………….
(480,000)
Net present value ……………………………..….
$ 107,356
* Year 4’s cash flow includes the $20,000 salvage value.
$53,900
$250,000*
Problem 25-2A (55 minutes)
Part 1
PROJECT Y
Net income ……………………………………………………………………………...
$ 56,000
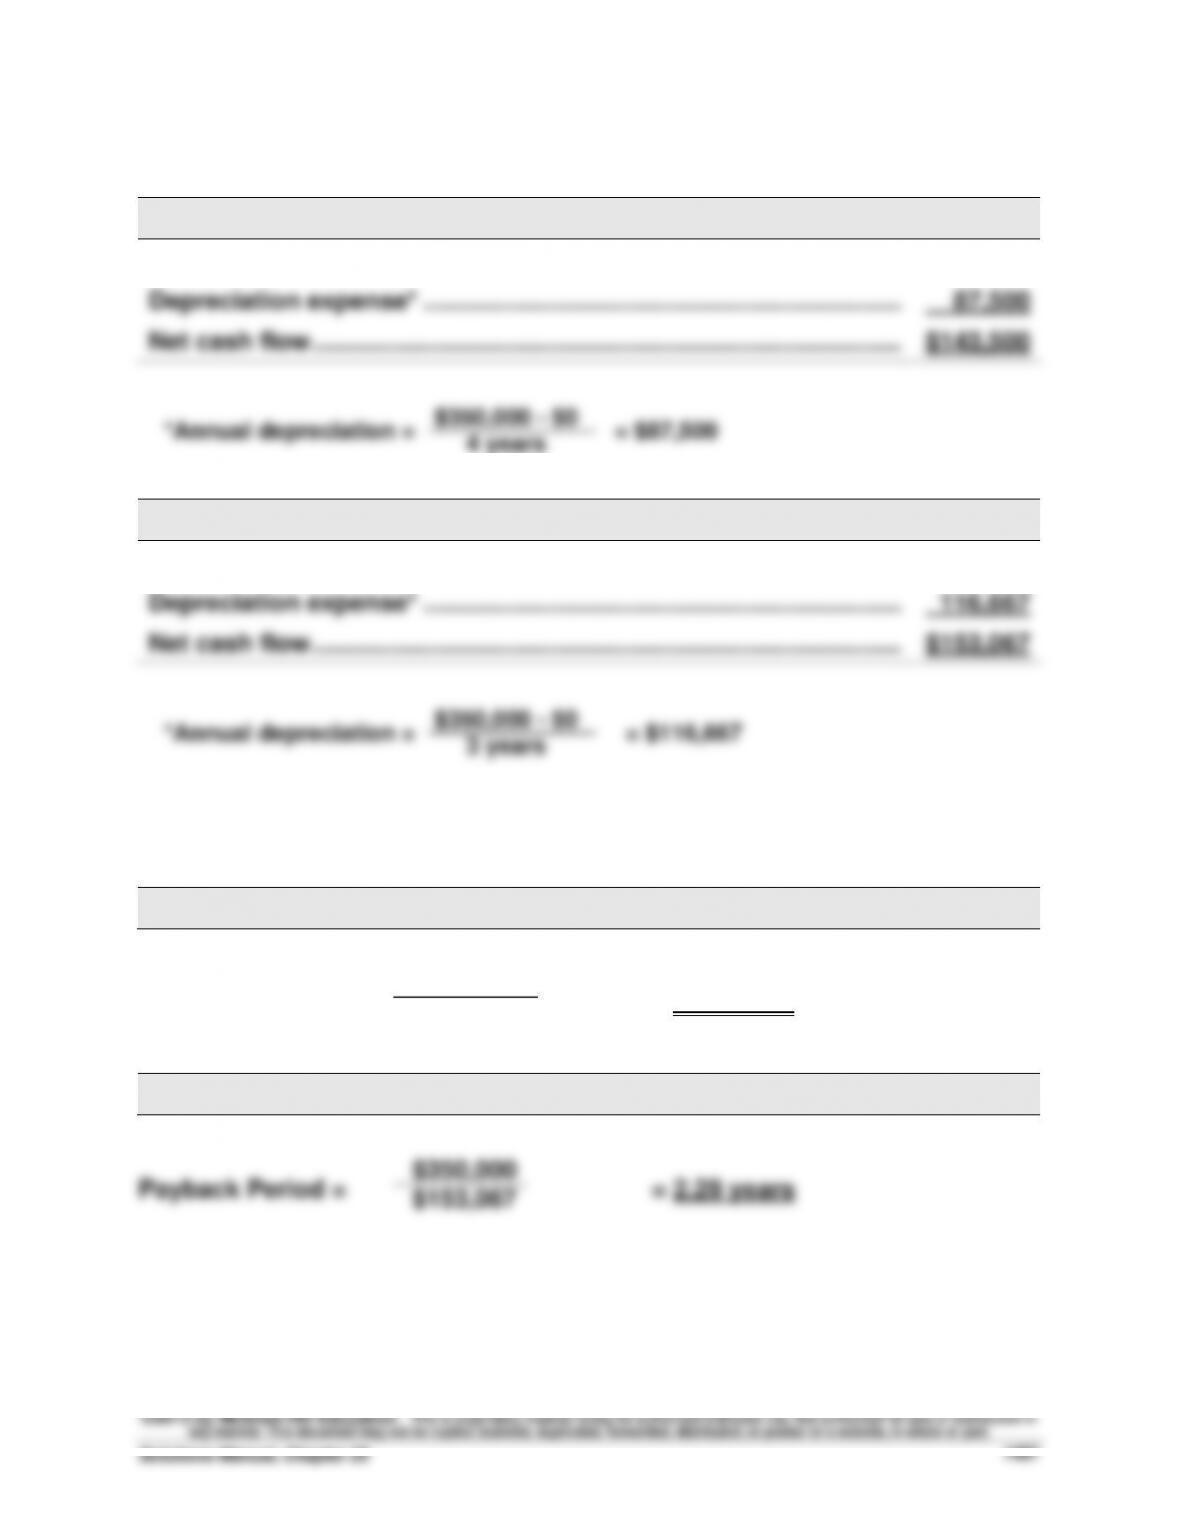
Depreciation expense* …………………………………………………………….
87,500
Net cash flow …………………………………………………………………………..
$143,500
*Annual depreciation = = $87,500
PROJECT Z
Net income ……………………………………………………………………………...
$ 36,400
Depreciation expense* …………………………………………………………….
116,667
Net cash flow …………………………………………………………………………..
$153,067
$350,000 – $0
3 years
Part 2
PROJECT Y
Payback Period = = 2.44 years
PROJECT Z
$350,000
$350,000 – $0
4 years
$350,000
$143,500
PROJECT Z
Problem 25-2A (Continued)
Part 3
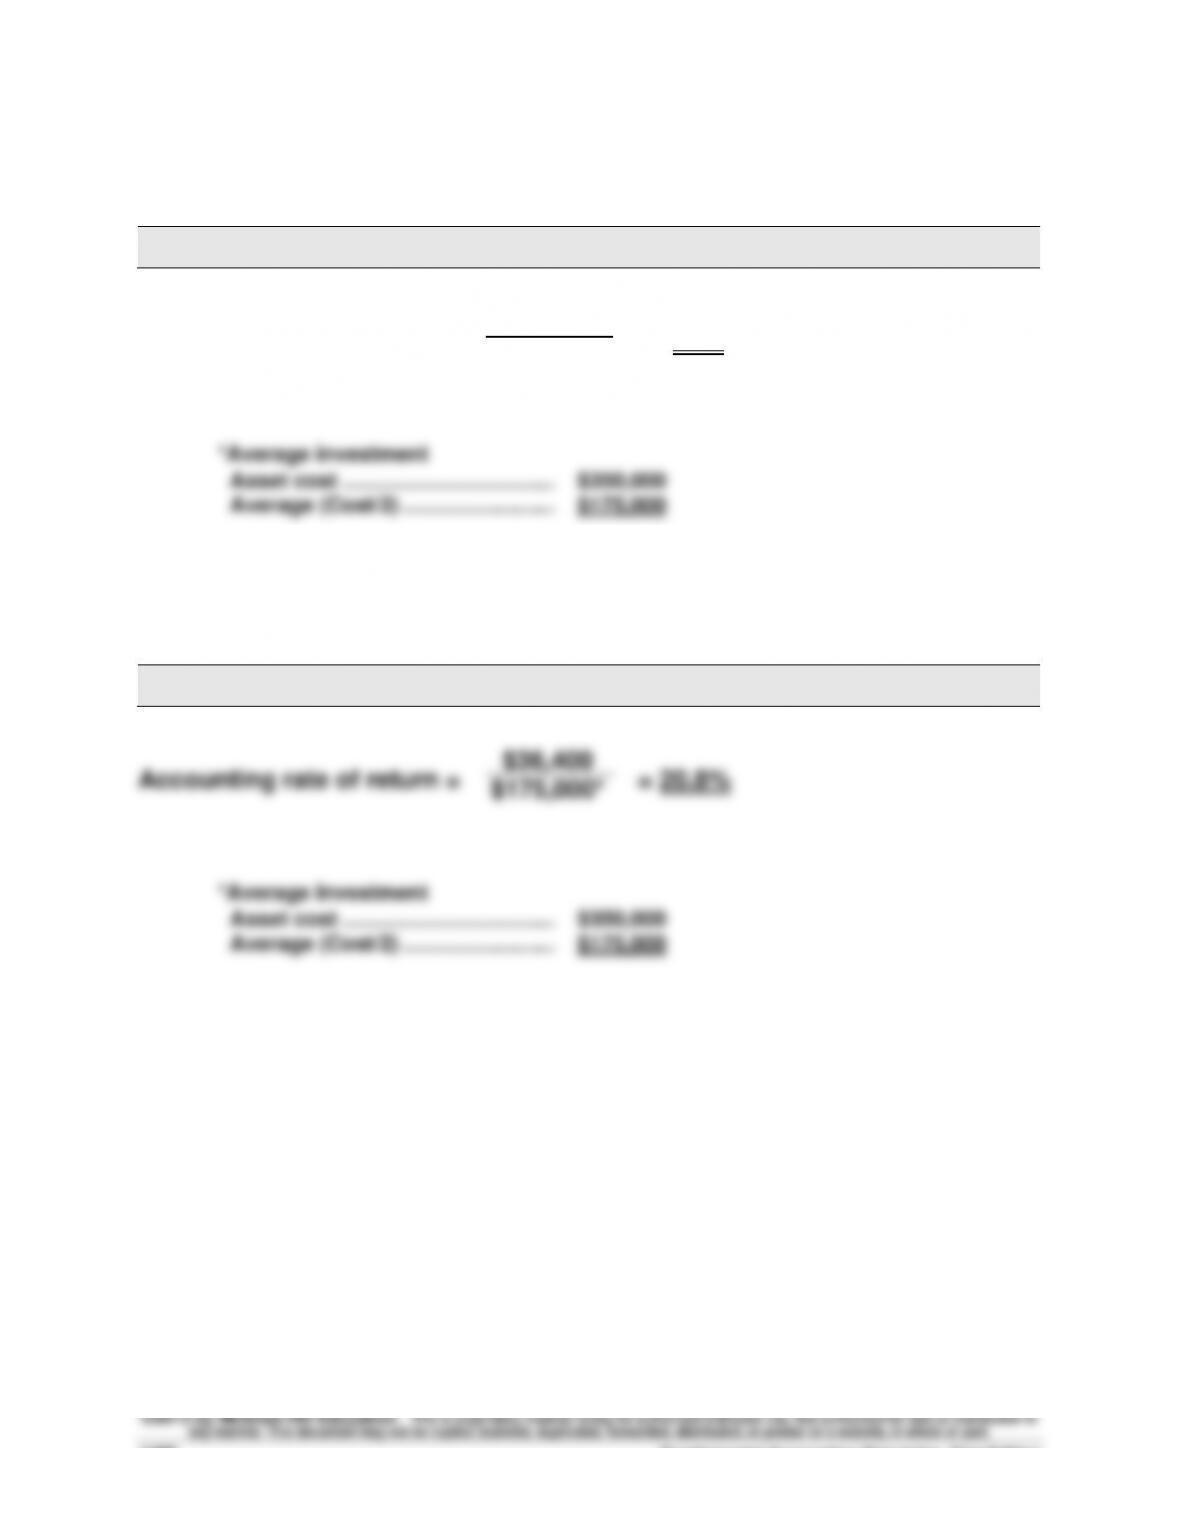
PROJECT Y
Accounting rate of return = = 32%
$56,000
$175,000*
Problem 25-2A (Continued)
Part 4
PROJECT Y
Present Value of Net Cash Flows
Present
Present
Value of
Value of
Net Cash
Flows
1 at 8%
Annuity
Net Cash
Flows
Years 1-4 ………………………………………………
$143,500
3.3121
$475,286
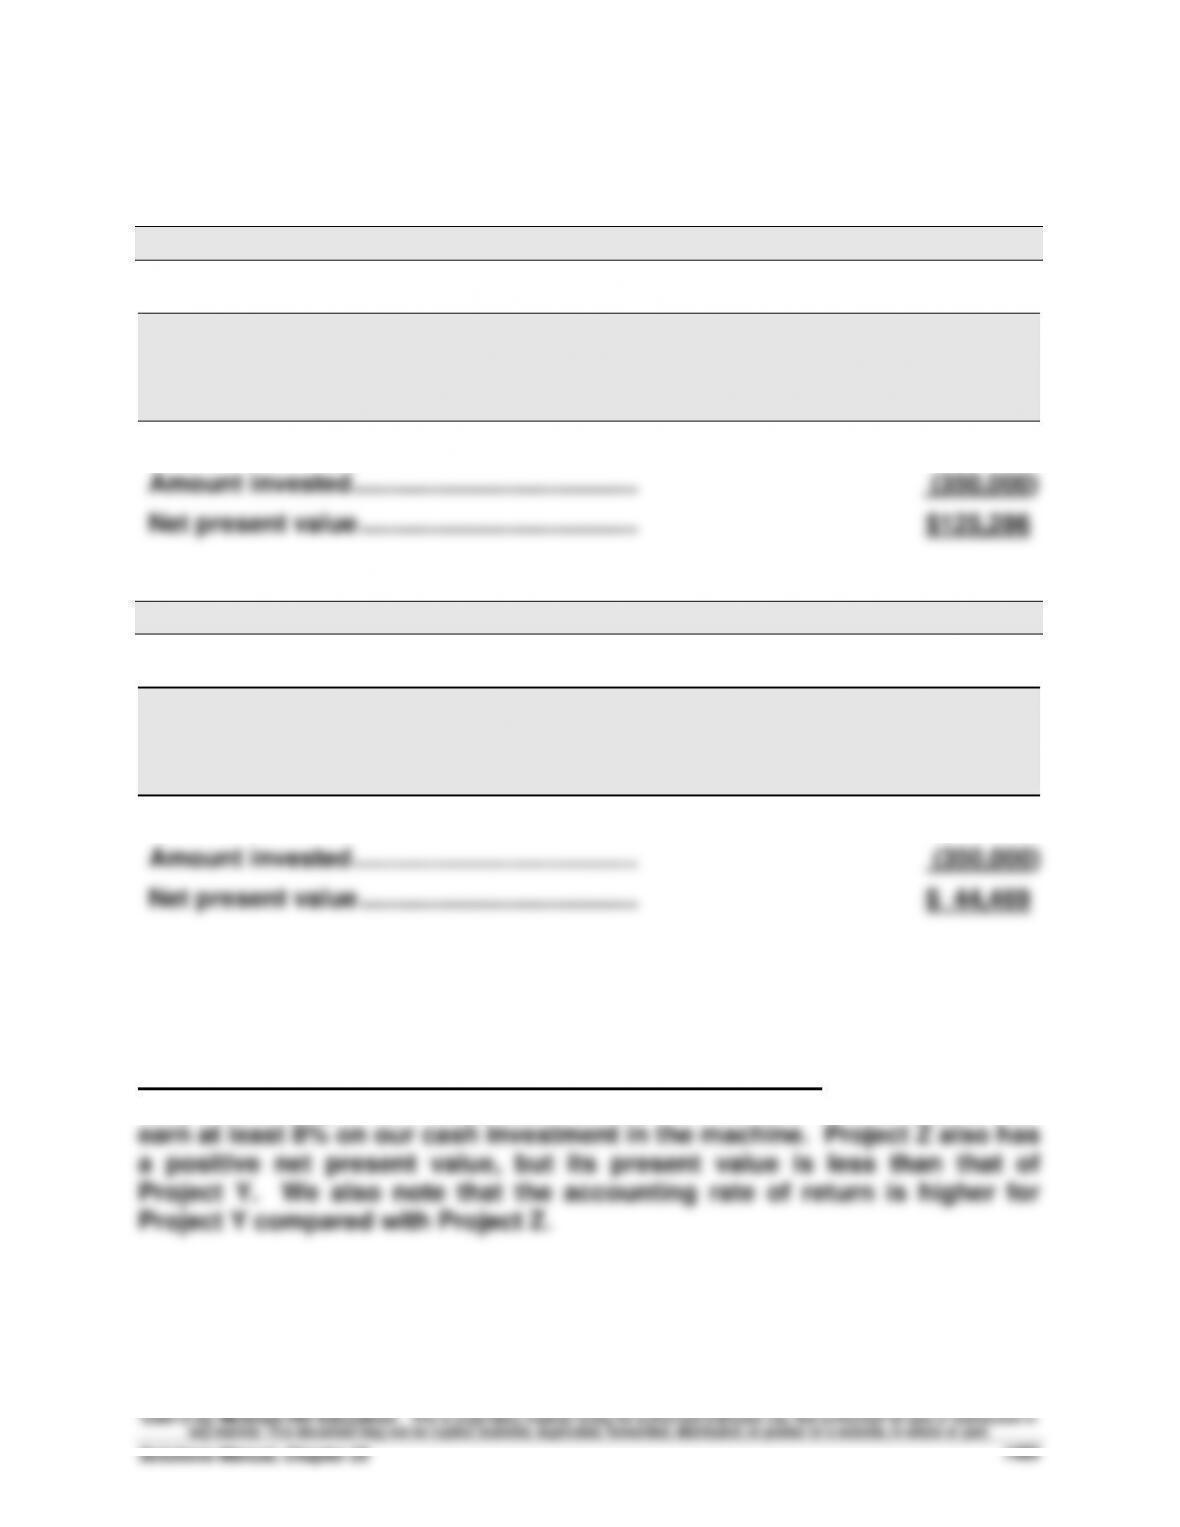
Amount invested …………………………………..
(350,000)
Net present value ………………………………….
$125,286
PROJECT Z
Present Value of Net Cash Flows
Present
Present
Value of
Value of
Net Cash
Flows
1 at 8%
Annuity
Net Cash
Flows
Years 1-3 ………………………………………………
$153,067
2.5771
$394,469
Amount invested …………………………………..
(350,000)
Net present value ………………………………….
$ 44,469
Part 5
Recommendation to management is to pursue Project Y. This is because
Project Y has a positive net present value, which means that we expect it to
Fundamental Accounting Principles, 21st Edition
1490
Problem 25-3A (60 minutes)
Part 1
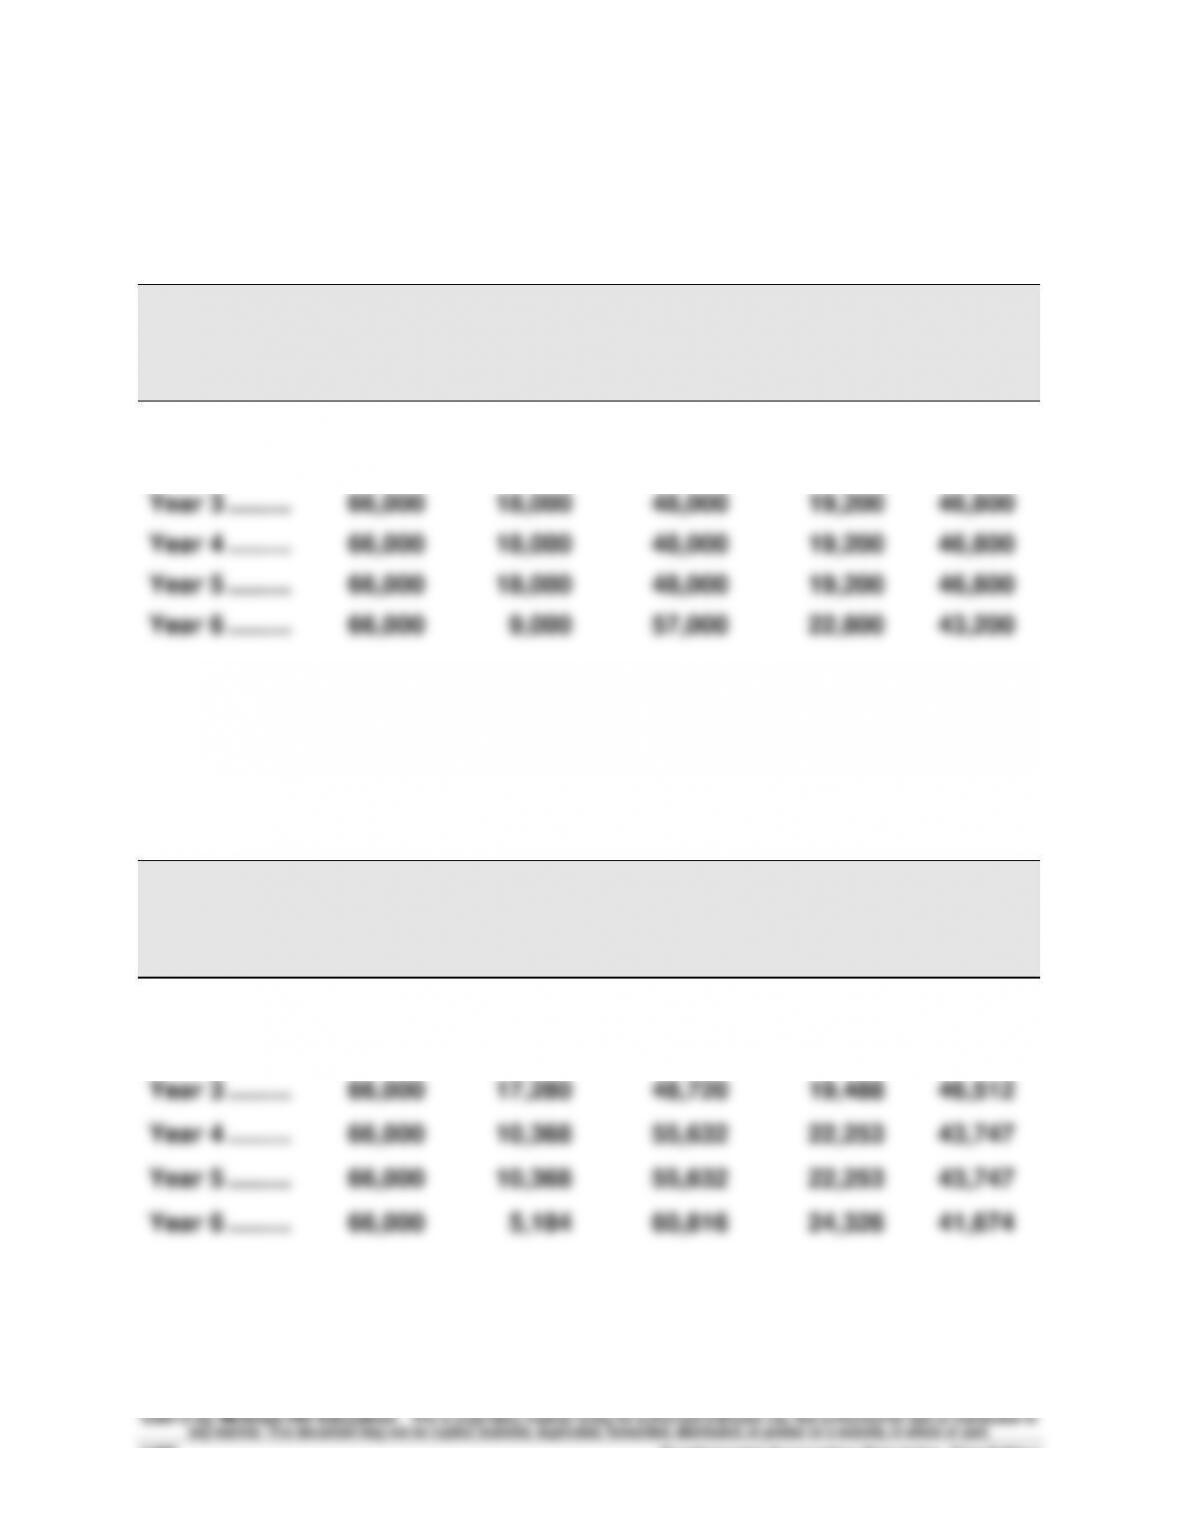
RESULTS USING STRAIGHT-LINE DEPRECIATION
(a)
Income
Before
Deprec.
(b)
Straight–
Line
Deprec.
(c)
Taxable
Income
(a) – (b)
(d)
40%
Income
Taxes
(e)
Net Cash
Flows
(a) – (d)
Year 1 ……….………………
$66,000
$ 9,000
$57,000
$22,800
$43,200
Year 2 ……….………………
66,000
18,000
48,000
19,200
46,800
Year 3 ……….………………
66,000
18,000
48,000
19,200
46,800
Year 4 ……….………………
66,000
18,000
48,000
19,200
46,800
Year 5 ……….………………
66,000
18,000
48,000
19,200
46,800
Year 6 ……….………………
66,000
9,000
57,000
22,800
43,200
Part 2
RESULTS USING MACRS DEPRECIATION
(a)
Income
Before
Deprec.
(b)
MACRS
Deprec.
(c)
Taxable
Income
(a) – (b)
(d)
40%
Income
Taxes
(e)
Net Cash
Flows
(a) – (d)
Year 1 ……….………………
$66,000
$18,000
$48,000
$19,200
$46,800
Year 2 ……….………………
66,000
28,800
37,200
14,880
51,120
Year 3 ……….………………
66,000
17,280
48,720
19,488
46,512
Year 4 ……….………………
66,000
10,368
55,632
22,253
43,747
Year 5 ……….………………
66,000
10,368
55,632
22,253
43,747
Year 6 ……….………………
66,000
5,184
60,816
24,326
41,674
Problem 25-3A (Continued)
Part 3
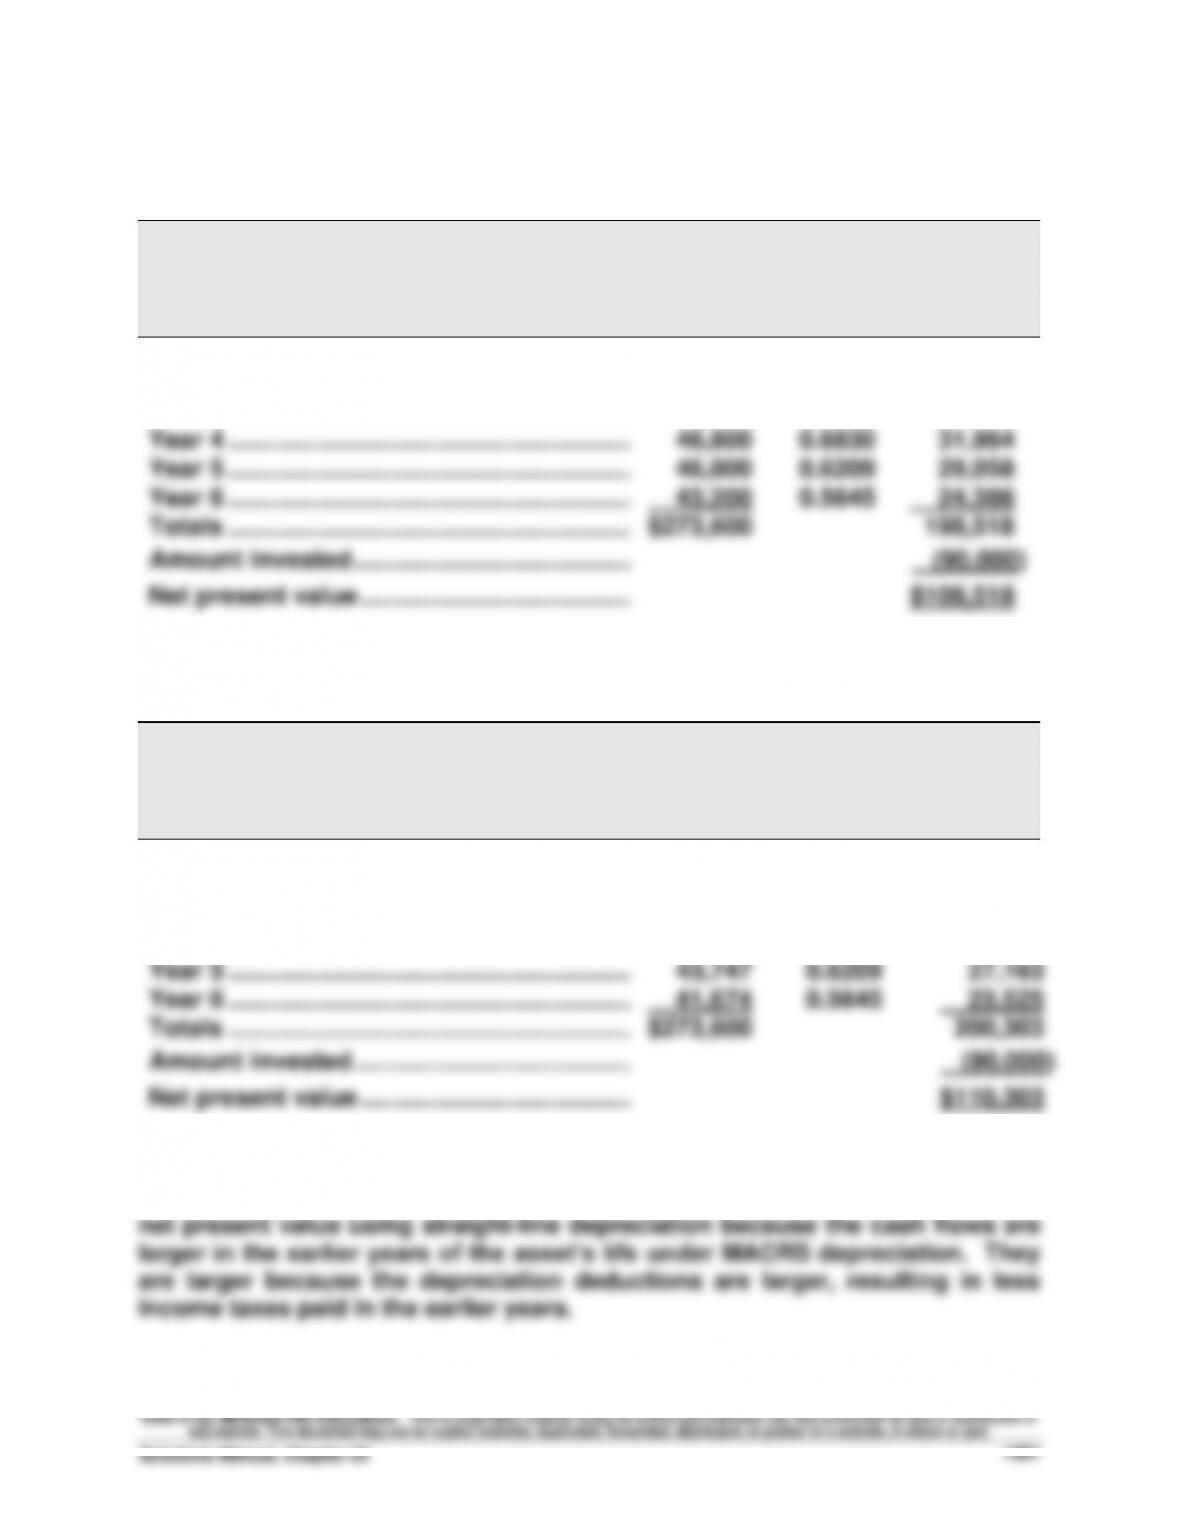
NET PRESENT VALUE OF ASSET USING STRAIGHT-LINE DEPRECIATION
Present
Present
Value of
Net Cash
Flows
Value of
1 at 10%
Net Cash
Flows
Year 1 ………………………………………………….
$ 43,200
0.9091
$ 39,273
Year 2 ………………………………………………….
46,800
0.8264
38,676
Year 3 ………………………………………………….
46,800
0.7513
35,161
Year 4 ………………………………………………….
46,800
0.6830
31,964
Year 5 ………………………………………………….
46,800
0.6209
29,058
Year 6 ………………………………………………….
43,200
0.5645
24,386
Totals ………………………………………………….
$273,600
198,518
Amount invested ………………………………….
(90,000)
Net present value …………………………………
$108,518
Part 4
NET PRESENT VALUE OF ASSET USING MACRS DEPRECIATION
Present
Present
Value of
Net Cash
Flows
Value of
1 at 10%
Net Cash
Flows
Year 1 ………………………………………………….
$ 46,800
0.9091
$ 42,546
Year 2 ………………………………………………….
51,120
0.8264
42,246
Year 3 ………………………………………………….
46,512
0.7513
34,944
Year 4 ………………………………………………….
43,747
0.6830
29,879
Year 5 ………………………………………………….
43,747
0.6209
27,163
Year 6 ………………………………………………….
41,674
0.5645
23,525
Totals ………………………………………………….
$273,600
200,303
Amount invested ………………………………….
(90,000)
Net present value …………………………………
$110,303
Part 5
Analysis: The net present value using MACRS depreciation is greater than the
Fundamental Accounting Principles, 21st Edition
1492
Problem 25-4A (45 minutes)
JONES PRODUCTS
COMPARATIVE INCOME STATEMENTS
(1)
(2)
(3)
Normal
New
Volume
Business
Combined
Sales …………………………………………….……..
$2,400,000
$260,000
$2,660,000
Costs and expenses
Direct materials …………………………..
576,000
72,000
648,000
Direct labor ………………………………………..
144,000
27,000
171,000
Overhead …………………………………………..
320,000
30,000
350,000
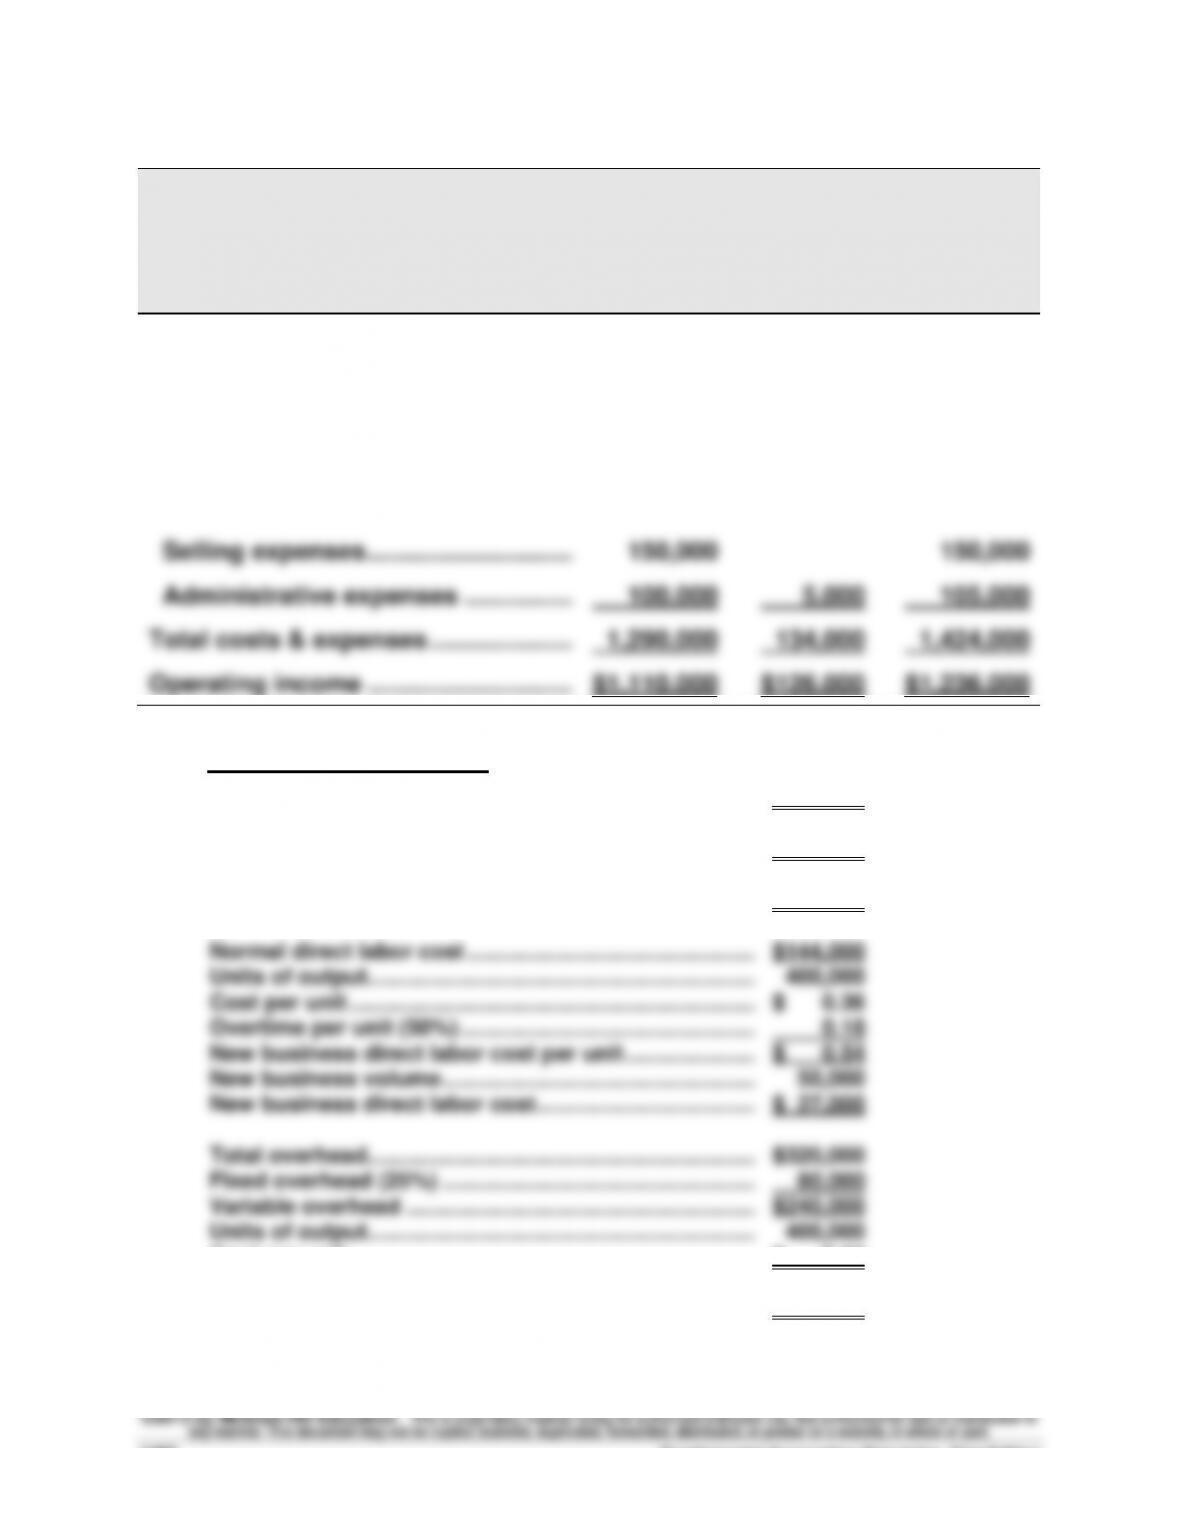
Selling expenses …………………………..
150,000
150,000
Administrative expenses …………….……..
100,000
5,000
105,000
Total costs & expenses ………………………..
1,290,000
134,000
1,424,000
Operating income …………………………..
$1,110,000
$126,000
$1,236,000
Supporting computations
Normal direct materials cost ………………………………….
$576,000
Units of output ……………………………………………………...
400,000
Cost per unit ………………………………………………………...
$ 1.44
New business volume …………………………………………...
50,000
New business direct materials cost ………………………..
$ 72,000
Normal direct labor cost ………………………………………..
$144,000
Units of output ……………………………………………………...
400,000
Cost per unit ………………………………………………………...
$ 0.36
Overtime per unit (50%) ………………………………………...
0.18
New business direct labor cost per unit ………………….
$ 0.54
New business volume …………………………………………...
50,000
New business direct labor cost ……………………………...
$ 27,000
Total overhead ……………………………………………………...
$320,000
Fixed overhead (25%) …………………………………………...
80,000
Variable overhead ………………………………………………...
$240,000
Units of output ……………………………………………………...
400,000
Cost per unit ………………………………………………………...
$ 0.60
New business volume …………………………………………...
50,000
New business variable overhead cost …………………….
$ 30,000