Chapter 25
Capital Budgeting and Managerial
Decisions
QUESTIONS
1. Capital budgeting decisions require careful analysis because they are generally
the most difficult and risky decisions that management faces.
2. Capital budgeting is the process of planning the acquisition or sale of plant
assets.
3. Capital budgeting decisions are risky because: (1) the outcomes are uncertain,
4. The payback period ignores both the present value of cash flows and all cash
flows after the payback period.
5. A shorter payback period is desirable because management prefers to reduce
the risk that the investment might not be profitable over the long run. As a result
6. If net income is earned evenly throughout each year and straight-line
7. When the present value of expected net cash flows, discounted at 10%, exceeds
the amount invested it indicates that the expected rate of return on the
Fundamental Accounting Principles, 21st Edition
1464
8. Receiving $100 one year from today is worth less than $100 today because a
0.8929 = $89.29 (the present value factor is taken from Table B.1). This means
9. The return on an investment must cover the interest and provide an additional
profit to reward the company for risk. For example, if money can be borrowed at
companies with average risk projects.
10. Accelerated depreciation produces larger tax deductions and lower tax
payments in the early years of an asset’s life compared with straight-line
11. An out-of-pocket cost requires a current outlay of cash. An opportunity cost is
12. Sunk costs are irrelevant because they remain the same whether the product is
sold in its present condition or processed further.
13. There are virtually no incremental costs associated with shipping the additional
iPod. The company’s employees would not receive any additional compensation
14. KTM management could use one of the following common methods to evaluate
15. The company might be willing to sell the units internationally if (a) the company
has excess capacity, (b) the incremental costs of manufacturing and selling the
QUICK STUDIES
Quick Study 25-1 (10 minutes)
Quick Study 25-2 (10 minutes)
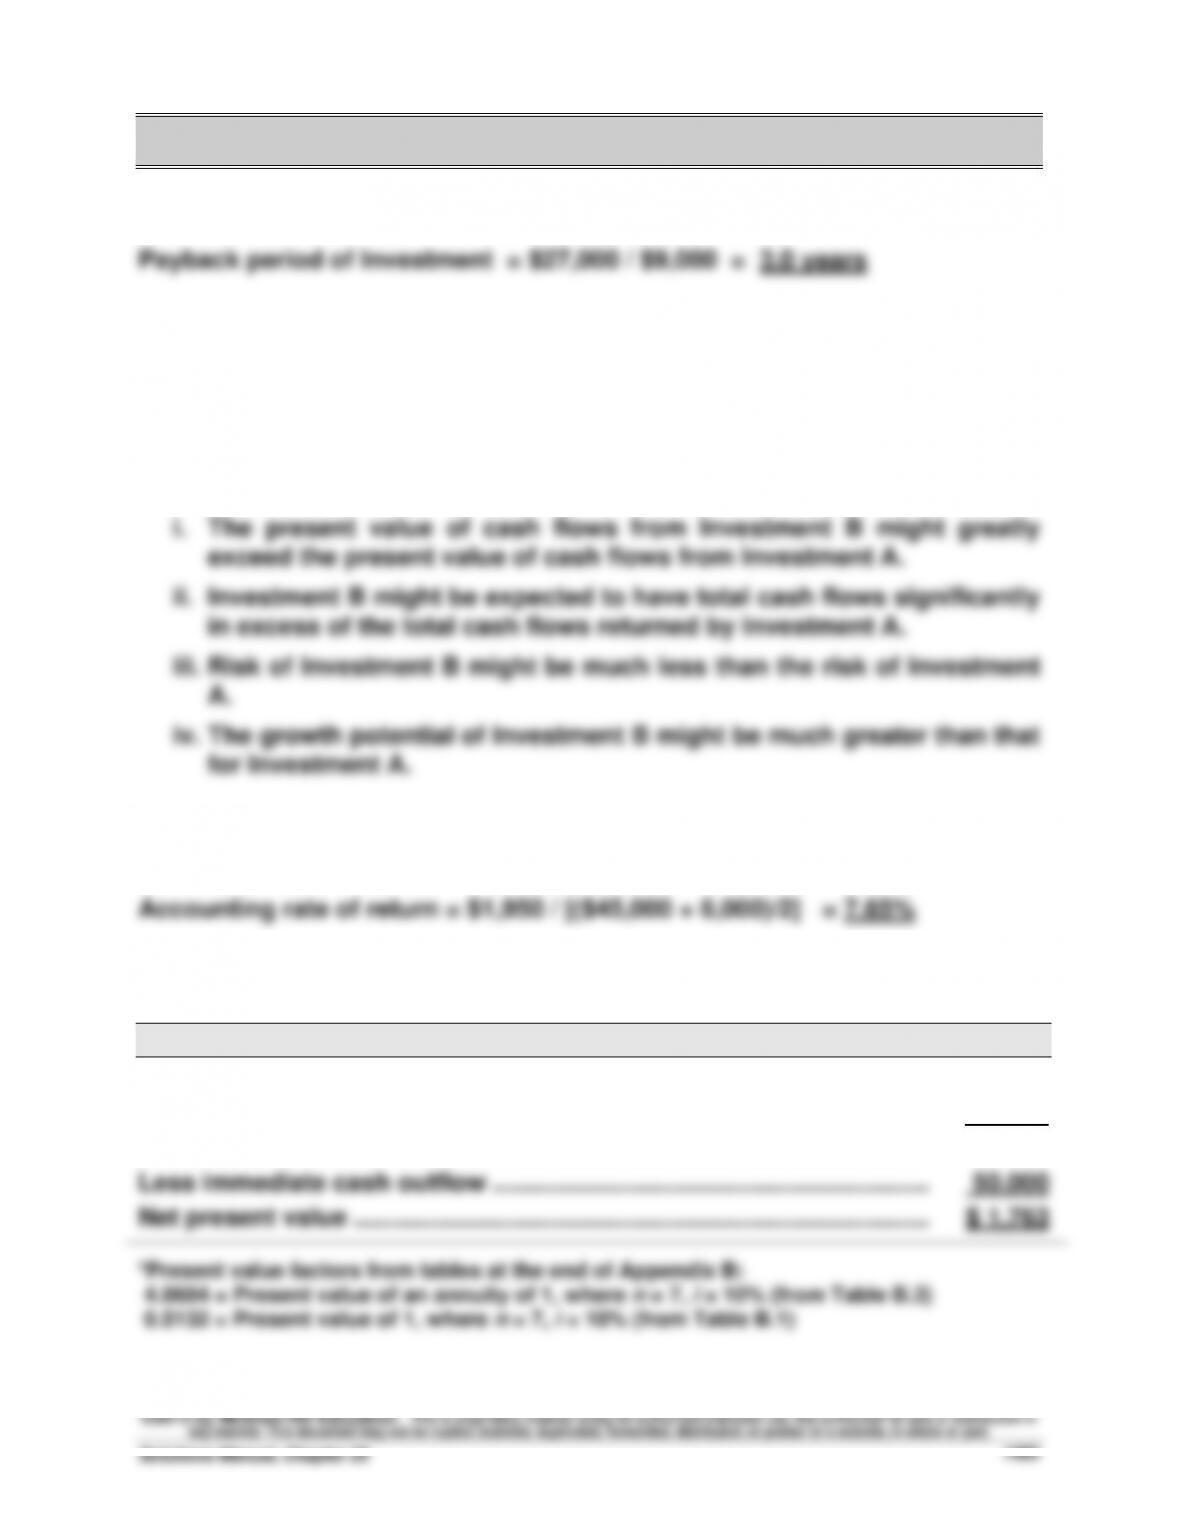
1. If all else is equal, Investment A would be preferred over Investment B
because of A’s shorter payback period.
2. However, if the investments are different, then there are at least four
reasons why Investment B might be preferred over Investment A:
Quick Study 25-3 (10 minutes)
Quick Study 25-4 (15 minutes)
Net present value of investment*
Present value of seven $10,000 cash inflows (10,000 x 4.8684) ……..……
$48,684
Present value of $6,000 at end of seven years (6,000 x 0.5132) ……..……
3,079
Present value of cash inflows ……………………………………………………….
51,763
Less immediate cash outflow ……………………………………………………….
50,000
Net present value ………………………………………………………………………..……
$ 1,763
*Present value factors from tables at the end of Appendix B:
4.8684 = Present value of an annuity of 1, where n = 7, i = 10% (from Table B.3)
0.5132 = Present value of 1, where n = 7, i = 10% (from Table B.1)
Fundamental Accounting Principles, 21st Edition
1466
Quick Study 25-5 (10 minutes)
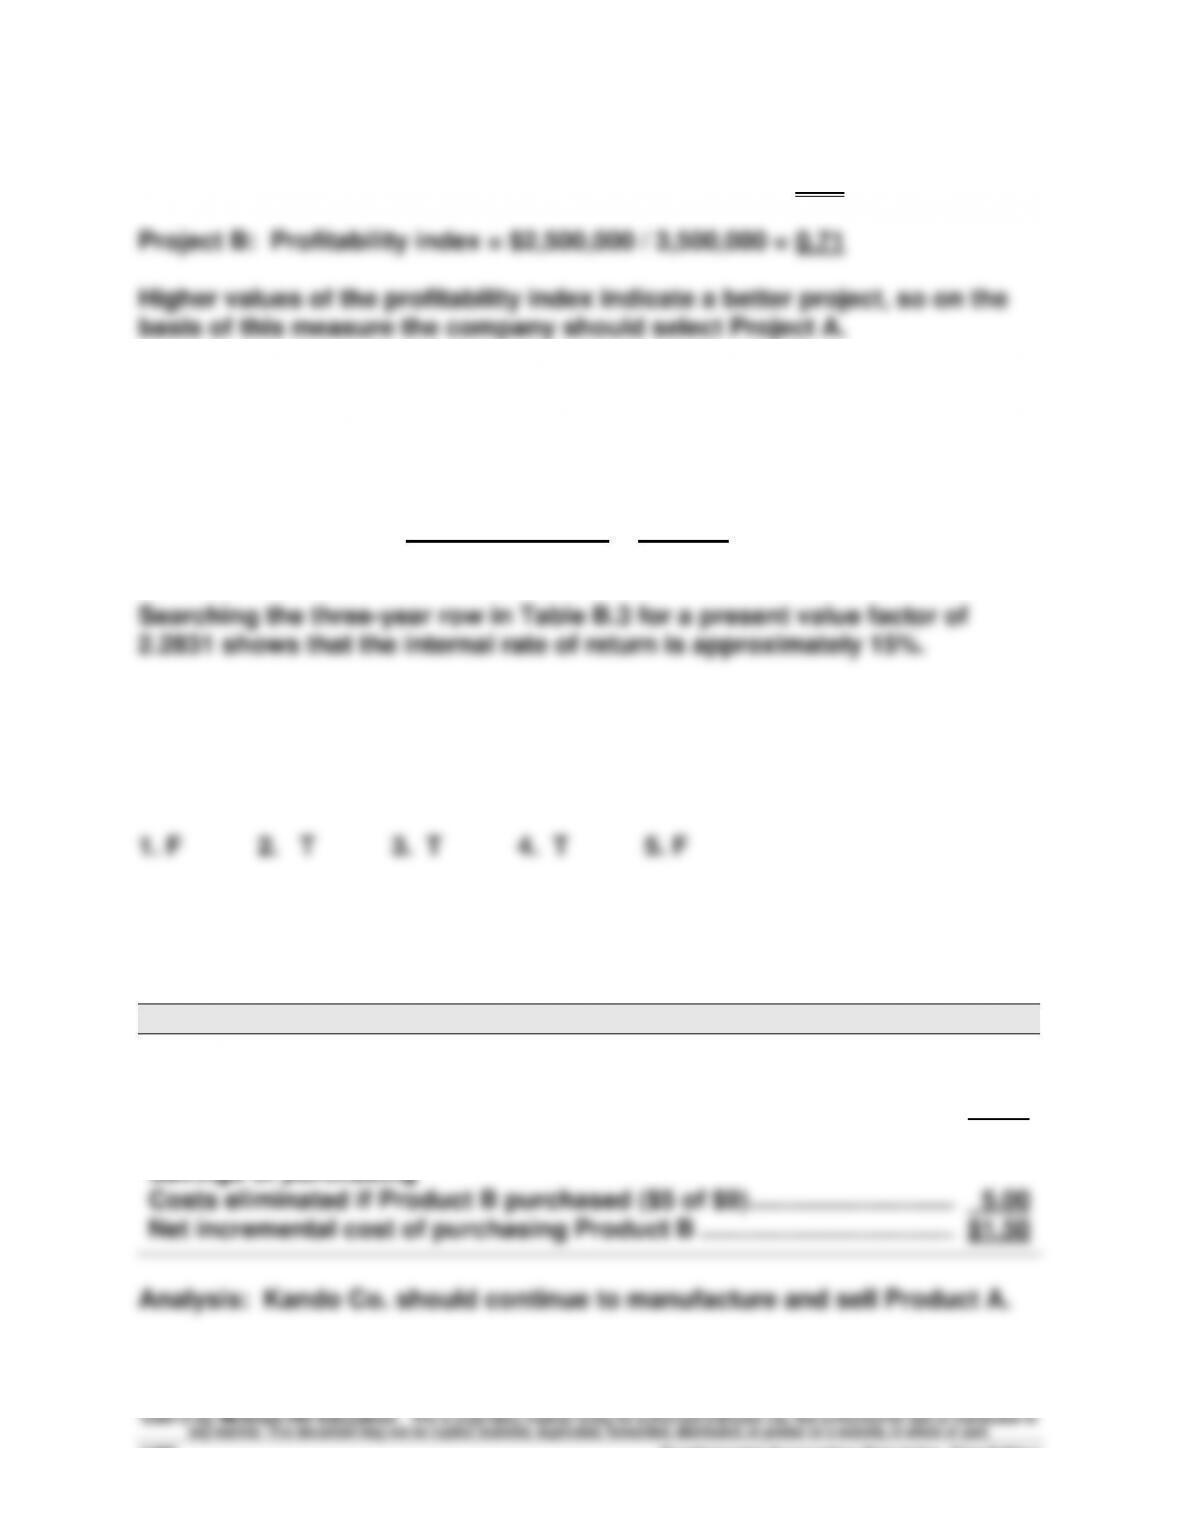
Project A: Profitability index = $1,100,000 / 400,000 = 2.75
Quick Study 25-6 (10 minutes)
Present value factor = Amount invested = $47,946 = 2.2831
Net cash flows $21,000
Quick Study 25-7 (5 minutes)
Quick Study 25-8 (15 minutes)
Incremental cost analysis
Costs of purchasing
Cost to purchase Product B …………………………………………………………..…
$5.00
Revenue loss from reduced price ($13.50 – $12.00) …………………………..
1.50
Total cost …………………………………………………………………………………………
6.50
Savings of purchasing
Costs eliminated if Product B purchased ($5 of $9) …………………………..
5.00
Net incremental cost of purchasing Product B ……………………………….…
$1.50
Analysis: Kando Co. should continue to manufacture and sell Product A.
Quick Study 25-9 (15 minutes)
X
Y
Contribution margin per unit ………………………………………..…
$ 5.00
$ 4.00
Production hours per unit …………………………………………….…
1/2
1/3
Contribution margin per production hour ……………………..…
$10.00
$12.00
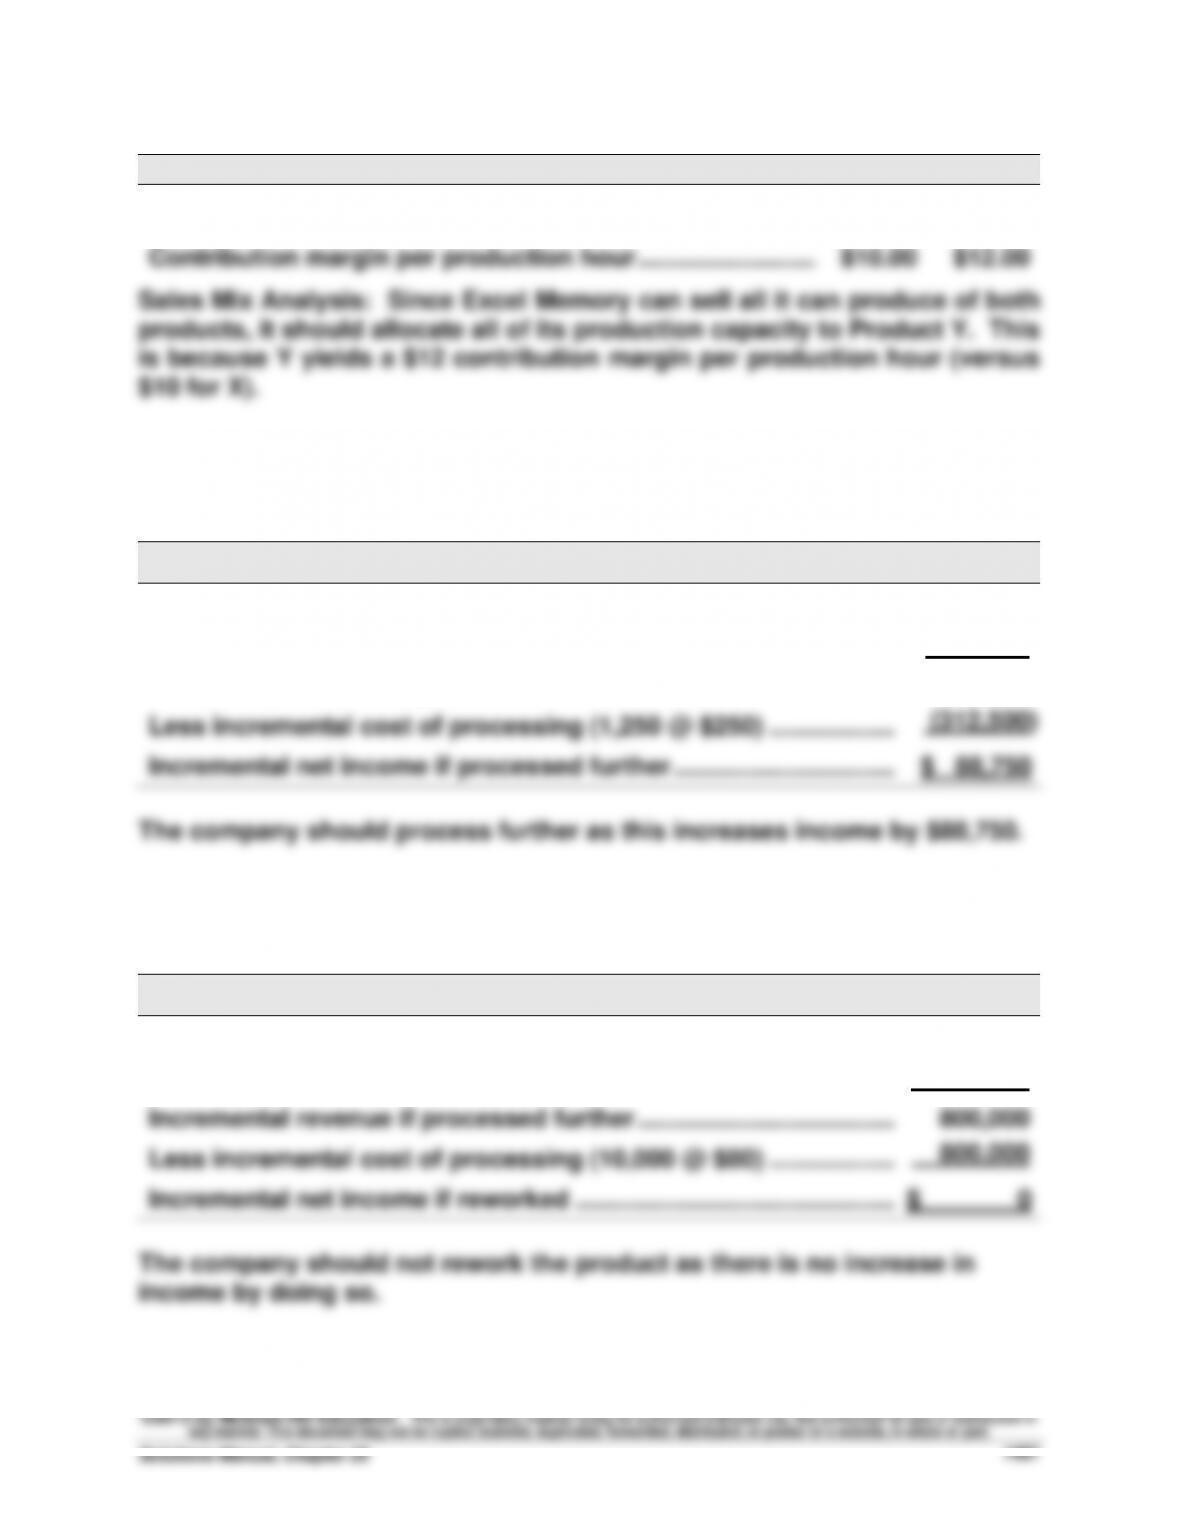
Sales Mix Analysis: Since Excel Memory can sell all it can produce of both
products, it should allocate all of its production capacity to Product Y. This
is because Y yields a $12 contribution margin per production hour (versus
$10 for X).
Quick Study 25-10 (15 minutes)
INCREMENTAL REVENUE AND COST OF ADDITIONAL PROCESSING
Revenue if processed further (1,250 @ $375) …………………………..
$468,750
Revenue if sold as is …………………………………………………………….…
67,500
Incremental revenue if processed further ……………………………….…
401,250
Less incremental cost of processing (1,250 @ $250) …………………
(312,500)
Incremental net income if processed further …………………………..
$ 88,750
The company should process further as this increases income by $88,750.
Quick Study 25-11 (15 minutes)
INCREMENTAL REVENUE AND COST OF REWORK
Revenue if processed further (10,000 @ $110) ………………………..…
$1,100,000
Revenue if sold as is (10,000 @ $30) …………………………………………
300,000
Incremental revenue if processed further ……………………………….…
800,000
Less incremental cost of processing (10,000 @ $80) …………………
800,000
Incremental net income if reworked ……………………………………….…
$ 0
The company should not rework the product as there is no increase in
income by doing so.
Fundamental Accounting Principles, 21st Edition
1468
Quick Study 25-12 (15 minutes)
INCREMENTAL INCOME FROM NEW BUSINESS
Sales (750 units @ $250) ……………………………………………………….
$ 187,500
Incremental variable costs (750 units @ $150) ……………………….….
(112,500)
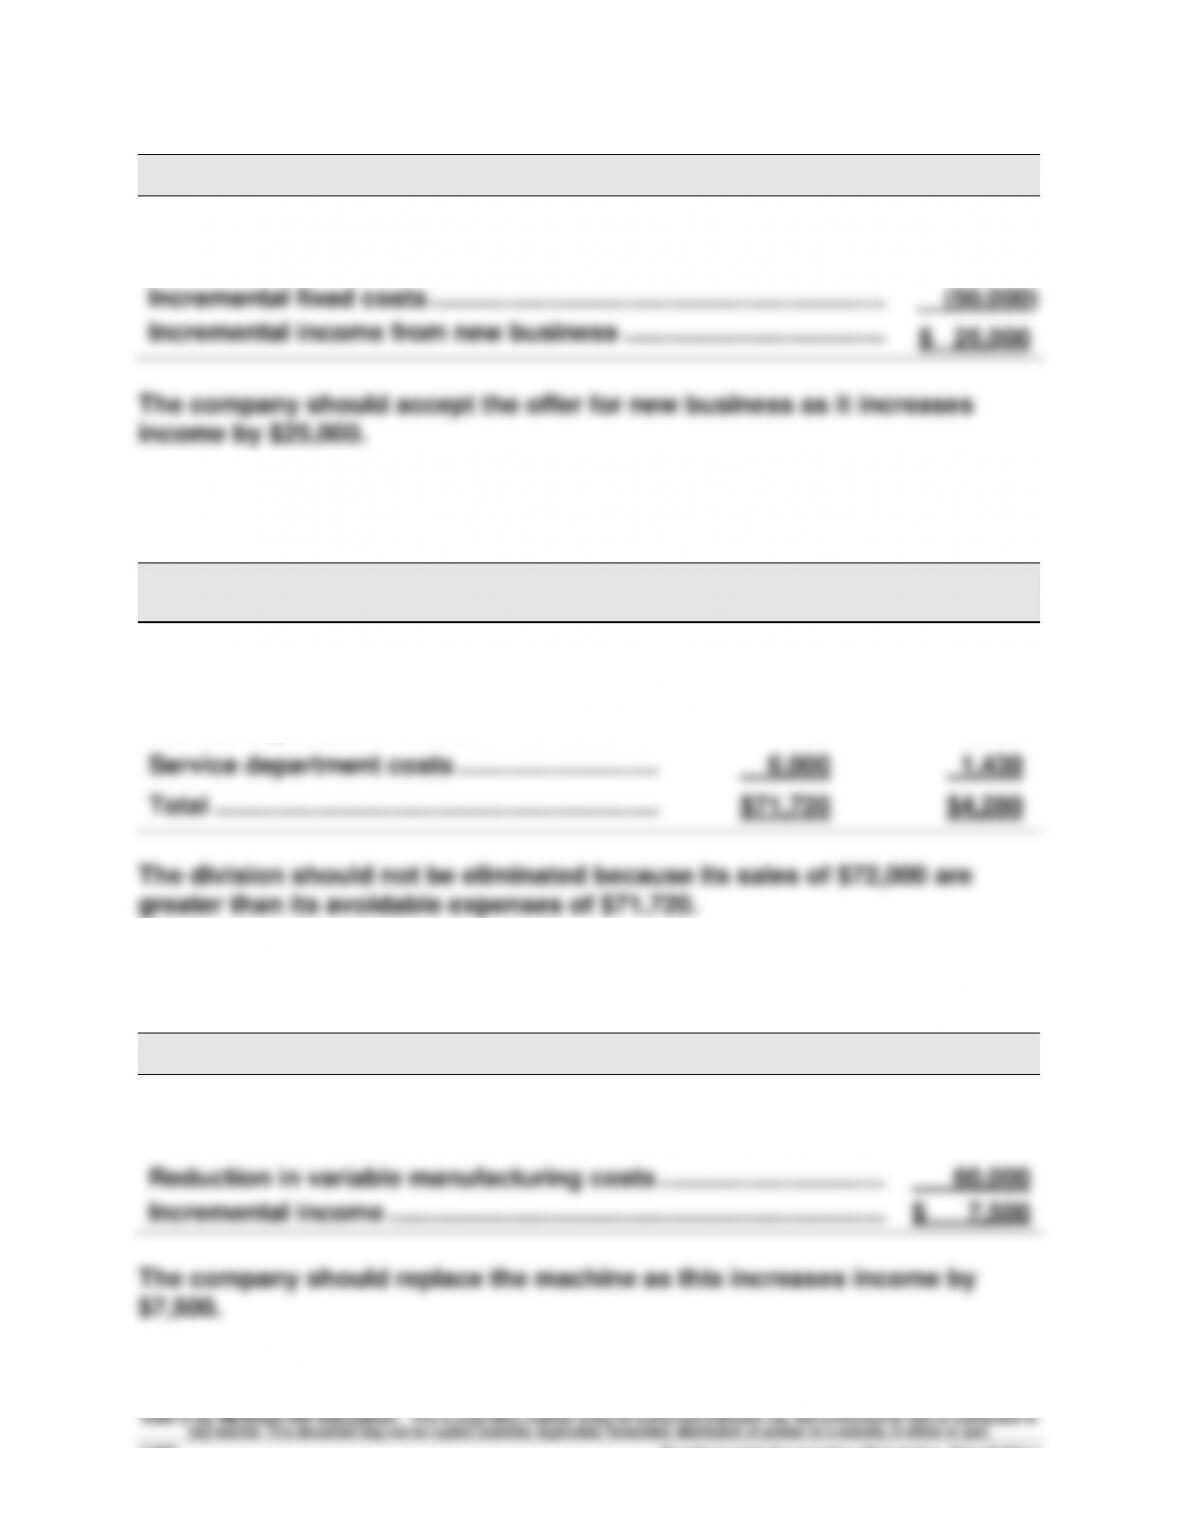
Incremental fixed costs …………………………………………………………………….
Incremental income from new business ………………………………..………….
(50,000)
$ 25,000
The company should accept the offer for new business as it increases
income by $25,000.
Quick Study 25-13 (15 minutes)
Avoidable
Unavoidable
Expenses
Expenses
Cost of goods sold ………………………………….……
$56,000
—-
Direct expenses ……………………………………………
9,250
$1,250
Indirect expenses…………………………………….……
470
1,600
Service department costs ………………………..…
6,000
1,430
Total ……………………………………………………….
$71,720
$4,280
The division should not be eliminated because its sales of $72,000 are
greater than its avoidable expenses of $71,720.
Quick Study 25-14 (10 minutes)
INCREMENTAL INCOME FROM REPLACING MACHINE
Cost to buy new machine ……………………………………………………....
$(112,500)
Cash received to trade in old machine …………………………………..………….
60,000
Reduction in variable manufacturing costs ……………………………………….
Incremental income ………………………………………………………………………….
60,000
$ 7,500
The company should replace the machine as this increases income by
$7,500.
Quick Study 25-15 (15 minutes)
Year
Cash flows
Present value
of 1 at 10%
Present value of
cash flows
Cumulative
present value of
cash flows
0
$(90,000)
1.0000
$(90,000)
$(90,000)
1
35,000
0.9091
31,819
(58,181)
2
35,000
0.8264
28,924
(29,257)
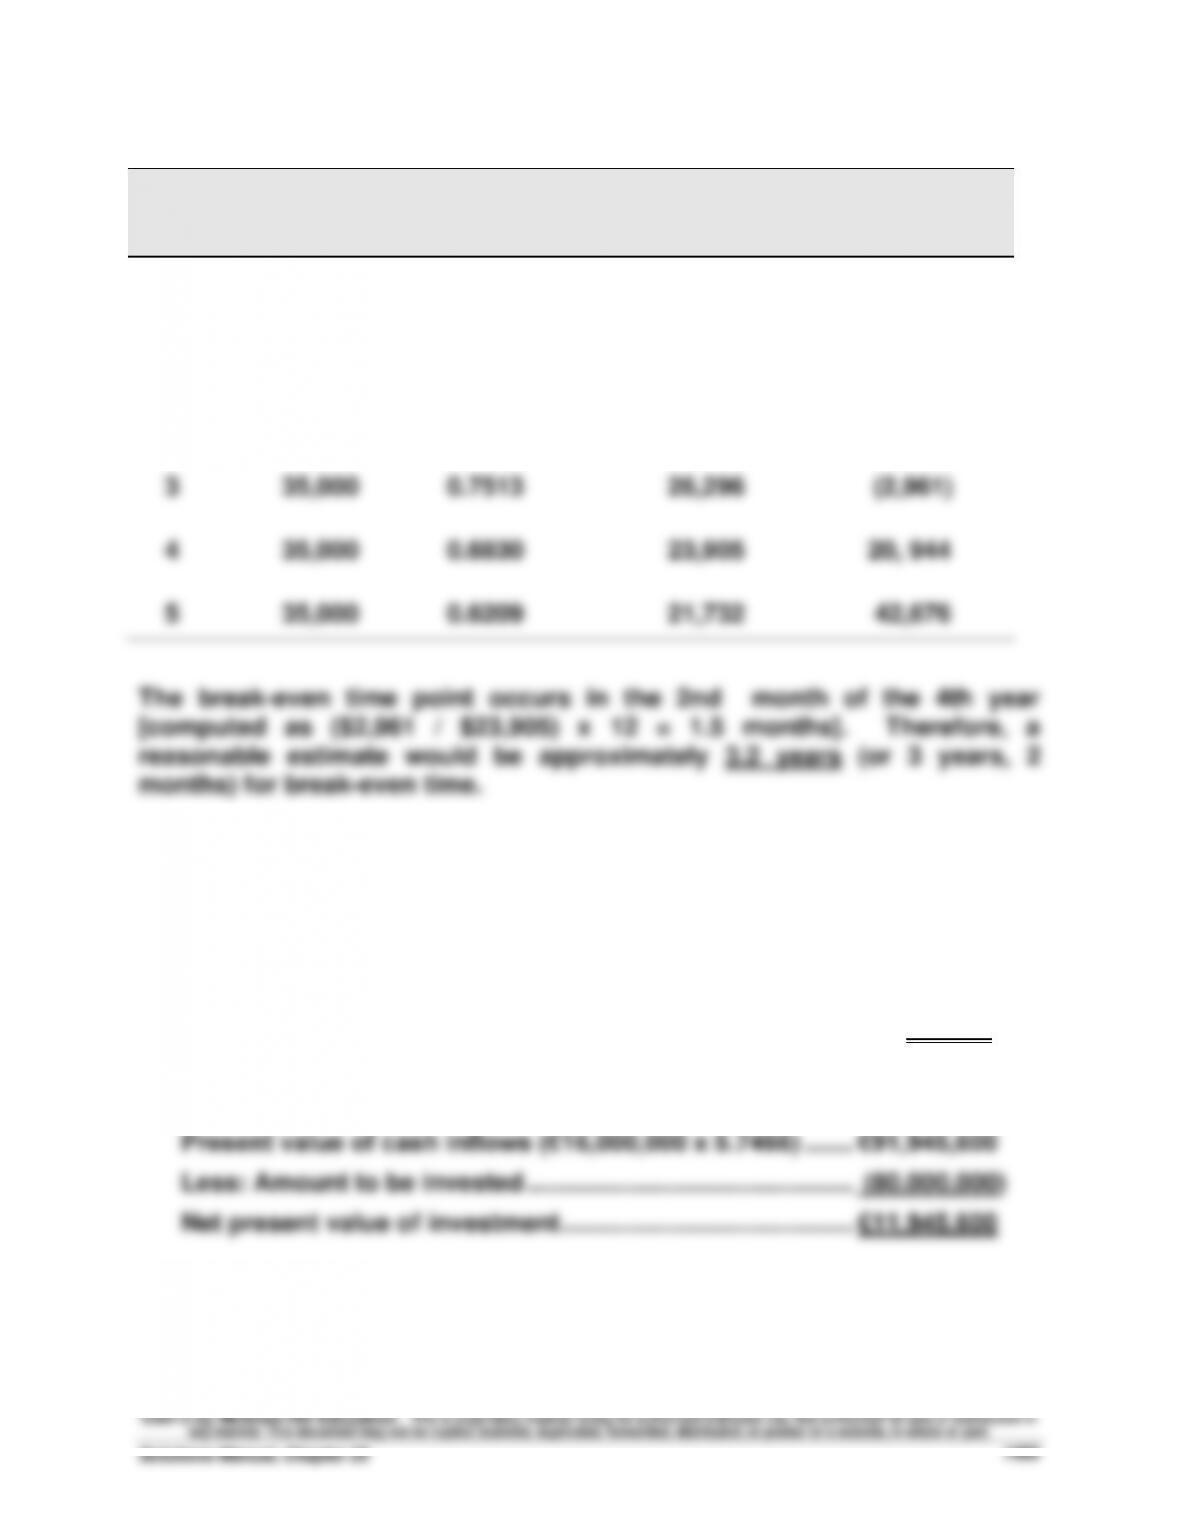
3
35,000
0.7513
26,296
(2,961)
4
35,000
0.6830
23,905
20, 944
5
35,000
0.6209
21,732
42,676
The break-even time point occurs in the 2nd month of the 4th year
[computed as ($2,961 / $23,905) x 12 = 1.5 months]. Therefore, a
reasonable estimate would be approximately 3.2 years (or 3 years, 2
months) for break-even time.
Quick Study 25-16 (15 minutes)
1. Payback period of investment = €80,000,000 / €16,000,000 = 5 years
2.
Fundamental Accounting Principles, 21st Edition
1470
EXERCISES
Exercise 25-1 (20 minutes)
Annual Net
Cumulative
Cash Flows
Cash Flows
Year 1 ………………………………………………………..…
$ 60,000
$ 60,000
Year 2 ………………………………………………………..…
40,000
100,000
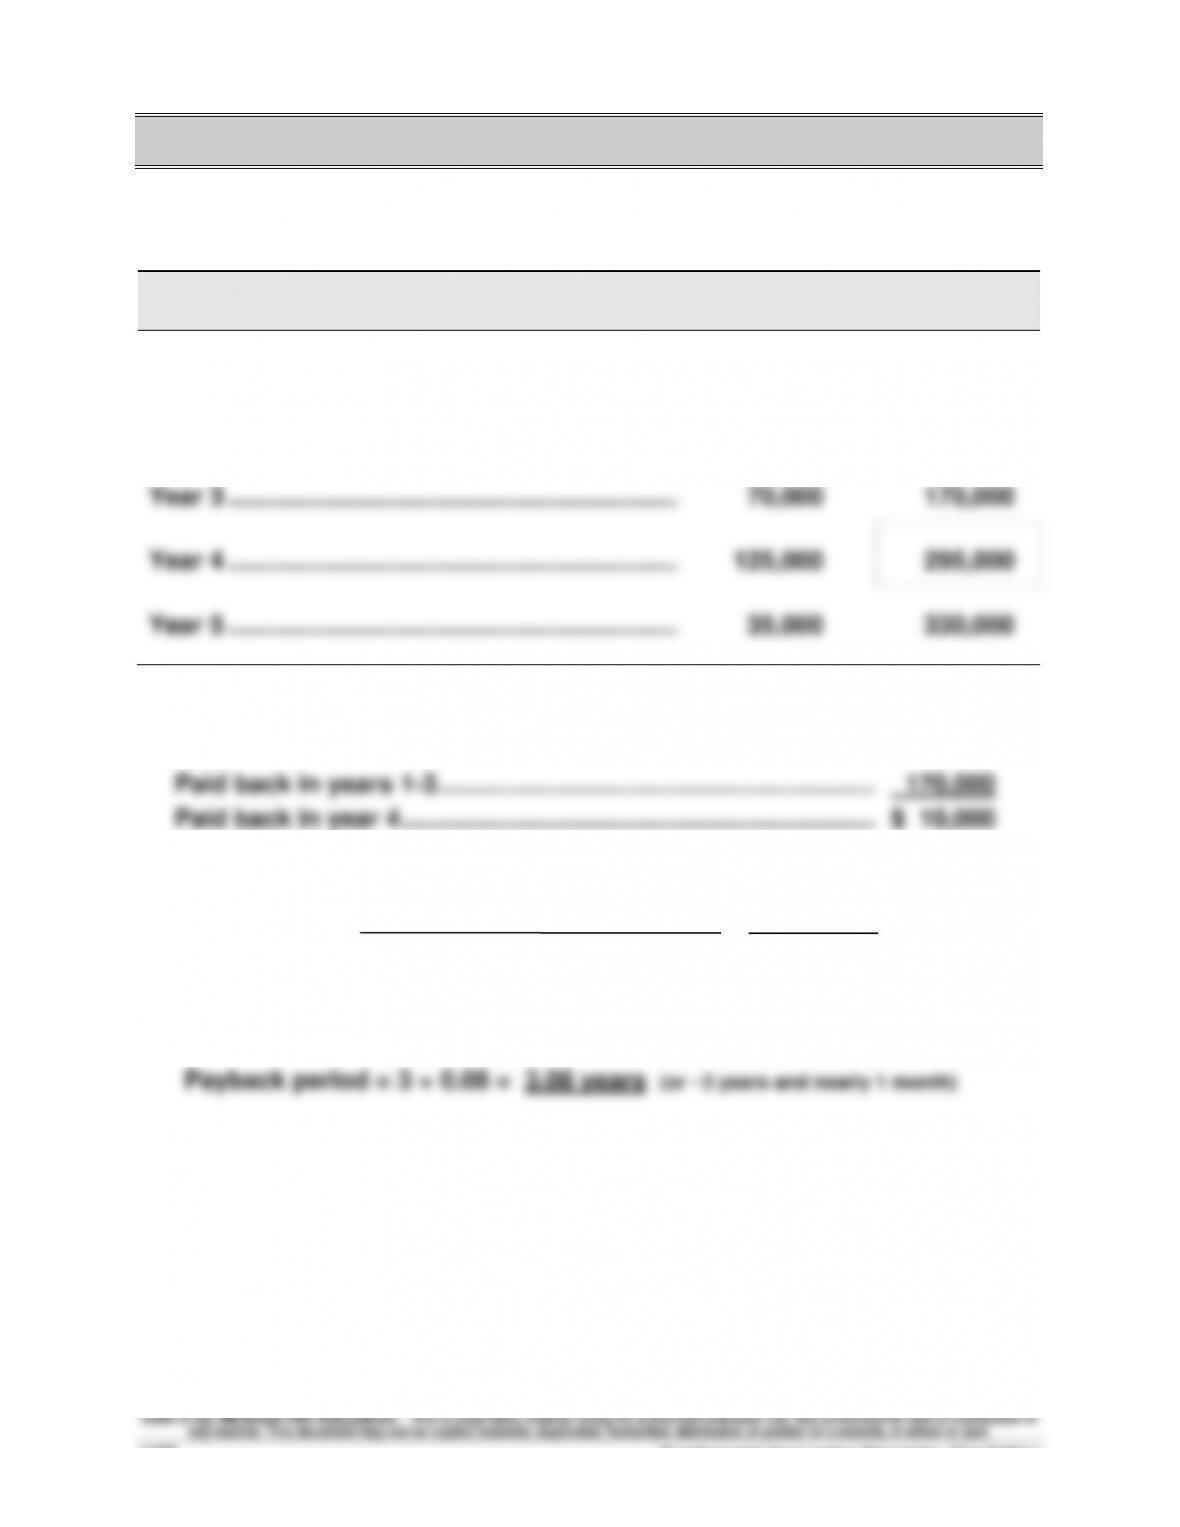
Year 3 ………………………………………………………..…
70,000
170,000
Year 4 ………………………………………………………..…
125,000
295,000
Year 5 ………………………………………………………..…
35,000
330,000
Cost of investment …………………………………………………………………..
$180,000
Paid back in years 1-3 ……………………………………………………….
170,000
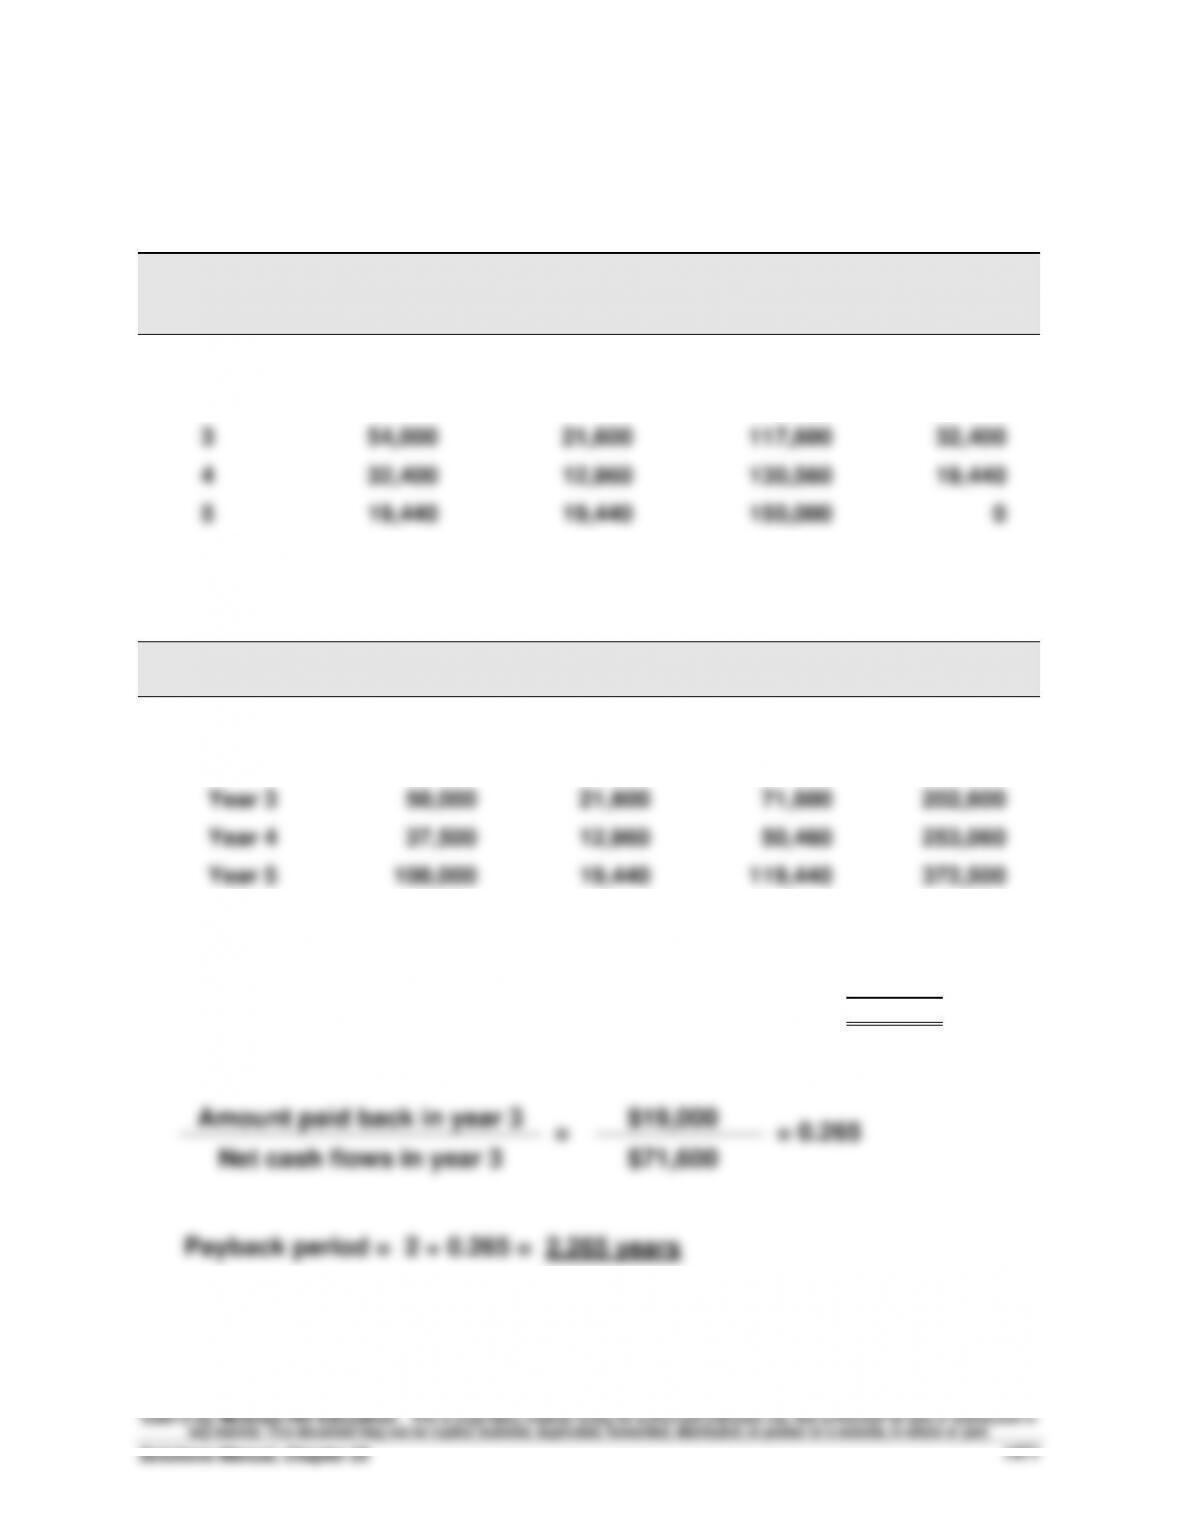
Paid back in year 4 …………………………………………………………………..
$ 10,000
Part of year = = = 0.08
Amount paid back in year 4
Net cash flow in year 4
$10,000
$125,000
Exercise 25-2 (30 minutes)
COMPUTATION OF ANNUAL DEPRECIATION EXPENSE
Double-declining balance rate = (100% / 5) x 2 = 40%
Annual Depr.
Beginning
(40% of
Accum. Depr.
Ending
Year
Book Value
Book Value)
at Year-End
Book Value
1
$150,000
$60,000
$ 60,000
$90,000
2
90,000
36,000
96,000
54,000
3
54,000
21,600
117,600
32,400
4
32,400
12,960
130,560
19,440
5
19,440
19,440
150,000
0
ANNUAL CASH FLOWS
Net
Income
Depreciation
Net Cash
Flow
Cumulative
Cash Flow
Year 1
$ 10,000
$60,000
$ 70,000
$ 70,000
Year 2
25,000
36,000
61,000
131,000
Year 3
50,000
21,600
71,600
202,600
Year 4
37,500
12,960
50,460
253,060
Year 5
100,000
19,440
119,440
372,500
Cost of machine ……………………………………………………………..…….
$150,000
Paid back in years 1 and 2 …………………………..…………………..…….
131,000
Paid back in year 3 ………………………………………………………….…….
$ 19,000
Fundamental Accounting Principles, 21st Edition
1472
Exercise 25-3 (20 minutes)
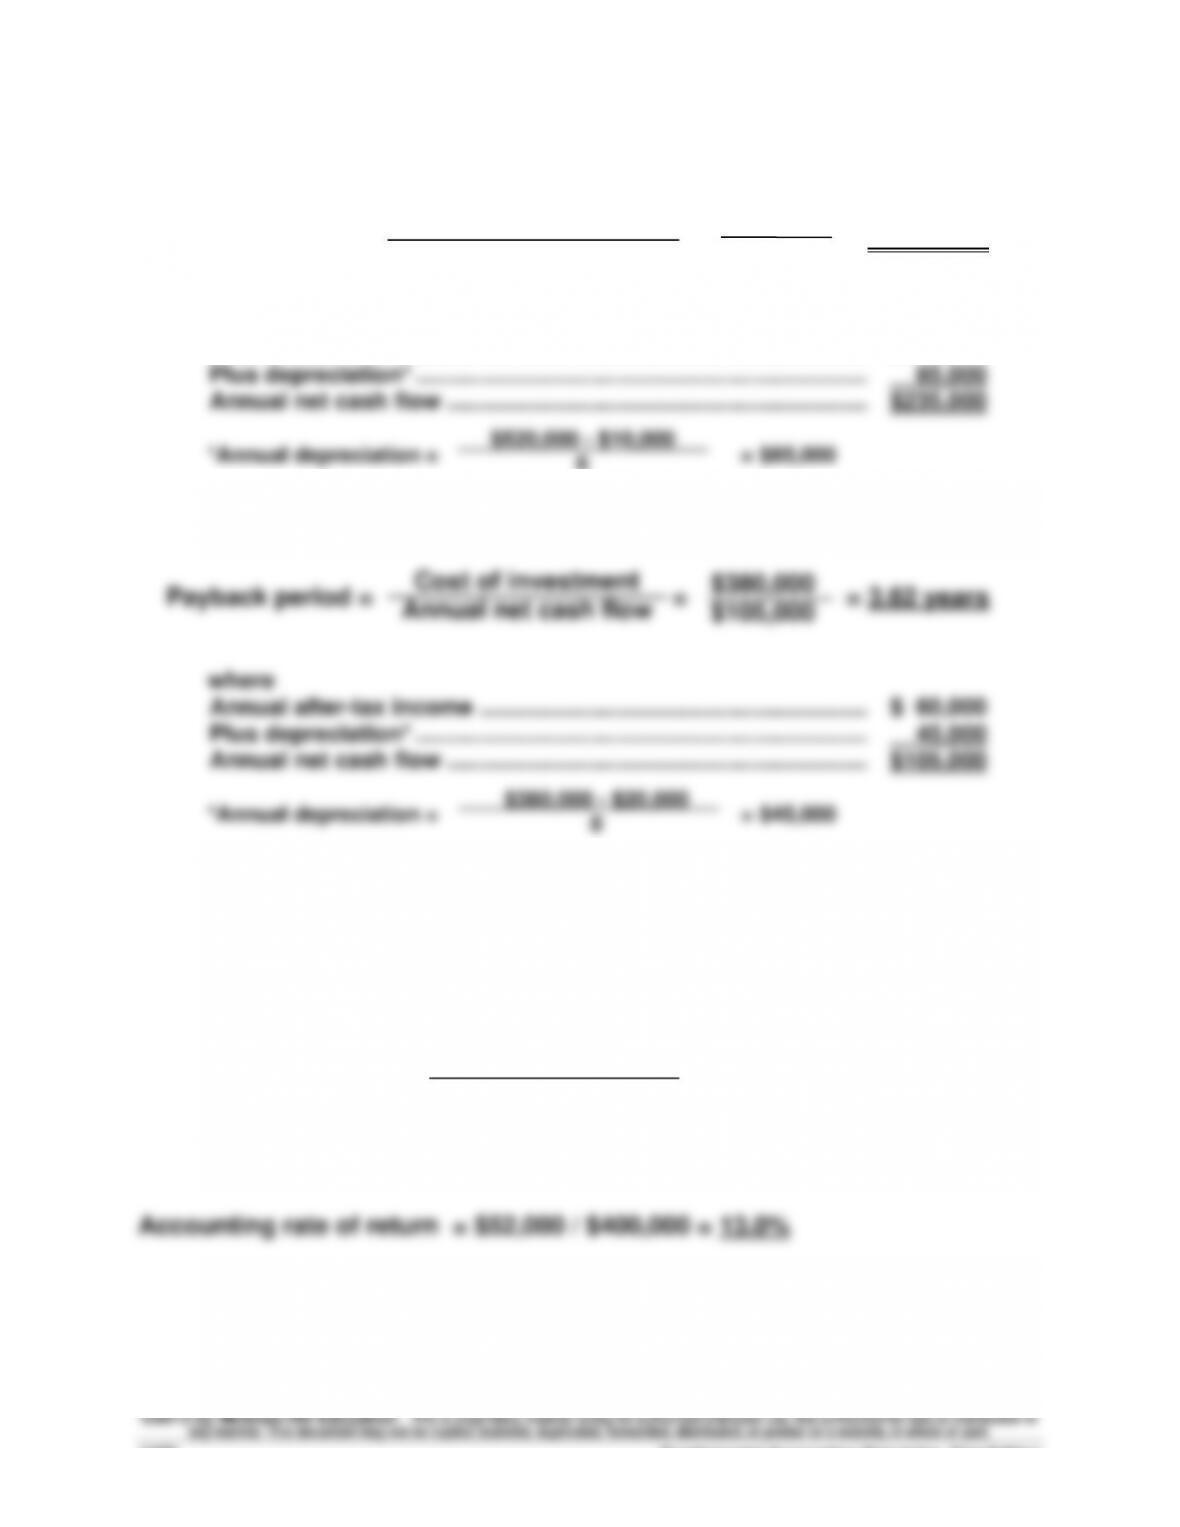
a.
Payback period = = = 2.21 years
where
Annual after-tax income ……………………………………………………….
$150,000
Plus depreciation* …………………………………………………………….…..
85,000
Annual net cash flow ………………………………………………………..…..
$235,000
*Annual depreciation = = $85,000
b.
Annual after-tax income ……………………………………………………….
$ 60,000
Plus depreciation* …………………………………………………………….…..
45,000
Annual net cash flow ………………………………………………………..…..
$105,000
*Annual depreciation = = $45,000
Exercise 25-4 (15 minutes)
Average investment = = $400,000
$700,000 + $100,000
2
Cost of investment
Annual net cash flow
$520,000
$235,000
$520,000 – $10,000
6
$380,000 – $20,000
8
Exercise 25-5 (20 minutes)
COMPUTING NET CASH FLOWS FROM NET INCOME
Net income
Cash flows
Sales ……………………………………………………………….…….
$225,000
$225,000
Materials, labor & overhead ……………………………..…….
120,000
120,000
Depreciation ……………………………………………………….
30,000
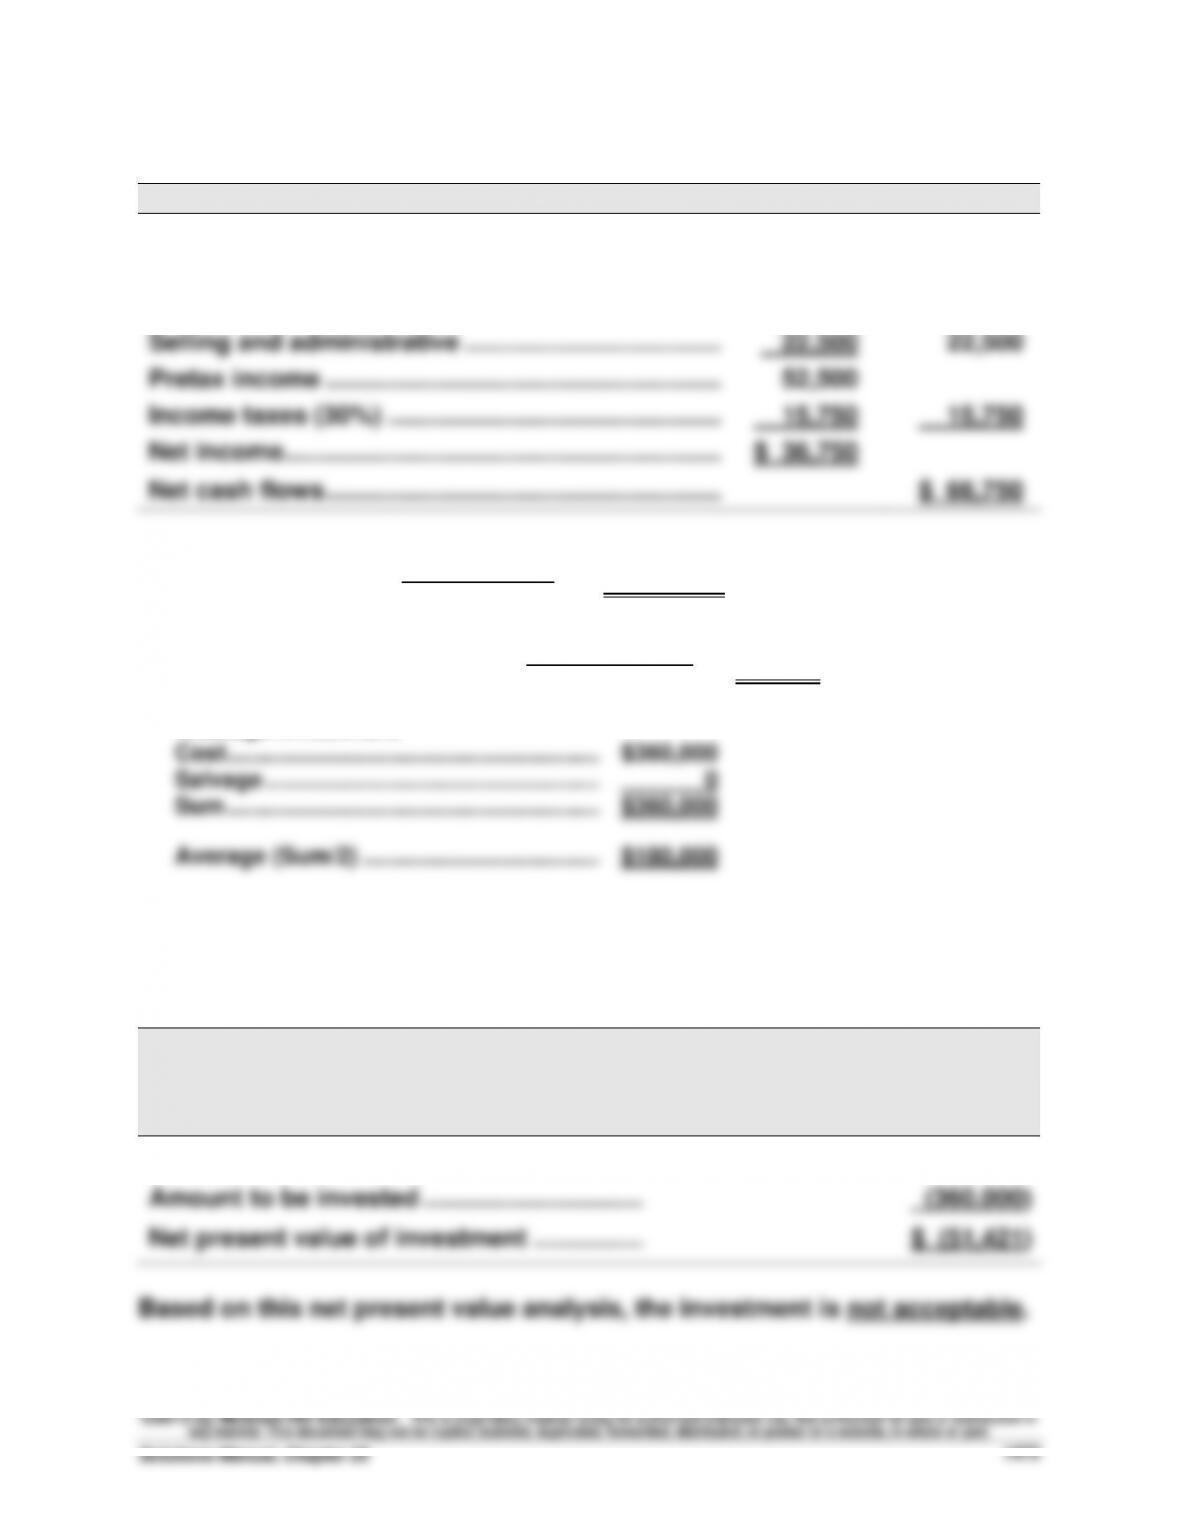
Selling and administrative ……………………………….…….
22,500
22,500
Pretax income ……………………………………………………….
52,500
Income taxes (30%) ……………………………………………….
15,750
15,750
Net income ……………………………………………………….
$ 36,750
Net cash flows ……………………………………………………….
$ 66,750
1. Payback period = = 5.39 years
2. Accounting rate of return = = 20.42%
*Average investment
Cost ………………………………………………….…
$360,000
Salvage …………………………………………….…
0
Sum ………………………………………………….…
$360,000
Average (Sum/2) ……………………………….…
$180,000
Exercise 25-6 (20 minutes)
Annual
Net Cash
Flows
Present
Value of
Annuity
at 8%
Present
Value of
Net Cash
Flows
Years 1 through 6…………………………………..……..
$ 66,750
4.6229
$ 308,579
Amount to be invested …………………………..
(360,000)
Net present value of investment …………….……..
$ (51,421)
Based on this net present value analysis, the investment is not acceptable.
$360,000
$66,750
$36,750
$180,000*
Exercise 25-7 (35 minutes)
1.
PROJECT C1
Net Cash
Flows
Present
Value of
1 at 12%
Present
Value of
Net Cash
Flows
Year 1 ……………………………………………………….
$ 12,000
0.8929
$ 10,715
Year 2 ……………………………………………………….
108,000
0.7972
86,098
Year 3 ……………………………………………………….
168,000
0.7118
119,582
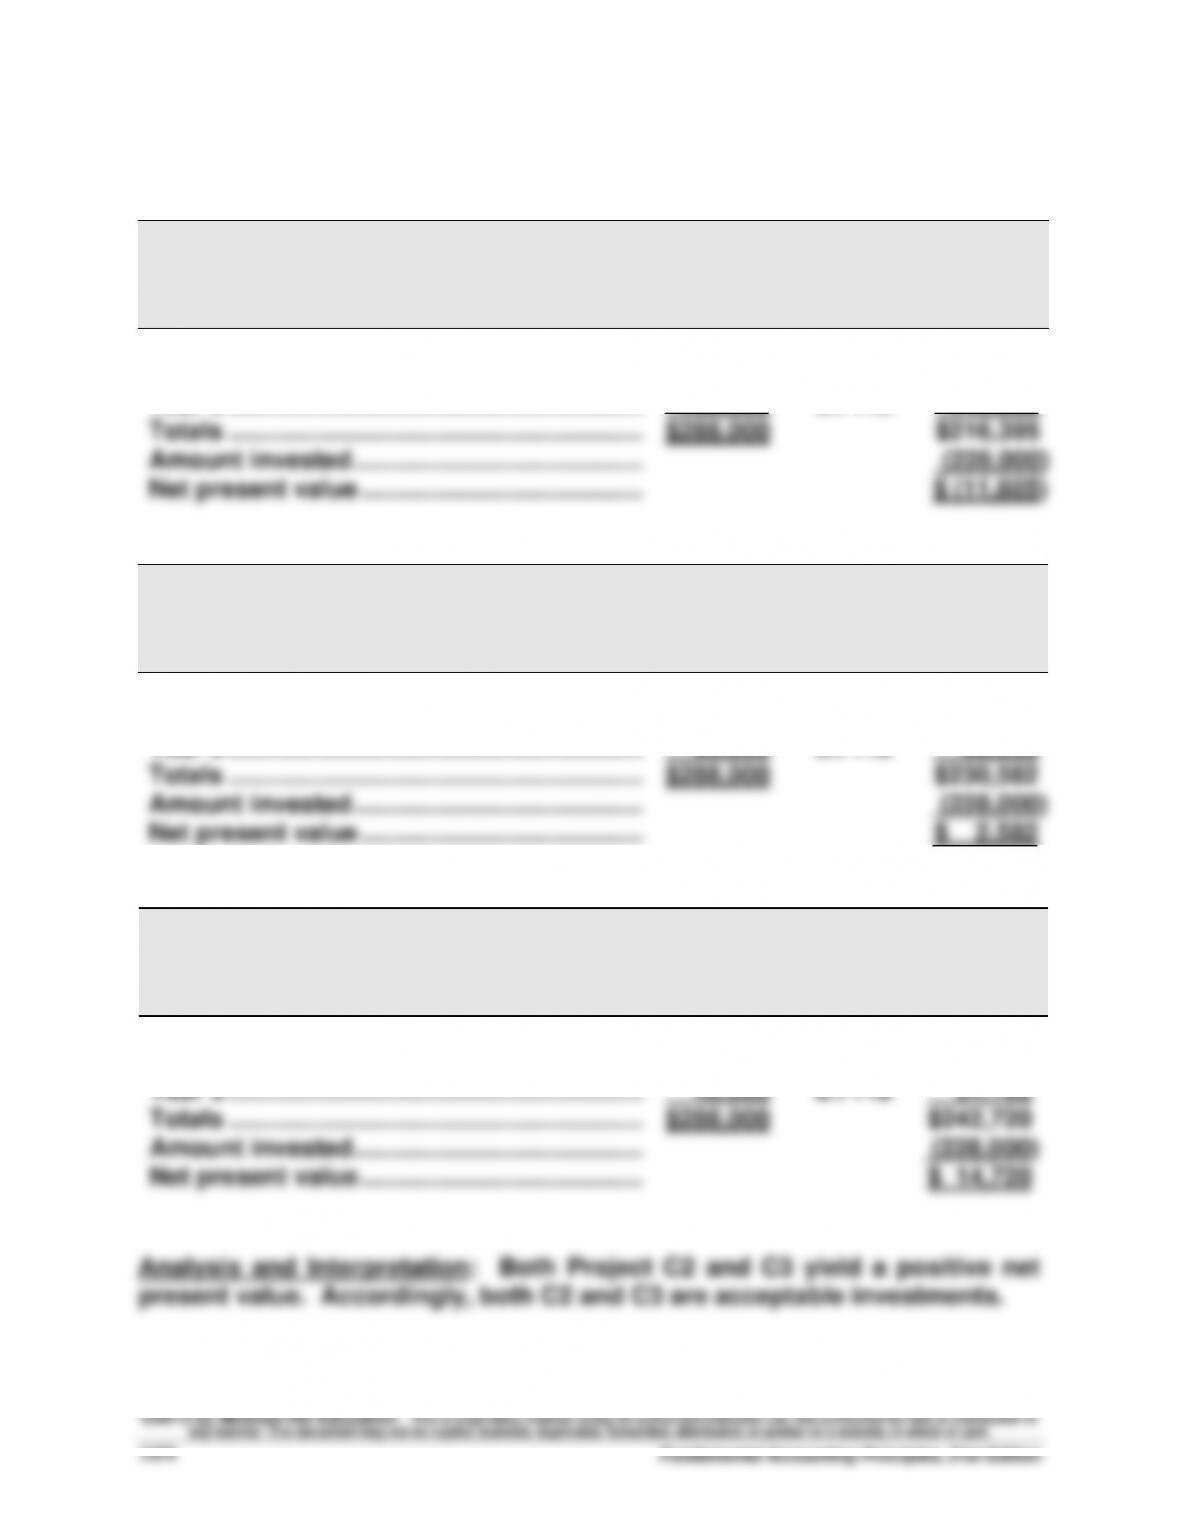
Totals ……………………………………………………….
$288,000
$216,395
Amount invested …………………………………………..
(228,000)
Net present value …………………………………..……..
$ (11,605)
PROJECT C2
Net Cash
Flows
Present
Value of
1 at 12%
Present
Value of
Net Cash
Flows
Year 1 ……………………………………………………….
$ 96,000
0.8929
$ 85,718
Year 2 ……………………………………………………….
96,000
0.7972
76,531
Year 3 ……………………………………………………….
96,000
0.7118
68,333
Totals ……………………………………………………….
$288,000
$230,582
Amount invested …………………………………………..
(228,000)
Net present value …………………………………..……..
$ 2,582
PROJECT C3
Net Cash
Flows
Present
Value of
1 at 12%
Present
Value of
Net Cash
Flows
Year 1 ……………………………………………………….
$180,000
0.8929
$160,722
Year 2 ……………………………………………………….
60,000
0.7972
47,832
Year 3 ……………………………………………………….
48,000
0.7118
34,166
Totals ……………………………………………………….
$288,000
$242,720
Amount invested …………………………………………..
(228,000)
Net present value …………………………………..……..
$ 14,720
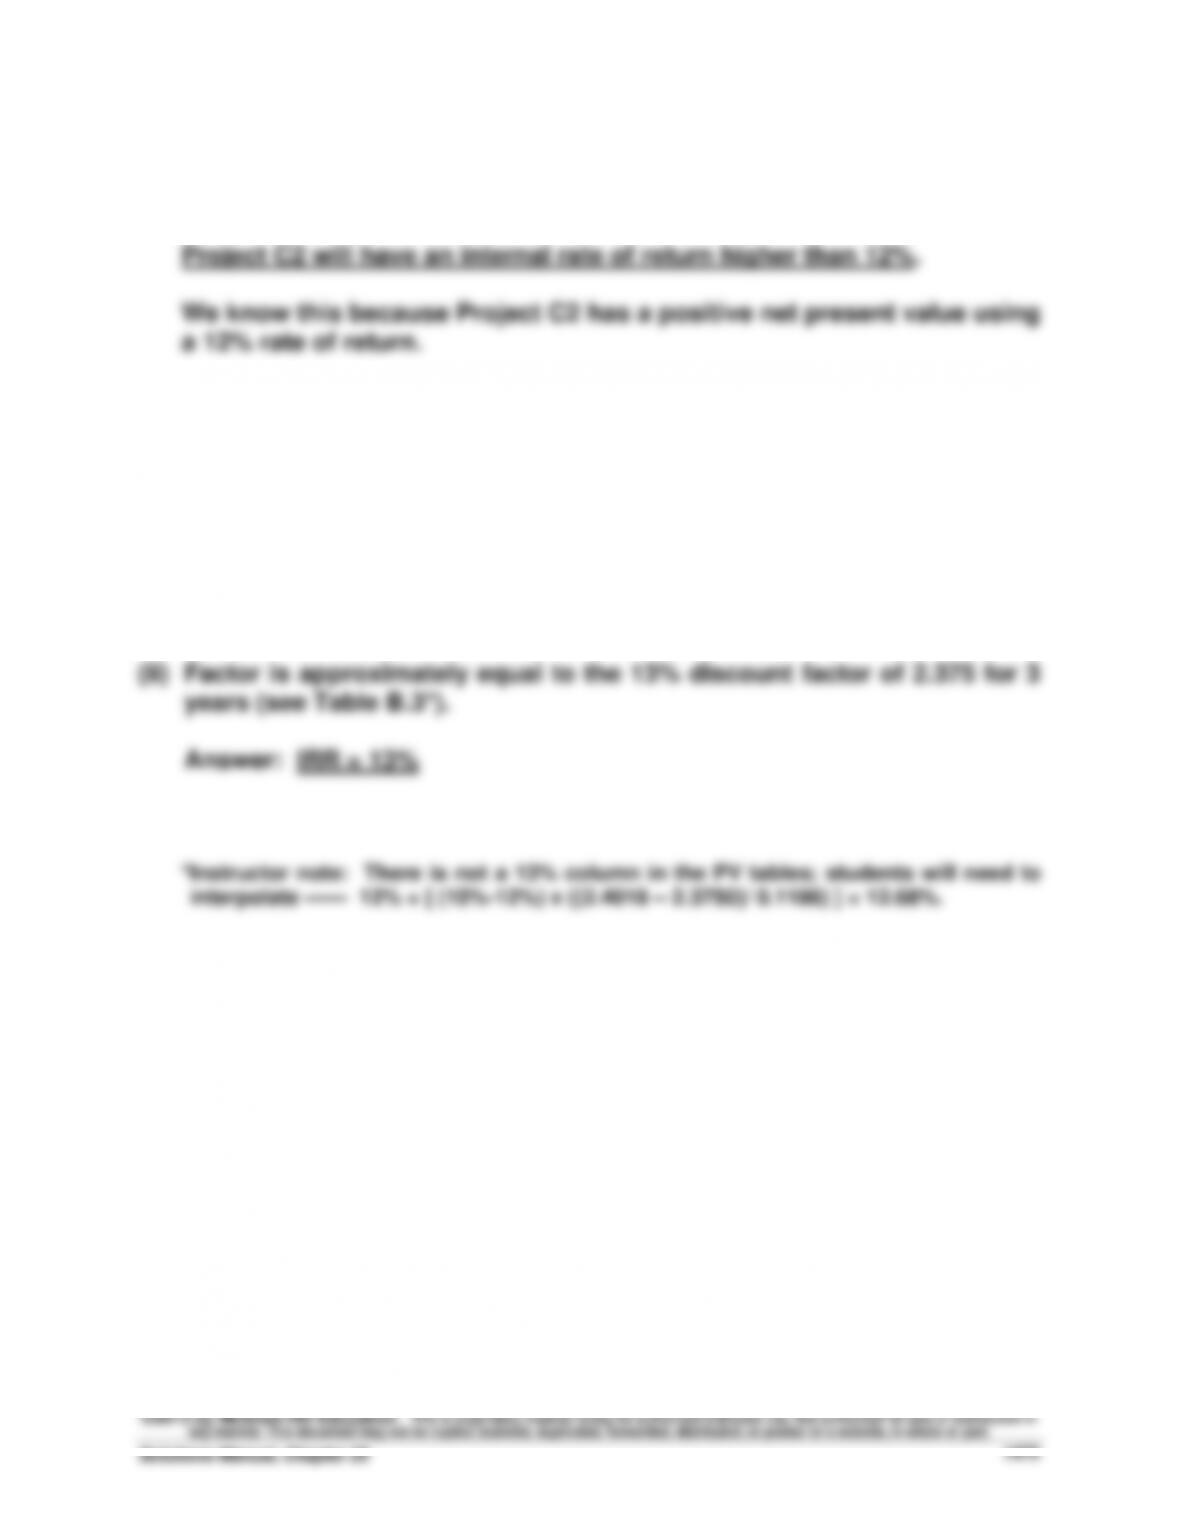
Exercise 25-7 (Continued)
2. INTERNAL RATE OF RETURN VS. NET PRESENT VALUE FOR C2
3. INTERNAL RATE OF RETURN FOR PROJECT C2
(i) Present value factor = Amount invested / Net cash flows
= $228,000 / $96,000 = 2.375
Fundamental Accounting Principles, 21st Edition
1476
Exercise 25-8 (20 minutes)
PROJECT A
Net Cash
Flows
Present
Value of
1 at 10%
Present
Value of
Net Cash
Flows
Year 1 ……………………………………………………….
$ 40,000
0.9091
$ 36,364
Year 2 ……………………………………………………….
56,000
0.8264
46,278
Year 3 ……………………………………………………….
80,295
0.7513
60,326
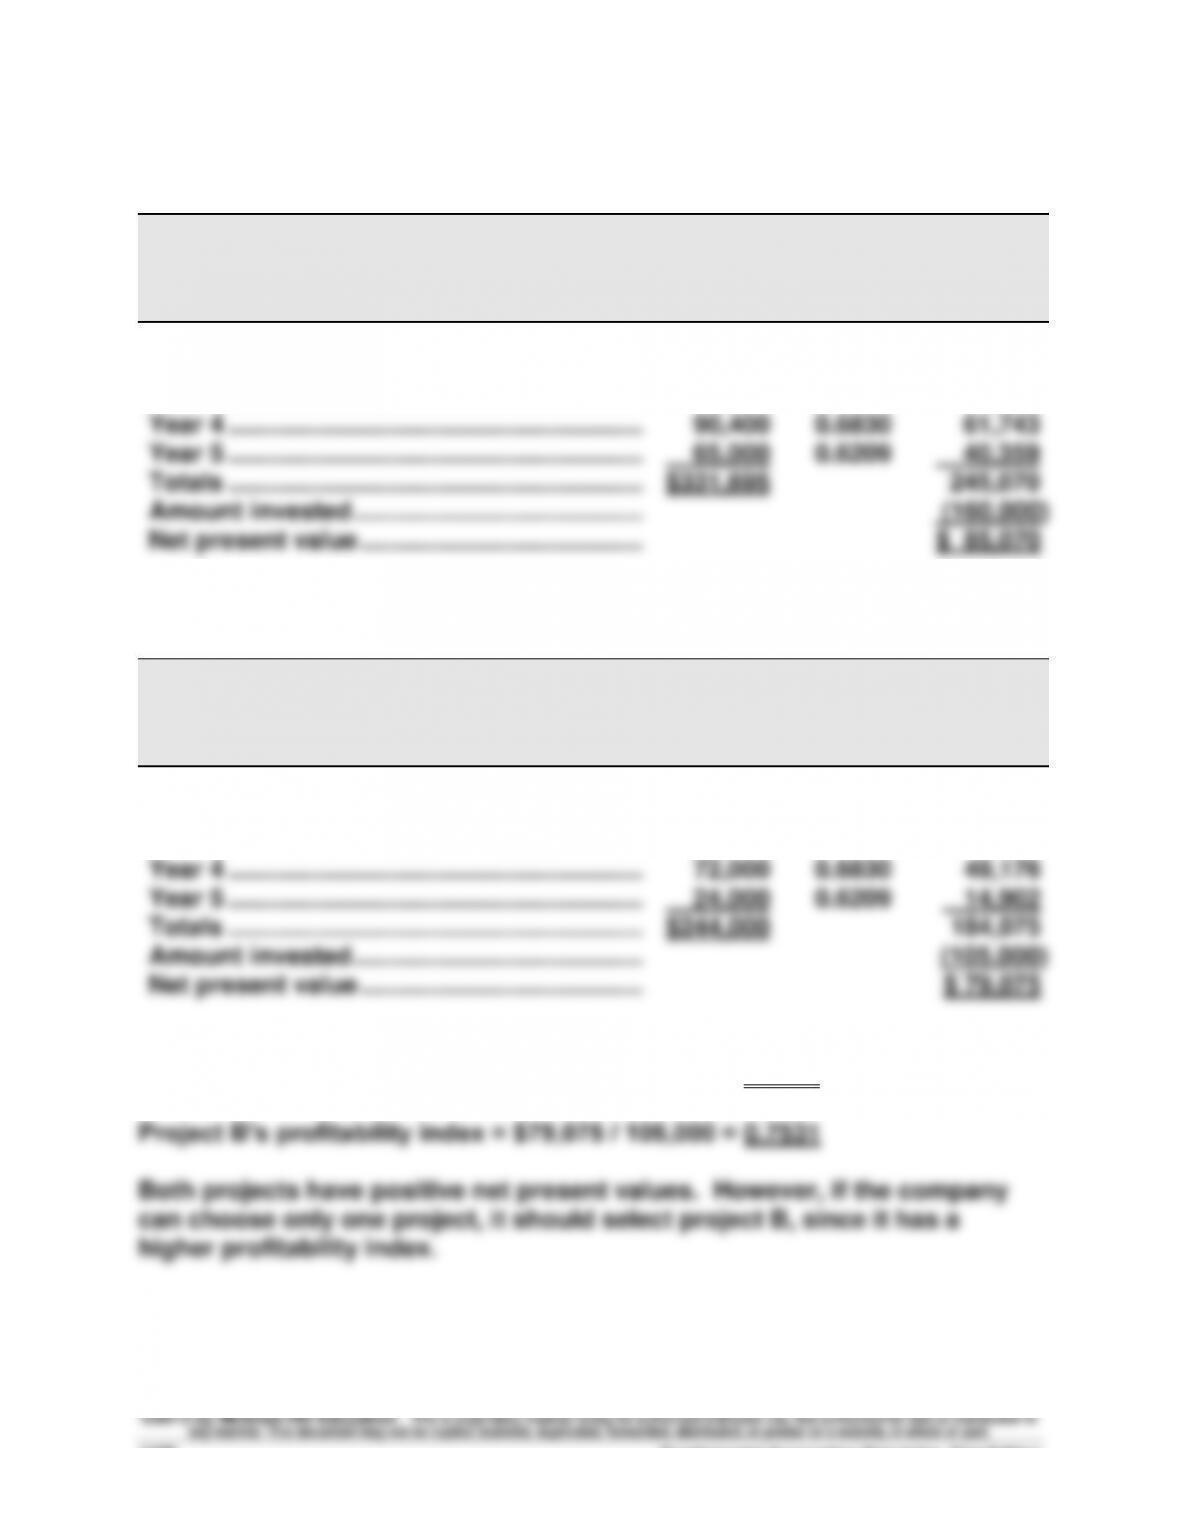
Year 4 ……………………………………………………….
90,400
0.6830
61,743
Year 5 ……………………………………………………….
65,000
0.6209
40,359
Totals ……………………………………………………….
$331,695
245,070
Amount invested …………………………………………..
(160,000)
Net present value …………………………………..……..
$ 85,070
PROJECT B
Net Cash
Flows
Present
Value of
1 at 10%
Present
Value of
Net Cash
Flows
Year 1 ……………………………………………………….
$ 32,000
0.9091
$ 29,091
Year 2 ……………………………………………………….
50,000
0.8264
41,320
Year 3 ……………………………………………………….
66,000
0.7513
49,586
Year 4 ……………………………………………………….
72,000
0.6830
49,176
Year 5 ……………………………………………………….
24,000
0.6209
14,902
Totals ……………………………………………………….
$244,000
184,075
Amount invested …………………………………………..
(105,000)
Net present value …………………………………..……..
$ 79,075
Project A’s profitability index = $85,070 / 160,000 = 0.5317
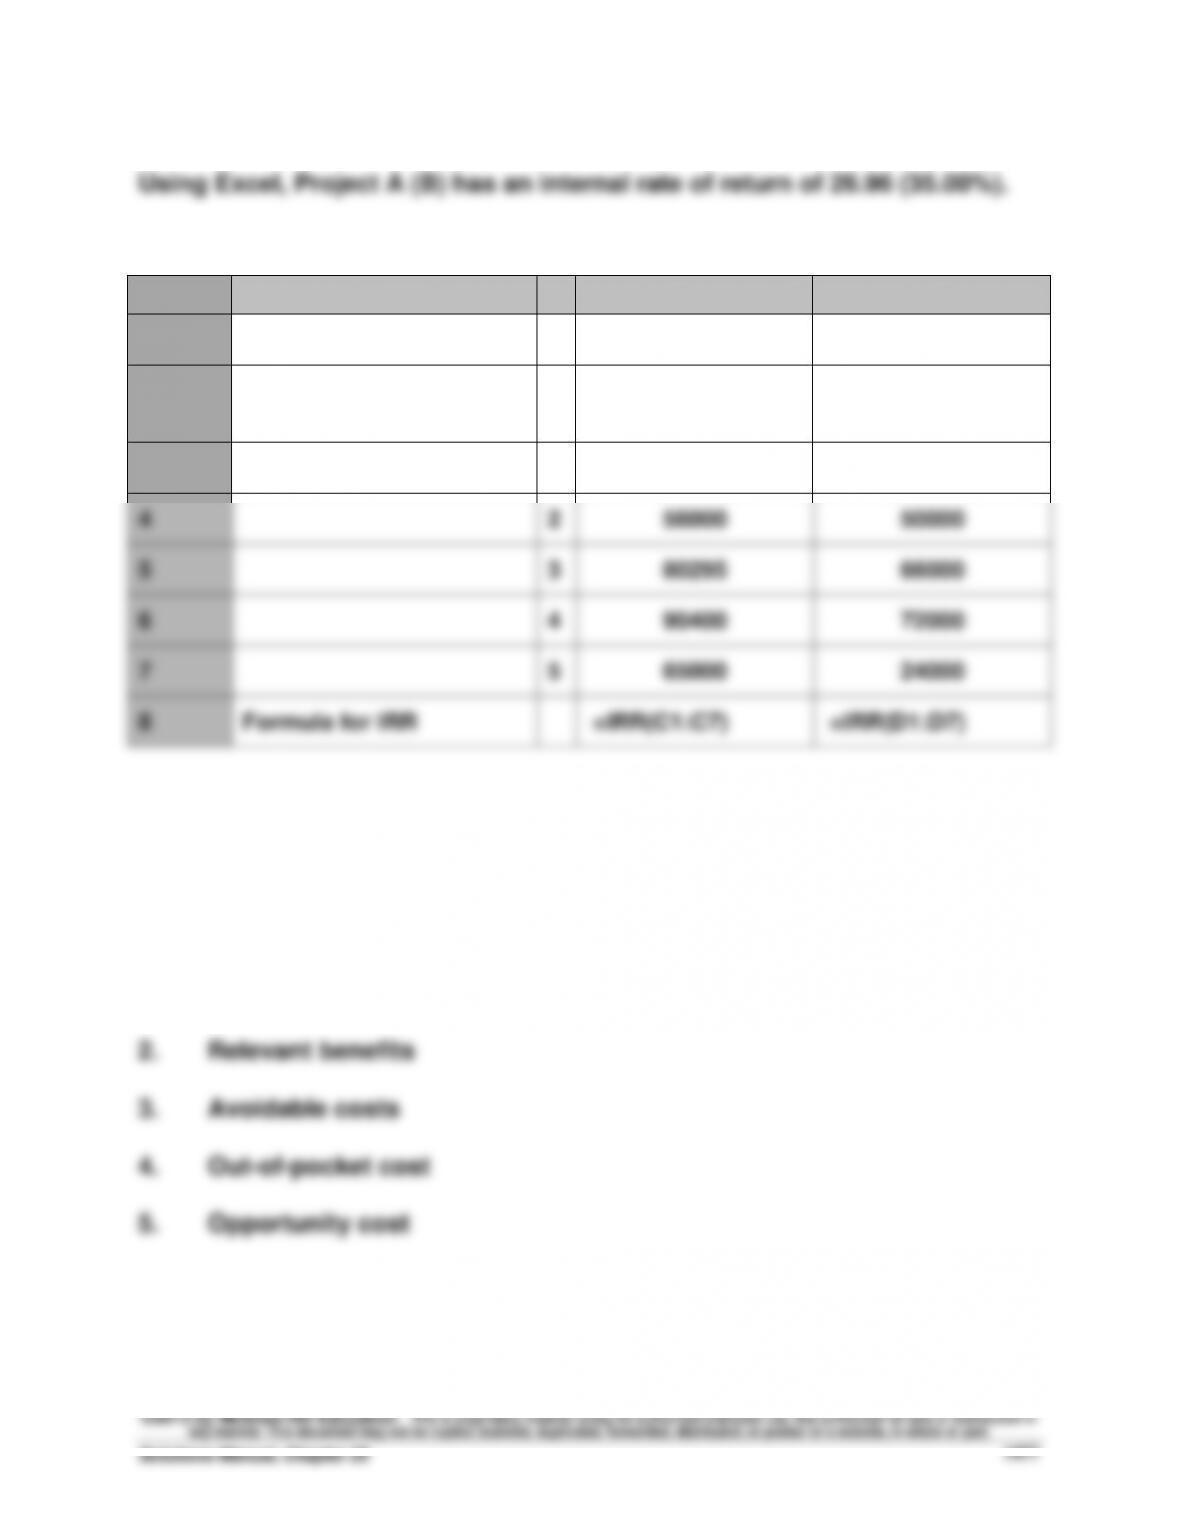
Exercise 25-9A (20 minutes)
Project A Project B
A
B
C
D
1
Initial investment
-160000
-105000
2
Annual cash flows,
end of period
3
1
40000
32000
4
2
56000
50000
5
3
80295
66000
6
4
90400
72000
7
5
65000
24000
8
Formula for IRR
=IRR(C1:C7)
=IRR(D1:D7)
Exercise 25-10 (10 minutes)
1. Sunk cost