Title: Exercise 24-13
QA_Ori:
Preliminary calculations
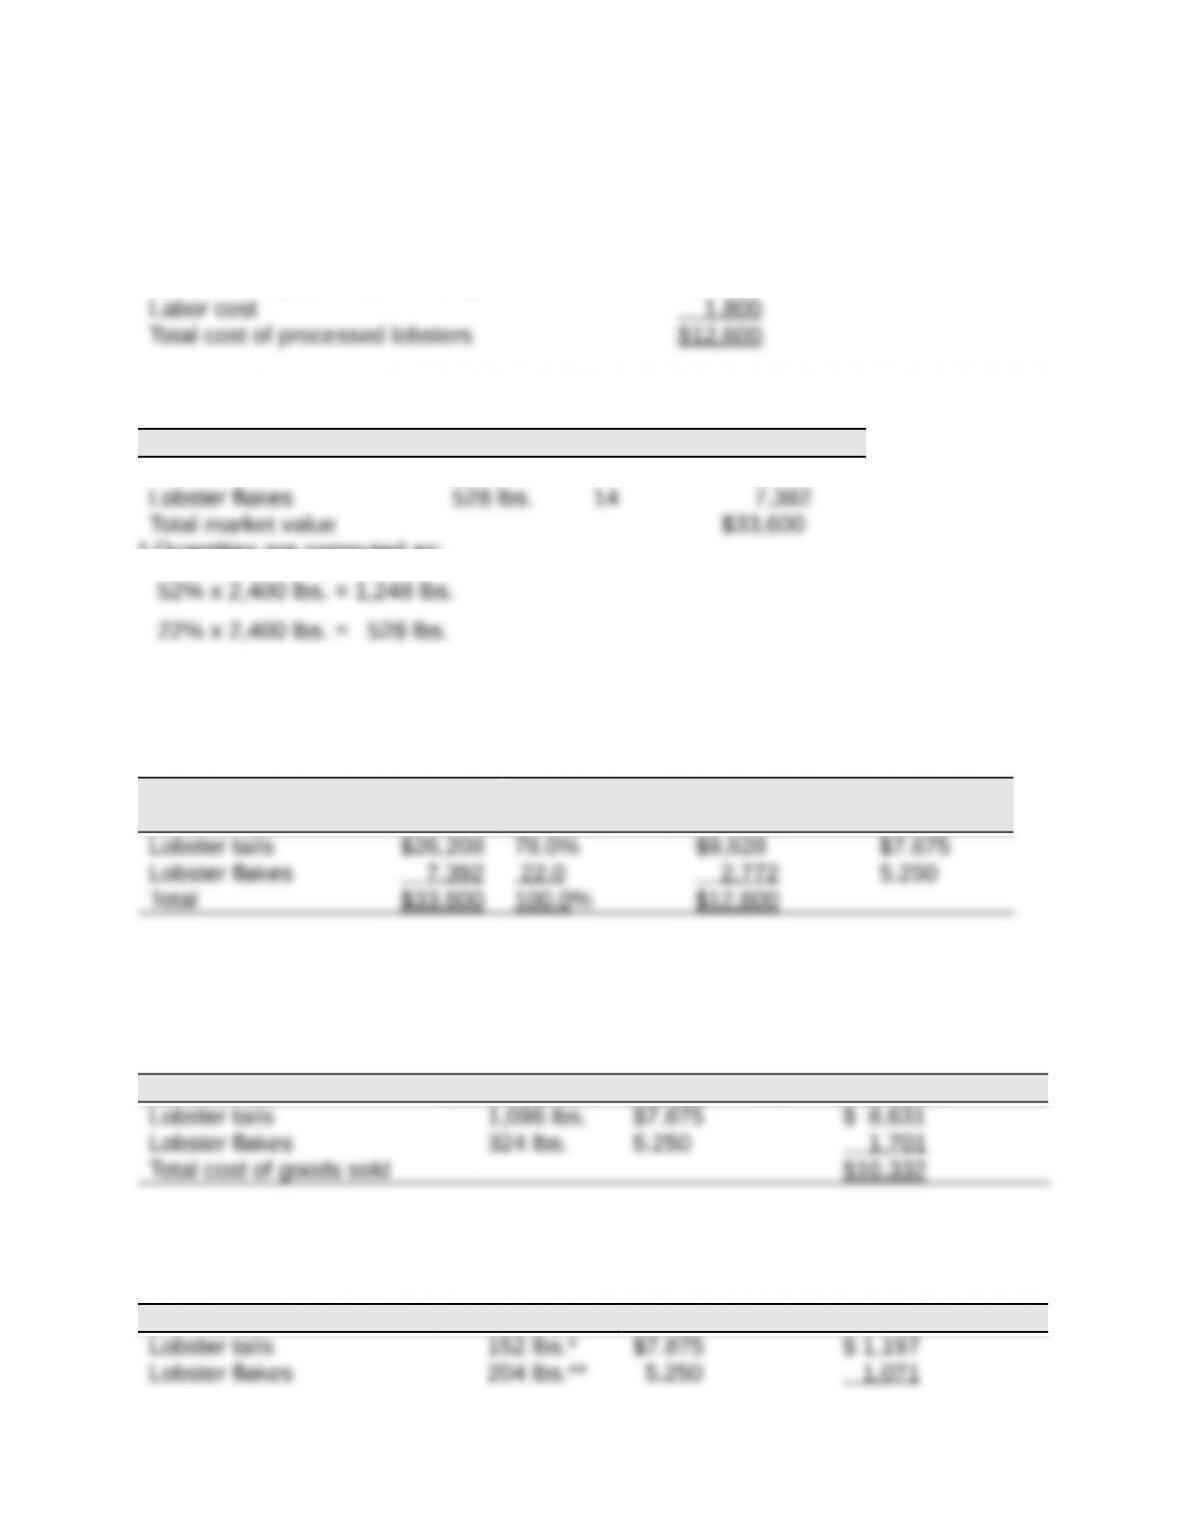
Lobster cost (2,400 lbs. x $4.50) $10,800
Parts Quantity* Price Total
Lobster tails 1,248 lbs. $21 $26,208
* Quantities are computed as:
Allocated cost—value basis allocation: $12,600
Market % of Allocated Cost
Parts Value Total Cost per lb.
(1) Cost of goods sold
Parts Quantity (given) Cost Total
(2) Cost of ending inventory
Parts Quantity Cost Total

Total inventory cost $ 2,268
Note: Cost of goods sold ($10,332) plus cost of ending inventory ($2,268) equals the
total cost of $12,600.
QA_Edit:
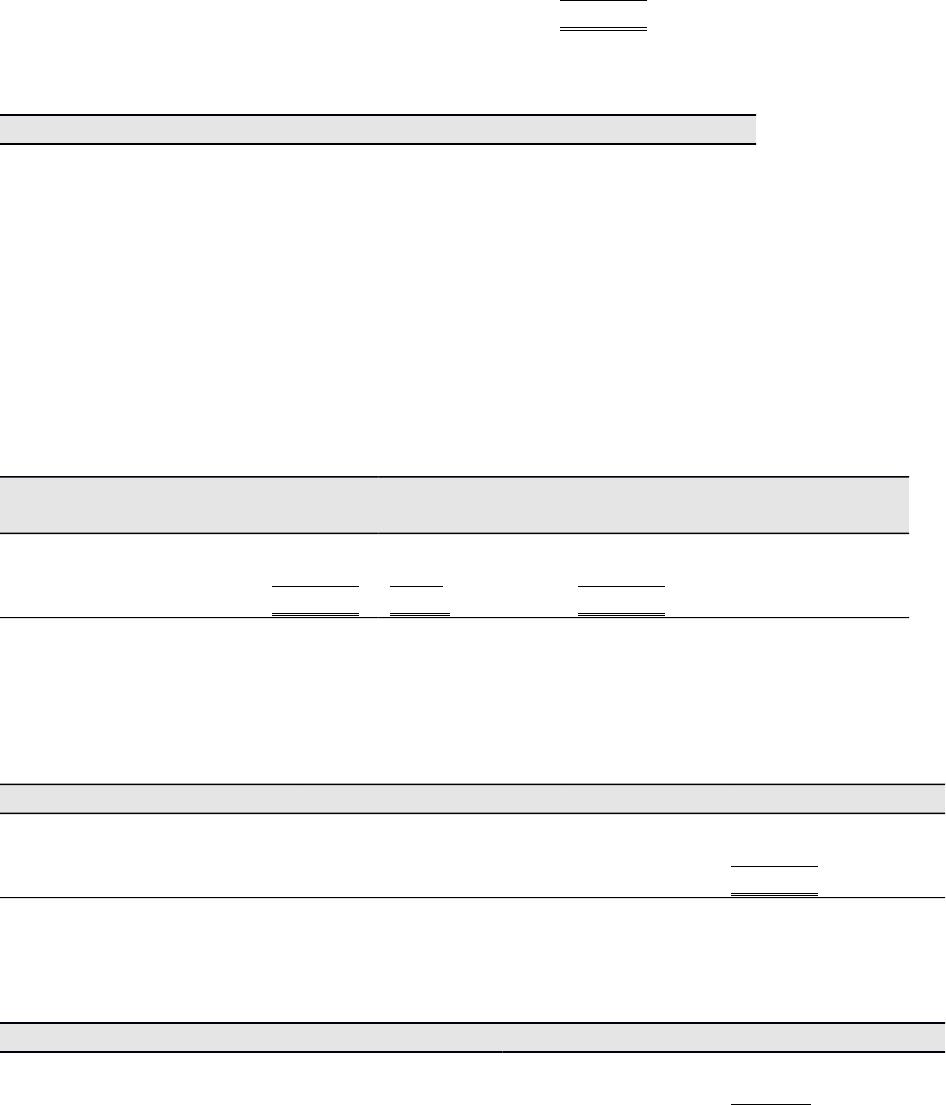
Title: Exercise 24-14
QA_Ori:
(1) Profit margin = Income/Sales
Investment Center Income* Sales* Profit margin
Professional products € 552 €2,717 20.32%
*In € millions
The Professional products department has the highest profit margin.
(2) Investment turnover = Sales/Average invested assets
Investment Center
Sales*
Avg. assets*
Investment
turnover
Professional products €2,717 €2,570 1.06
*In € millions. Avg. assets = Beginning assets plus ending assets, divided by two.
Note: Profit margin and investment turnover amounts are rounded to two decimal
Title: Problem 24-1A
QA_Ori:
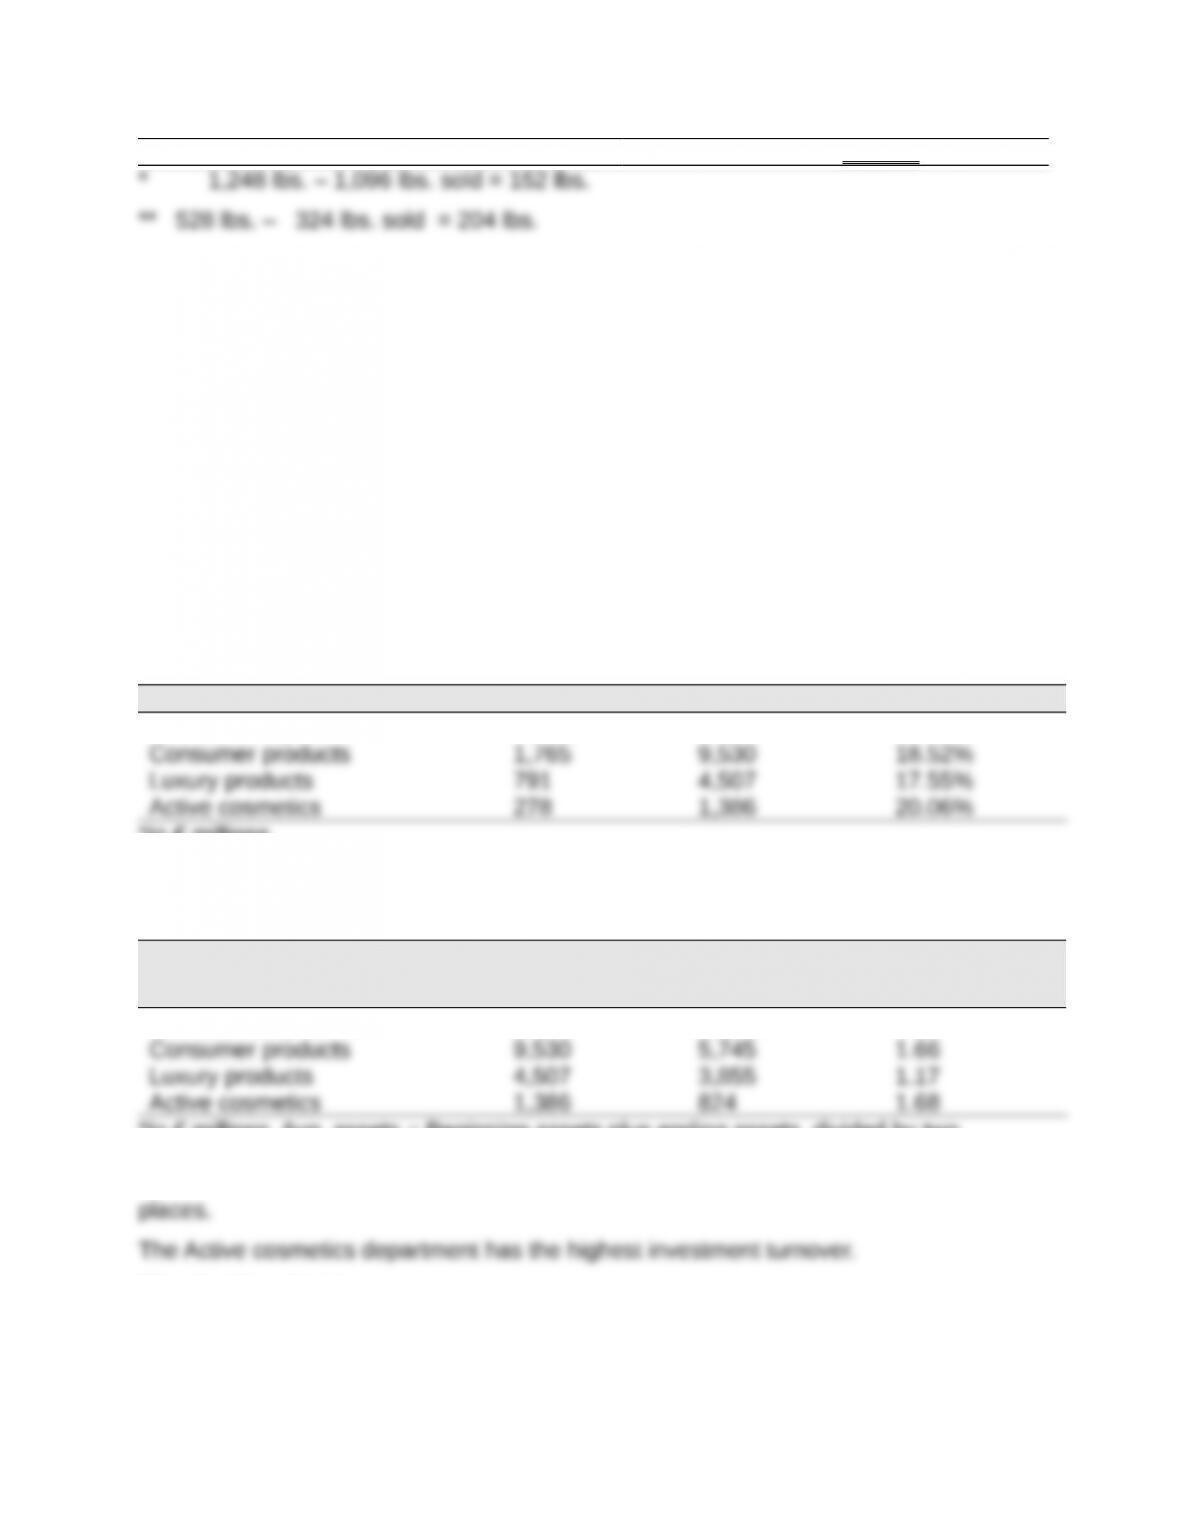
Part 1
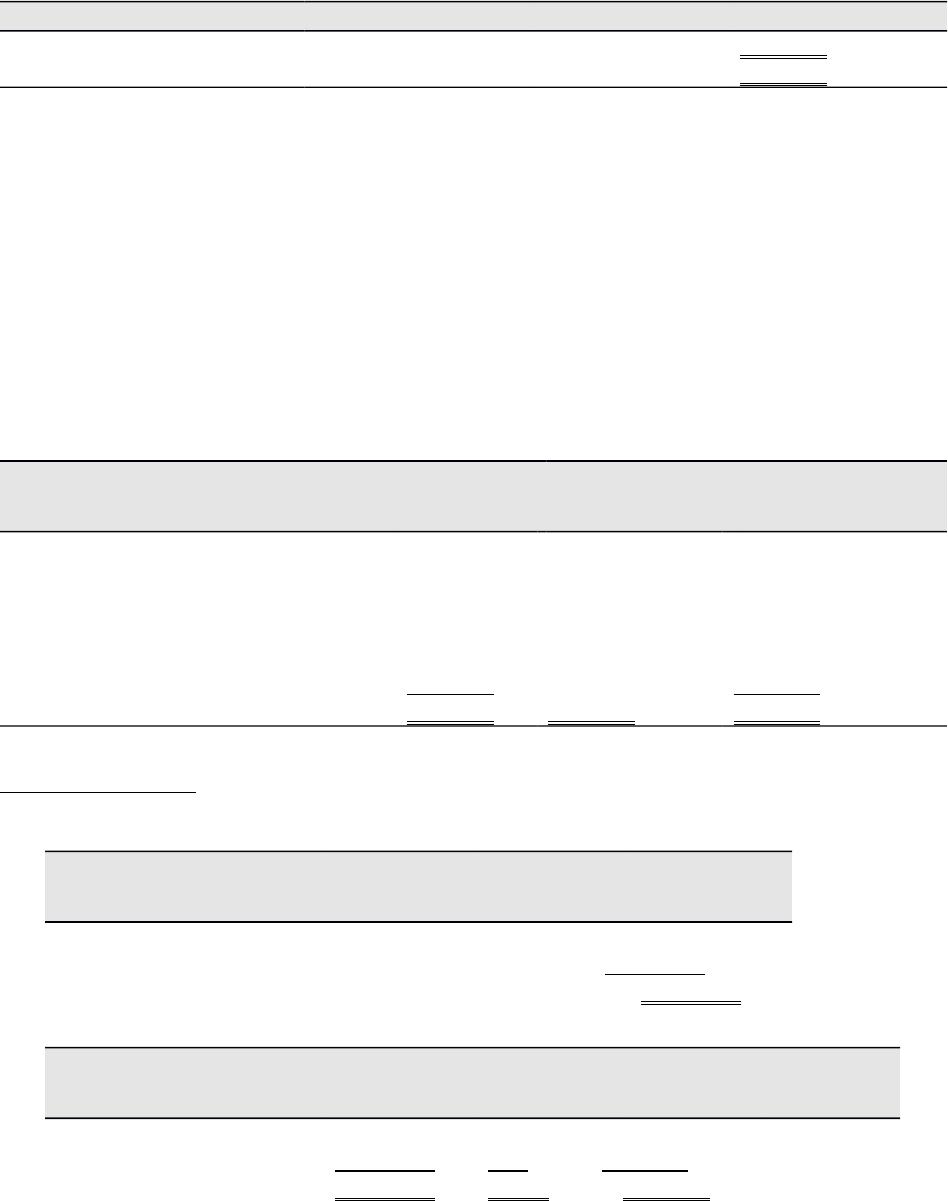
These costs are assigned to the two departments as follows
Department Square Footage Rate Total
*A total of $23,100 ($8,250 + $14,850) in occupancy costs is allocated to these
Part 2
Market rates are used to allocate occupancy costs for depreciation, interest, and taxes.
Heating, lighting, and maintenance costs are allocated to the departments on both floors
at the average rate per square foot. These costs are separately assigned to each class
as follows:
Total
Costs
Value-Based
Costs
Usage-Based
Costs
Depreciation—Building $18,000 $18,000
Interest—Building mortgage 27,000 27,000
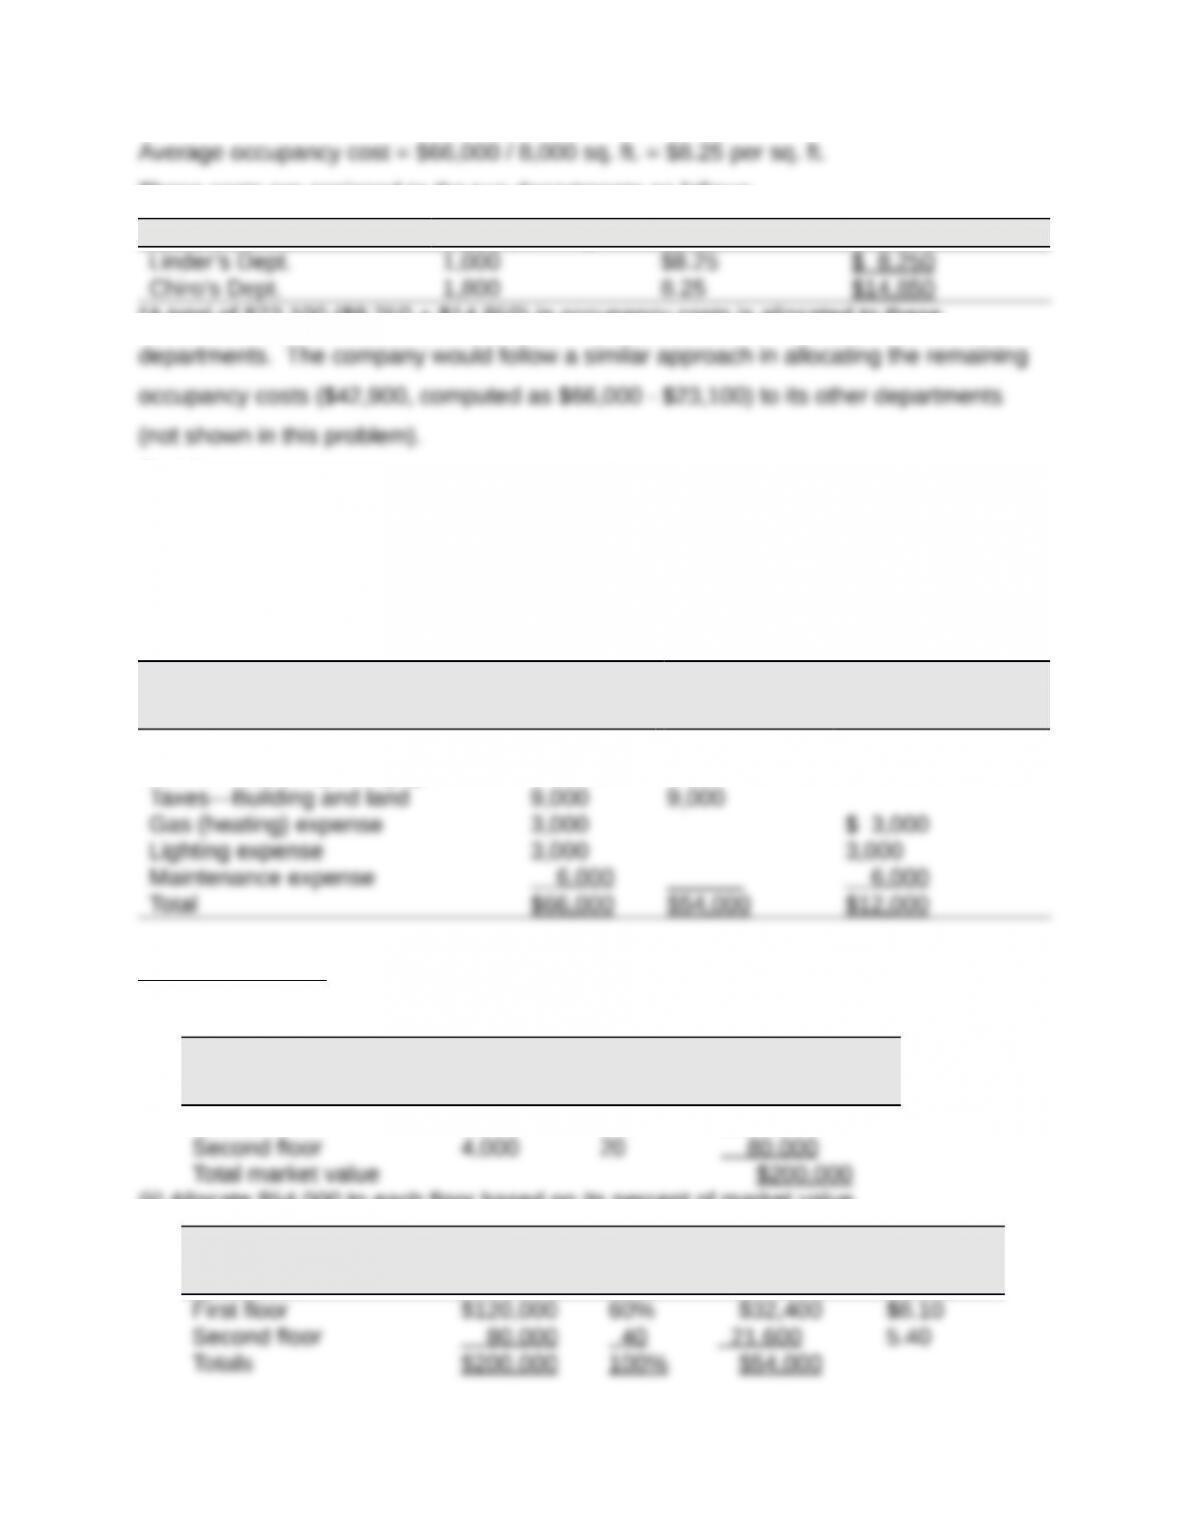
Value-based costs are allocated to departments in two steps
(i) Compute market value of each floor
Floor
Square
Footage
Value per
Sq. Ft. Total
First floor 4,000 $30 $120,000
(ii) Allocate $54,000 to each floor based on its percent of market value
Floor
Market
Value
% of
Total
Allocated
Cost
Cost per
Sq. Ft.
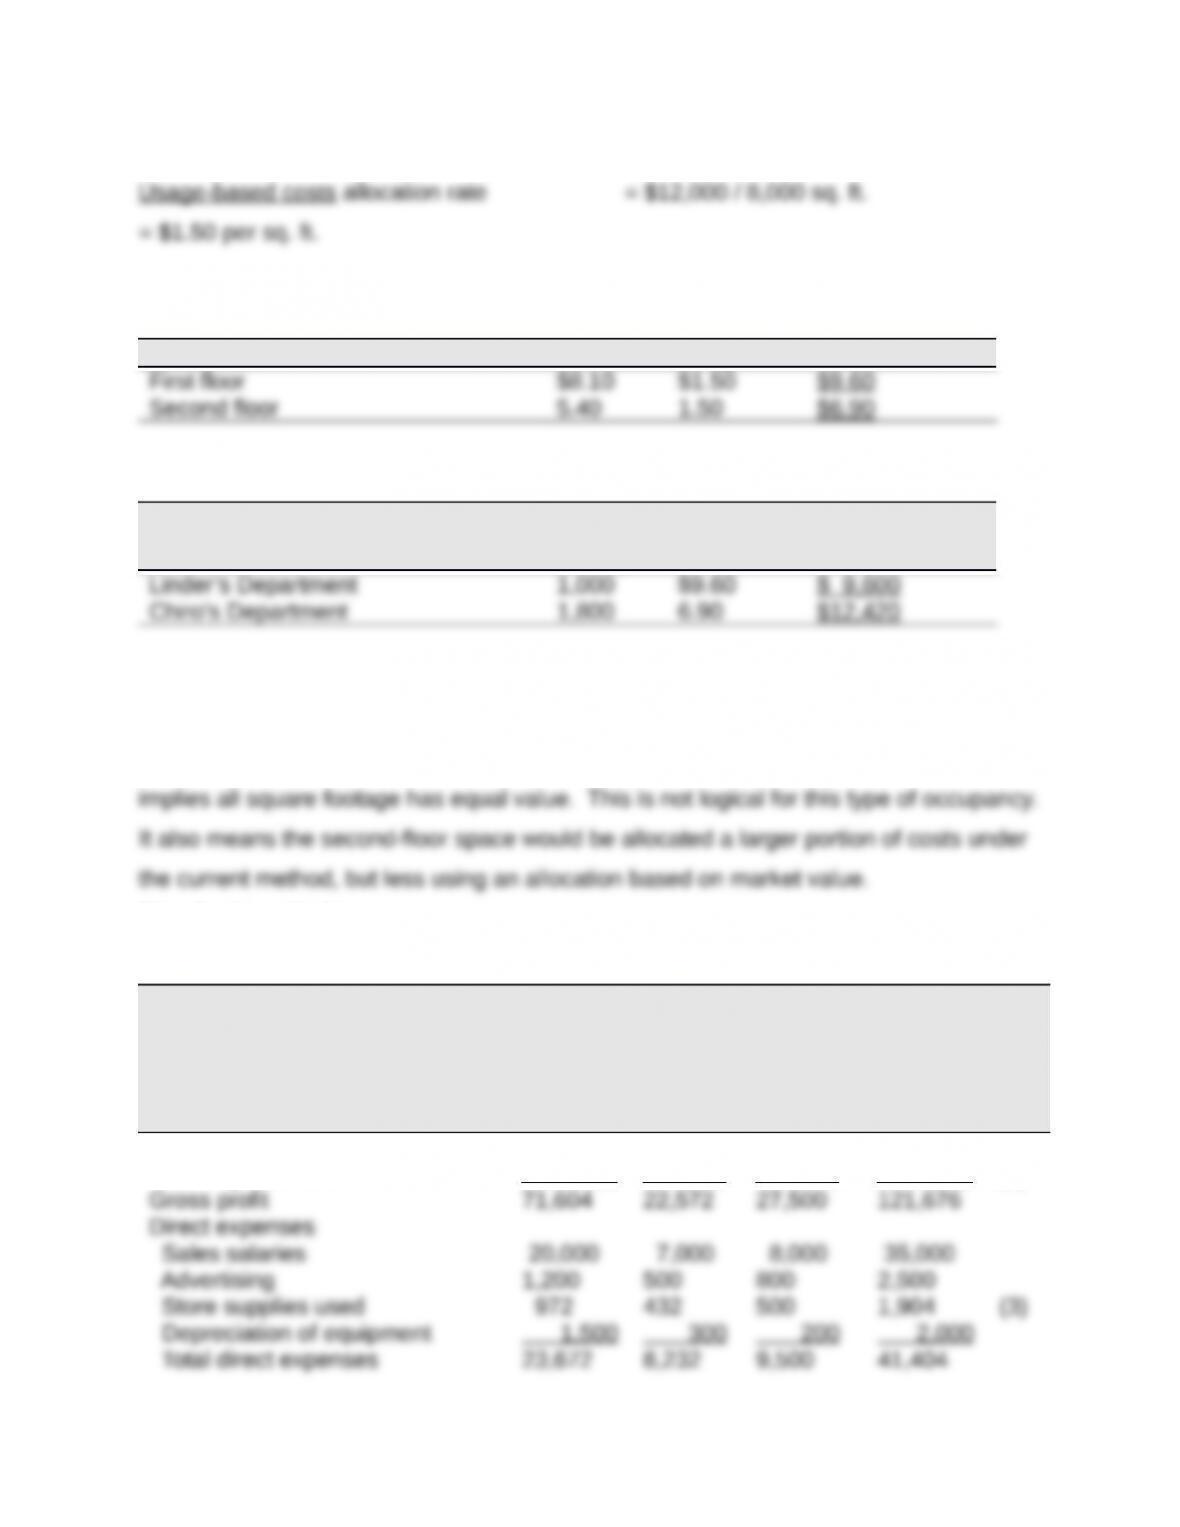
We can then compute total allocation rates for the floors
Floor Value Usage Total
These rates are applied to allocate occupancy costs to departments
Department
Square
Footage Rate Total
Part 3
A second-floor manager would prefer allocation based on market value. This is a
reasonable and logical approach to allocation of occupancy costs. The current method
Title: Problem 24-2A
QA_Ori:
Williams Company
Forecasted Departmental Income Statements
For Year Ended December 31, 2014
Clock Mirror Paintings Combine
d
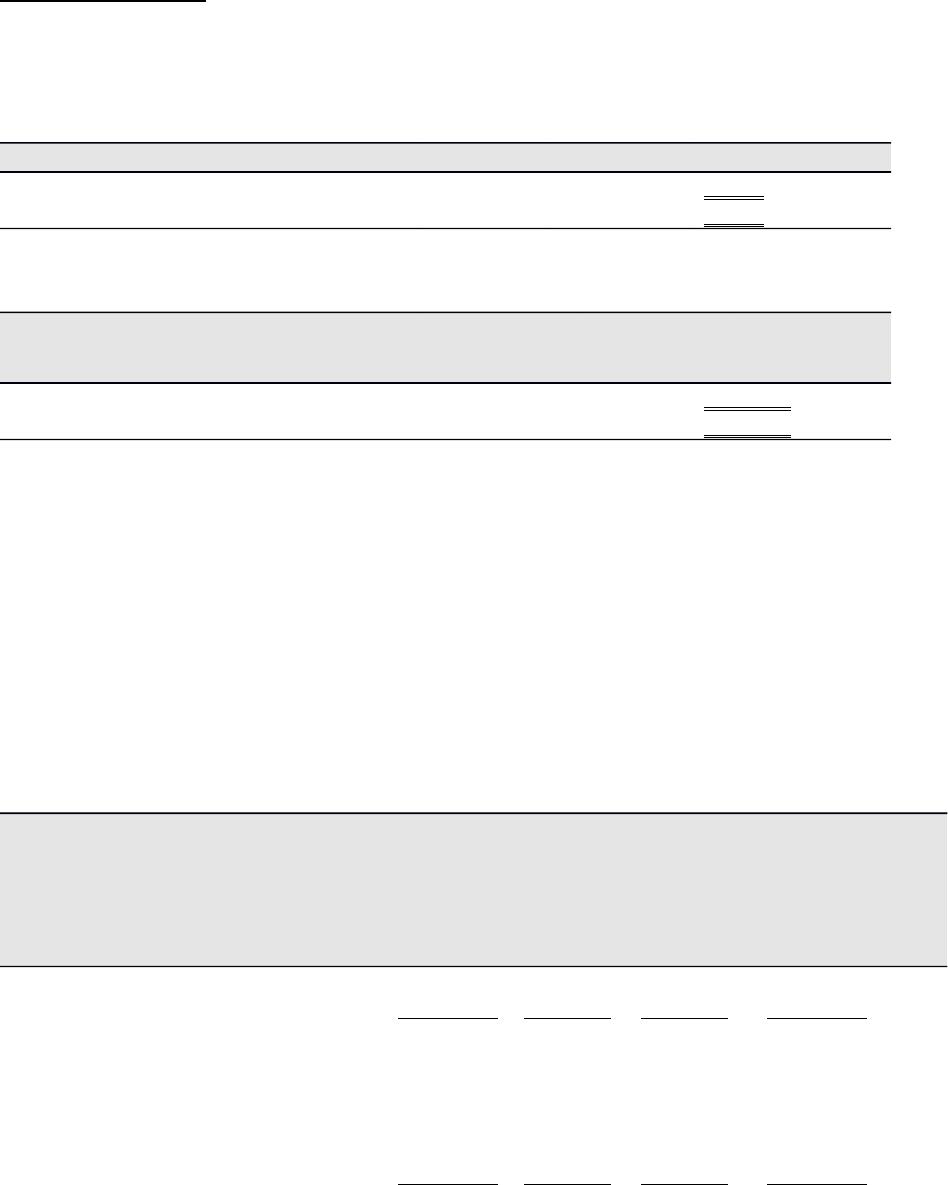
Sales $140,400 $59,400 $50,000 $249,800 (1)
Cost of goods sold 68,796 36,828 22,500 128,124 (2)
Allocated expenses
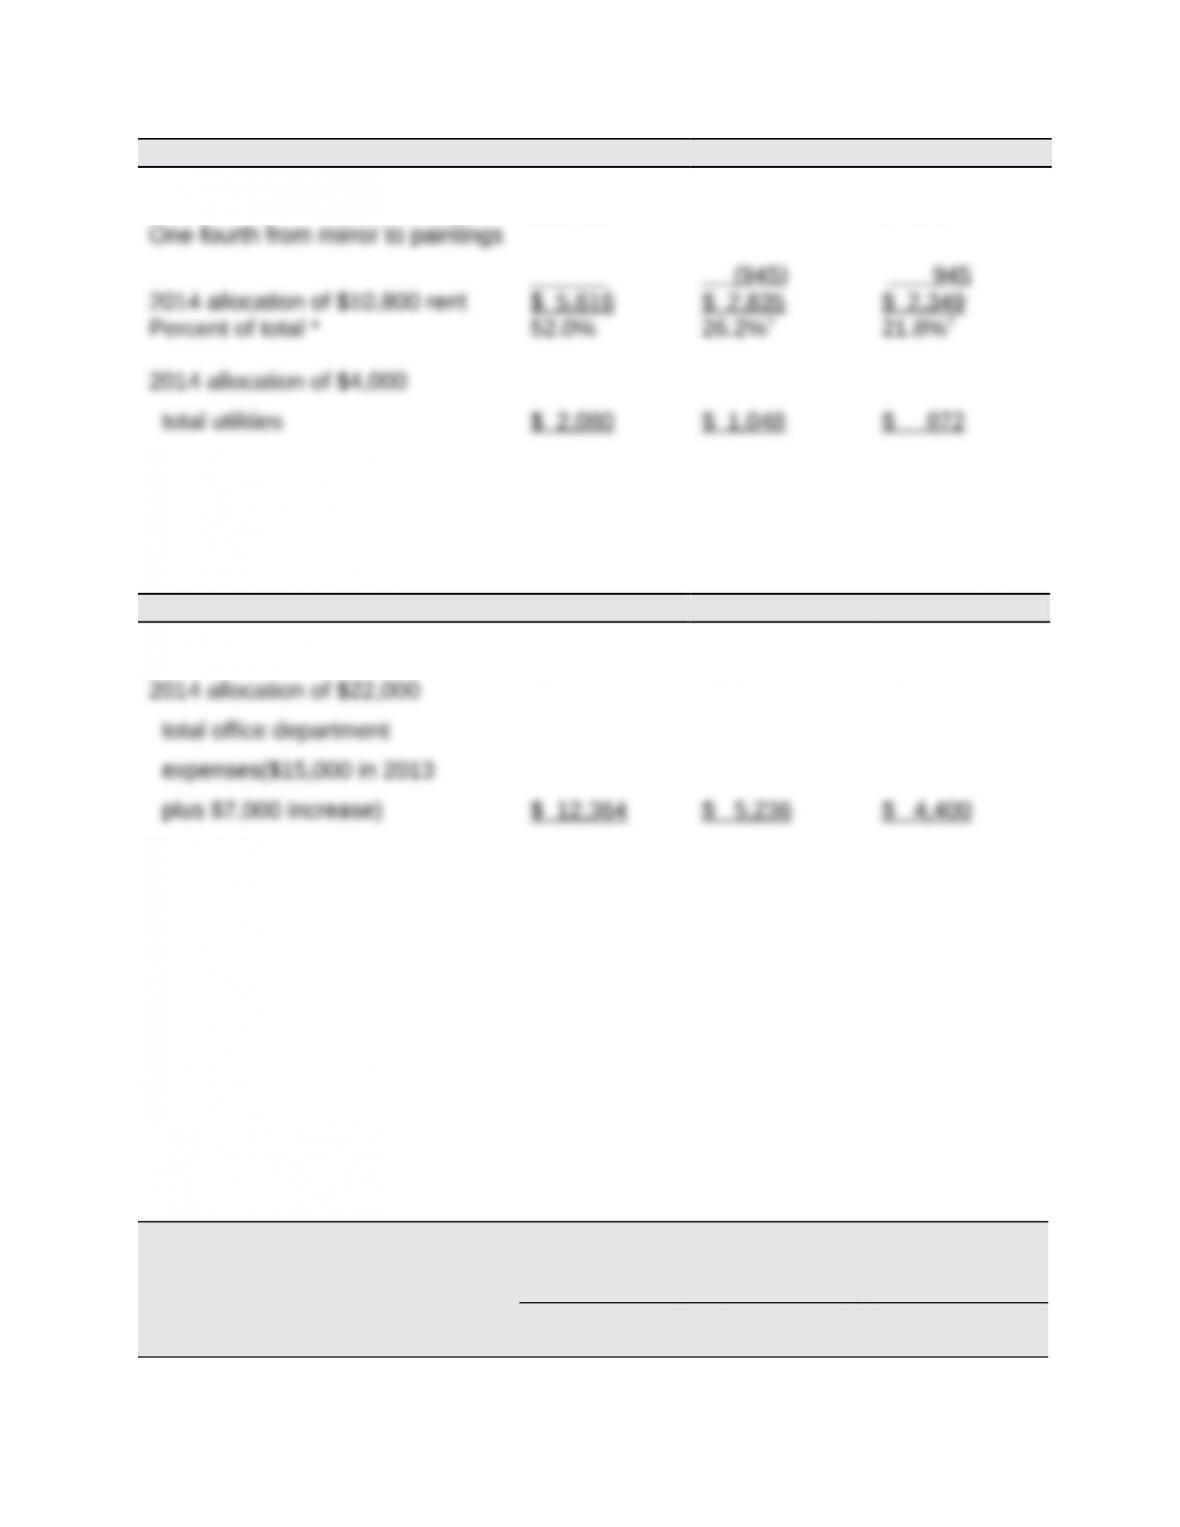
Rent expense 5,616 2,835 2,349 10,800 (4)
Supporting Computations—coded (1) through (5) in statement above
Note 1 (Sales)
Clock Mirror Paintings
2013 sales $130,000 $ 55,000
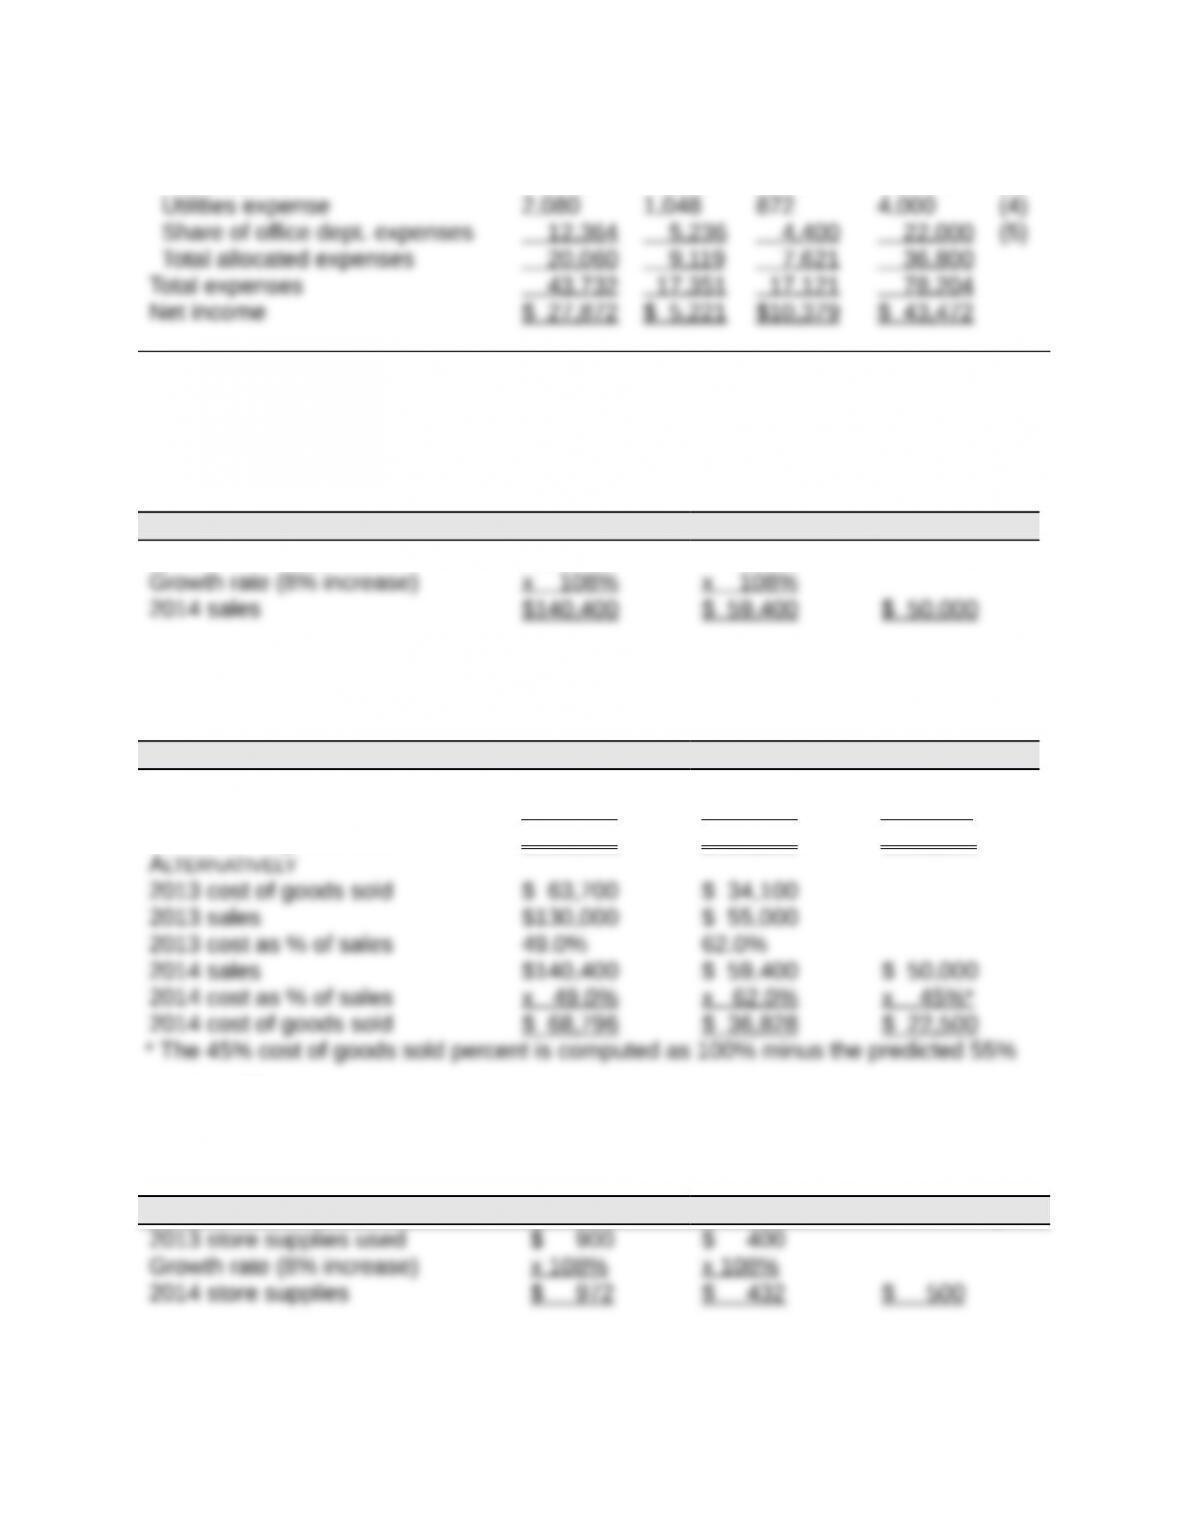
Note 2 (Cost of Goods Sold)
Clock Mirror Paintings
2013 cost of goods sold $ 63,700 $ 34,100 $ 50,000
Growth rate (8% increase) x 108% x 108% x 45%*
2014 cost of goods sold $ 68,796 $ 36,828 $ 22,500
gross margin.
Note 3 (Store Supplies Used)
Clock Mirror Paintings
Note 4 (Rent and Utilities)

Clock Mirror Paintings
2013 rent $ 7,020 $ 3,780
One-fifth from clock to paintings (1,404) $ 1,404
†Adjusted to eliminate rounding difference.
Note 5 (Office Department Expenses)
Clock Mirror Paintings
2014 sales $140,400 $ 59,400 $ 50,000
Percent of total sales * 56.2% 23.8% 20.0%
* Instructor note: If students round to something other than one-tenth of a percent,
their numbers will slightly vary.
.
Title: Problem 24-3A
QA_Ori:
Part 1
a.
Responsibility Accounting Performance Report
Dept. Manager, Camper Department
For the Year
Budgeted Actual Over (Under)
Amount Amount Budget
Controllable Costs
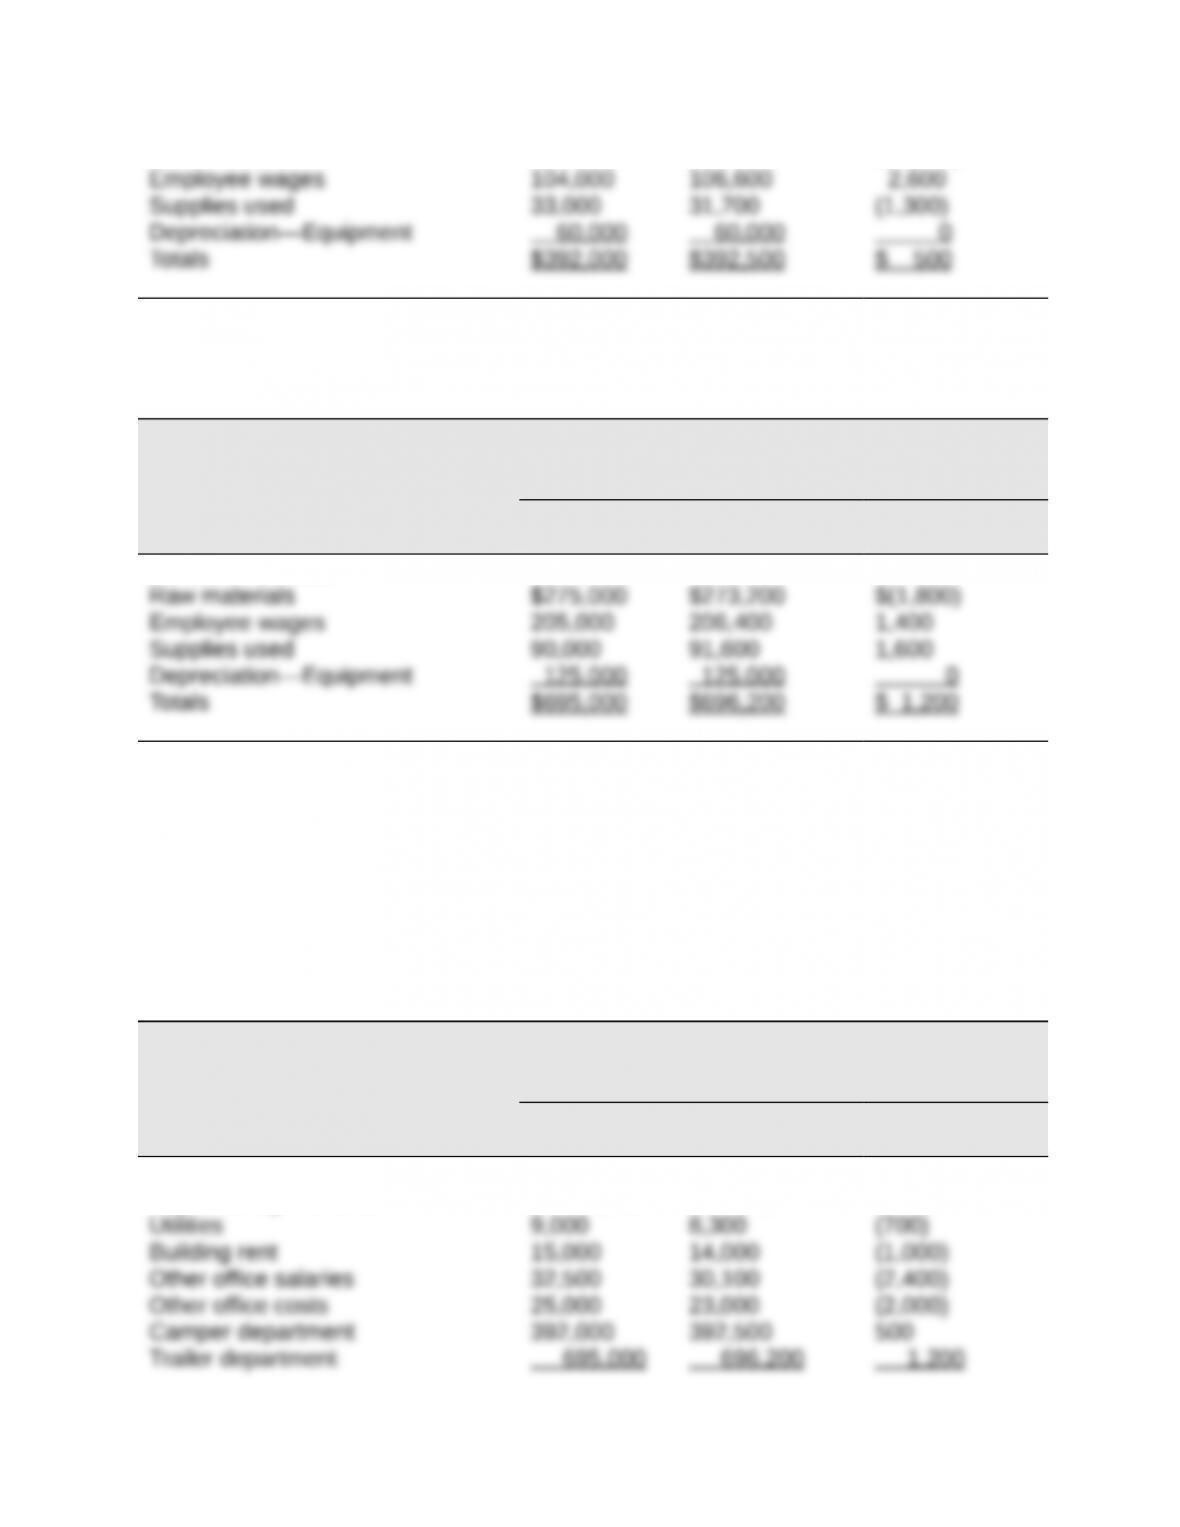
Raw materials $195,000 $194,200 $ (800)
b.
Responsibility Accounting Performance Report
Dept. Manager, Trailer Department
For the Year
Budgeted Actual Over (Under)
Amount Amount Budget
Controllable Costs
c.
Responsibility Accounting Performance Report
Plant Manager, Indiana Plant
For the Year
Budgeted Actual Over (Under)
Amount Amount Budget
Controllable Costs
Dept. manager salaries $ 95,000 $ 97,500 $ 2,500

Part 2
The plant manager did a better job of controlling costs and meeting the budget. She