Chapter 24
Performance Measurement and
Responsibility Accounting
QUESTIONS
1. Many companies are divided into departments when they become too large to be
effectively managed as single units. This division into departments is often needed
2. Operating departments are directly involved in manufacturing or selling the
3. Controllable costs of a department are those that the department’s manager has the
power to control, determine or at least strongly influence. The manager does not
4. Controllable and uncontrollable costs must be identified with a particular manager
and a definite time period.
6. Two main goals in managerial accounting for departments are to measure the: (i)
7. Not usually; a cost center cannot usually be evaluated in terms of its profitability
8. Direct expenses of a department are expenses that are incurred for the sole benefit
of that department—there is little doubt about which department should be charged
Fundamental Accounting Principles, 21st Edition
1416
9. a) Sales of the departments or the number of employees in each department.
b) Square feet of floor space, perhaps adjusted for its value.
c) Square feet of floor space or cubic feet of space occupied.
10. A department’s contribution to overhead is measured by subtracting its direct
expenses from its revenues.
11. The individual responsible for controlling the cost needs timely reports with specific
12A. A transfer price is an amount used to record transactions made between divisions
13B. A joint cost is incurred to produce or purchase two or more different products at the
14B. Two examples of products with joint costs are: (1) Steel – used for home appliances,
15. a) It is useful to know the amount of sales for each department as well as direct
costs for each department. This information can help assess the effectiveness of
16. Controllable cost examples — labor of department, packaging supplies, office
equipment.
17. Cycle time is the time it takes a company to produce a product or service. Its
components are process time, inspection time, move time, and wait time.
18. Value-added time provides value to a product or service from a customer’s
19. Cycle efficiency is the ratio of value-added time divided by total cycle time. The
closer cycle efficiency is to 1, the more of a company’s time is spent on value-added
20. Yes. Arctic Cat can use cycle time and cycle efficiency to measure operating
QUICK STUDIES
Quick Study 24-1 (10 minutes)
1.
A
5.
F
2.
C
6.
B
3.
G
7.
E
4.
D
Quick Study 24-2 (10 minutes)
Possible allocation bases for these indirect expenses and service
department expenses include:
1. Proportion of total processing time for each factory department; or
number of production run schedules prepared for each department as a
percent of the total.
Quick Study 24-3 (5 minutes)
1.
D
3.
B
2.
C
4.
A
Quick Study 24-4 (15 minutes)
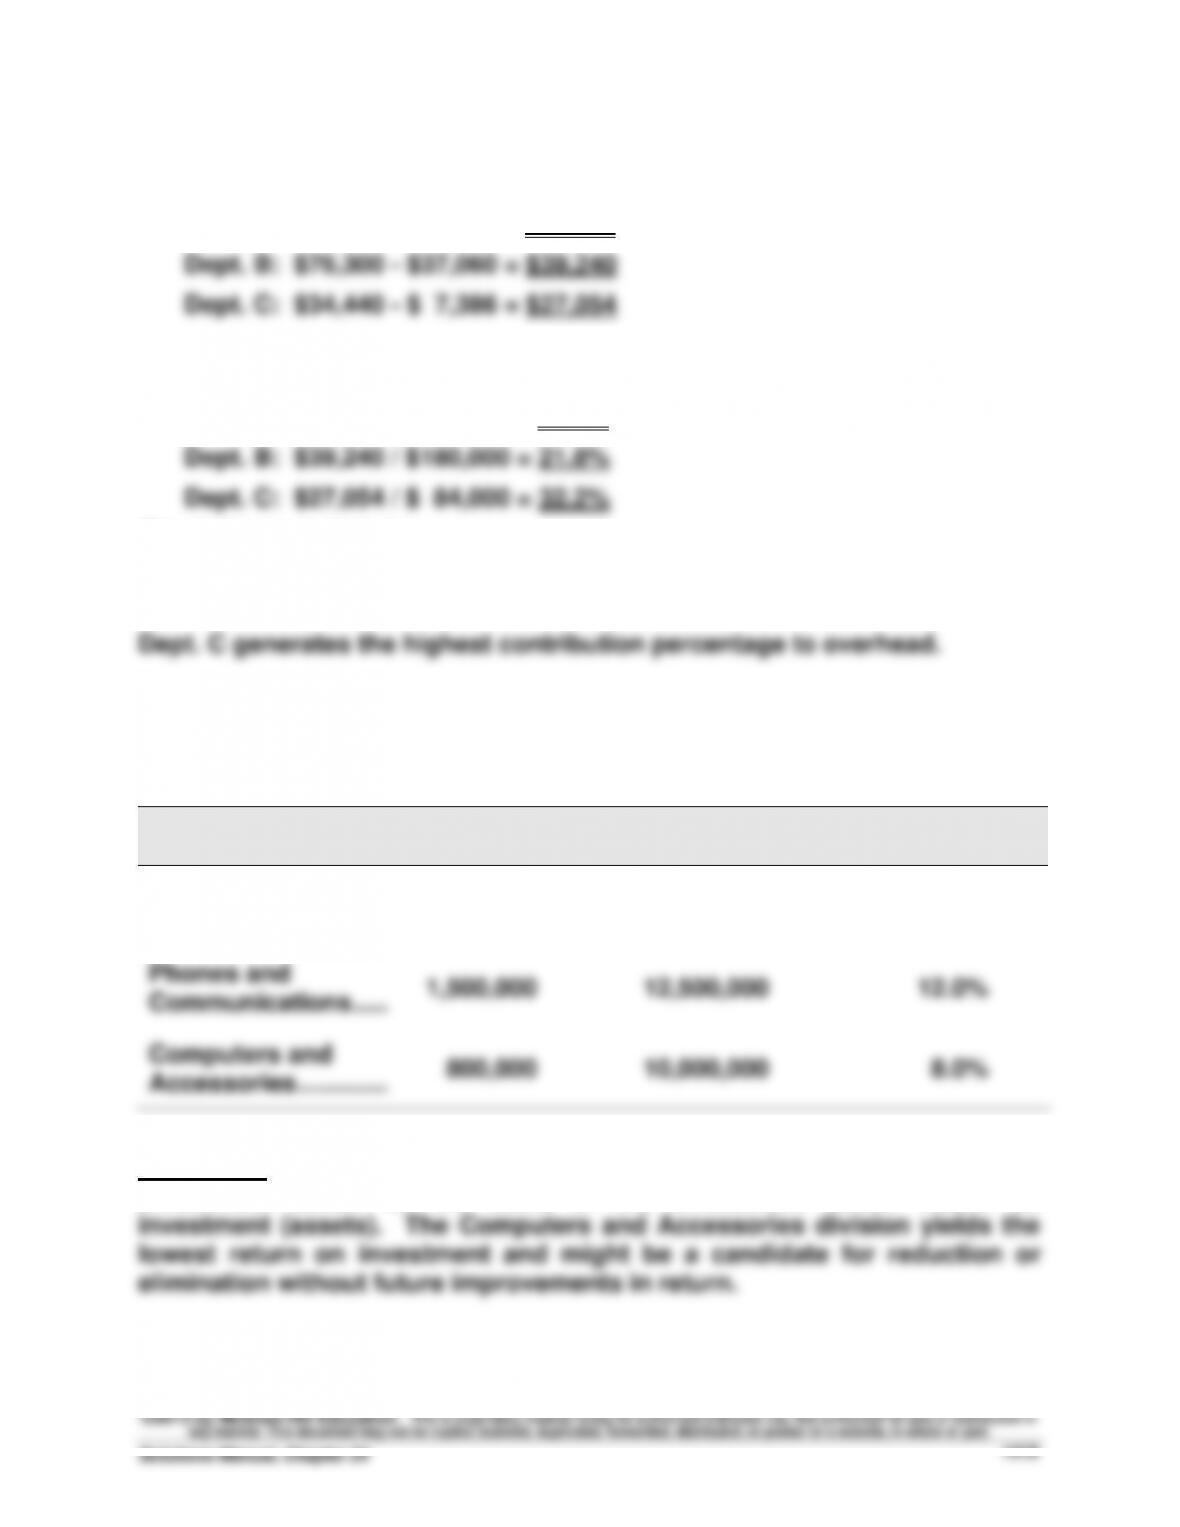
Departmental contribution to overhead
Dept. A: $18,815 – $ 3,660 = $15,155
Departmental contribution to overhead (as a percent of sales)*
Dept. A: $15,155 / $ 53,000 = 28.6%
*Rounded to one decimal place
Dept. B contributes the highest dollar amount to overhead.
Quick Study 24-5 (10 minutes)
Investment Center
Net Income
Average Assets
Return on
Investment (Assets)
Cameras and
Camcorders …………..….
$4,500,000
$20,000,000
22.5%
Phones and
Communications ……….
1,500,000
12,500,000
12.0%
Computers and
Accessories …………..….
800,000
10,000,000
8.0%
Comments: The Cameras and Camcorders division is the superior
investment center on the basis of the investment center return on
Quick Study 24-6 (10 minutes)
Cameras &
Camcorders
Phones &
Communication
Computers &
Accessories
Net income …………………………
$4,500,000
$1,500,000
$ 800,000
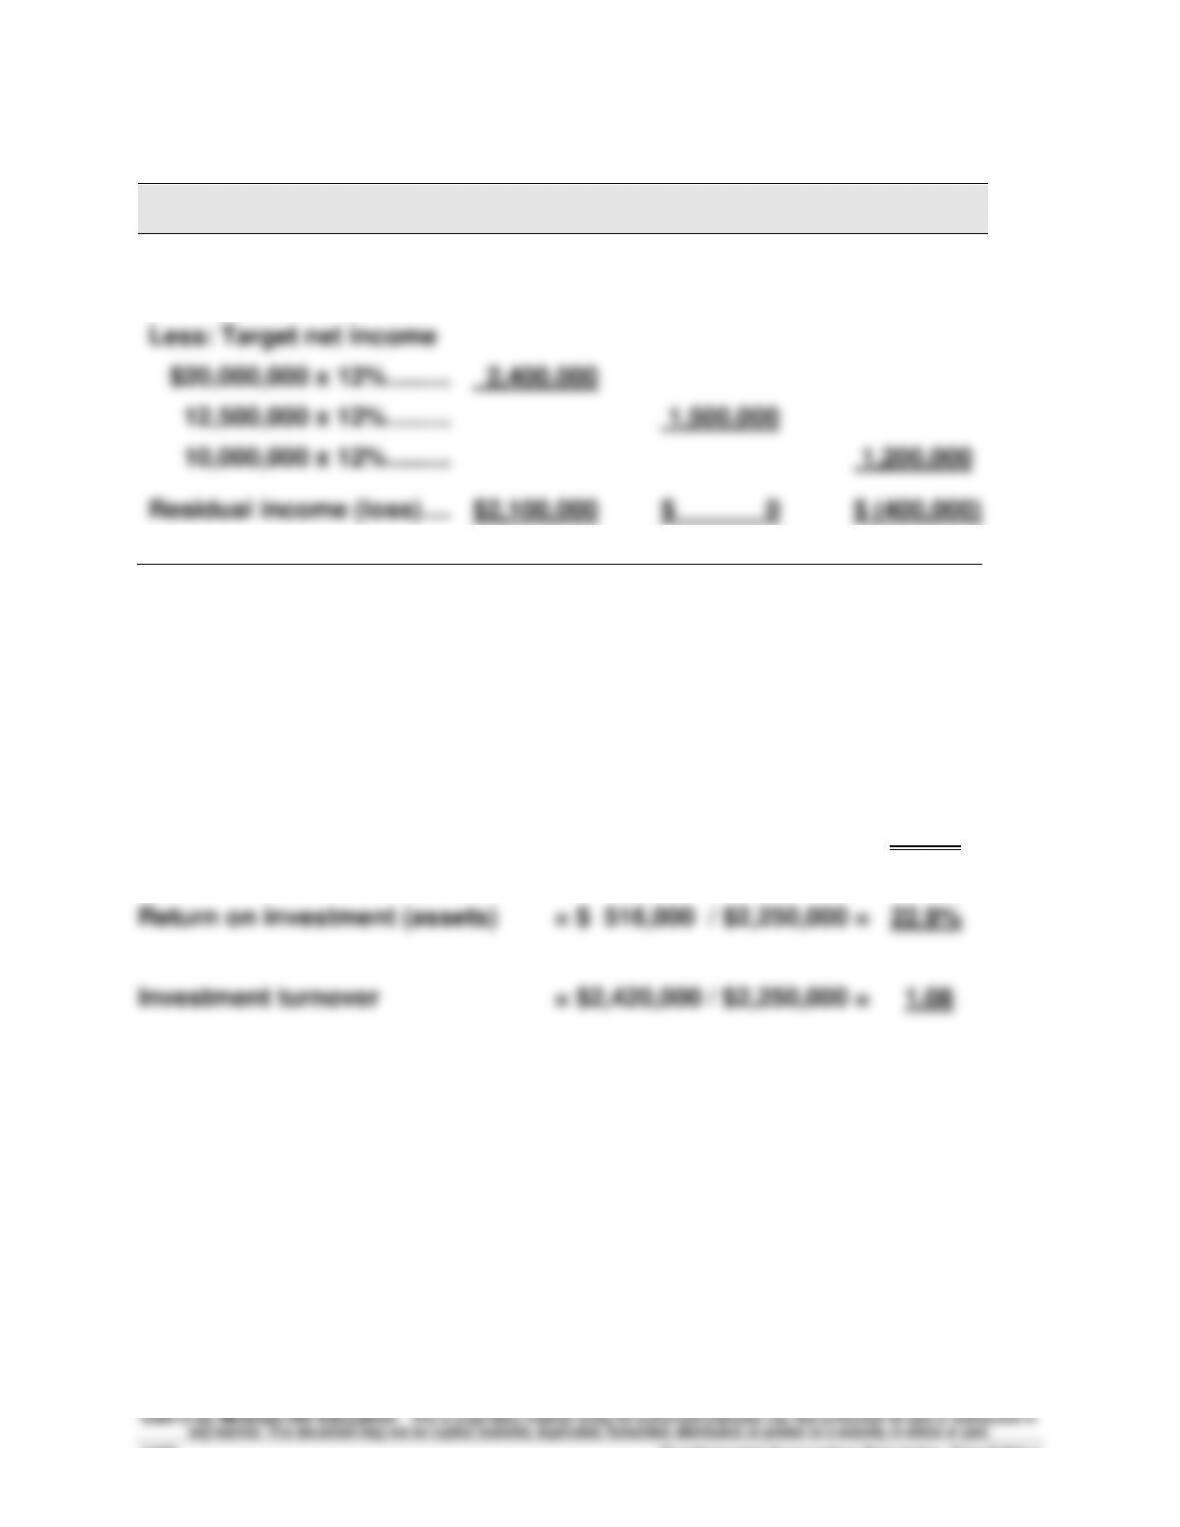
Less: Target net income
$20,000,000 x 12% ……………
12,500,000 x 12% ……………
10,000,000 x 12% ……………
2,400,000
1,500,000
1,200,000
Residual income (loss) ….……
$2,100,000
$ 0
$ (400,000)
Quick Study 24-7 (10 minutes)
Profit margin = $ 516,000 / $2,420,000 = 21.3%
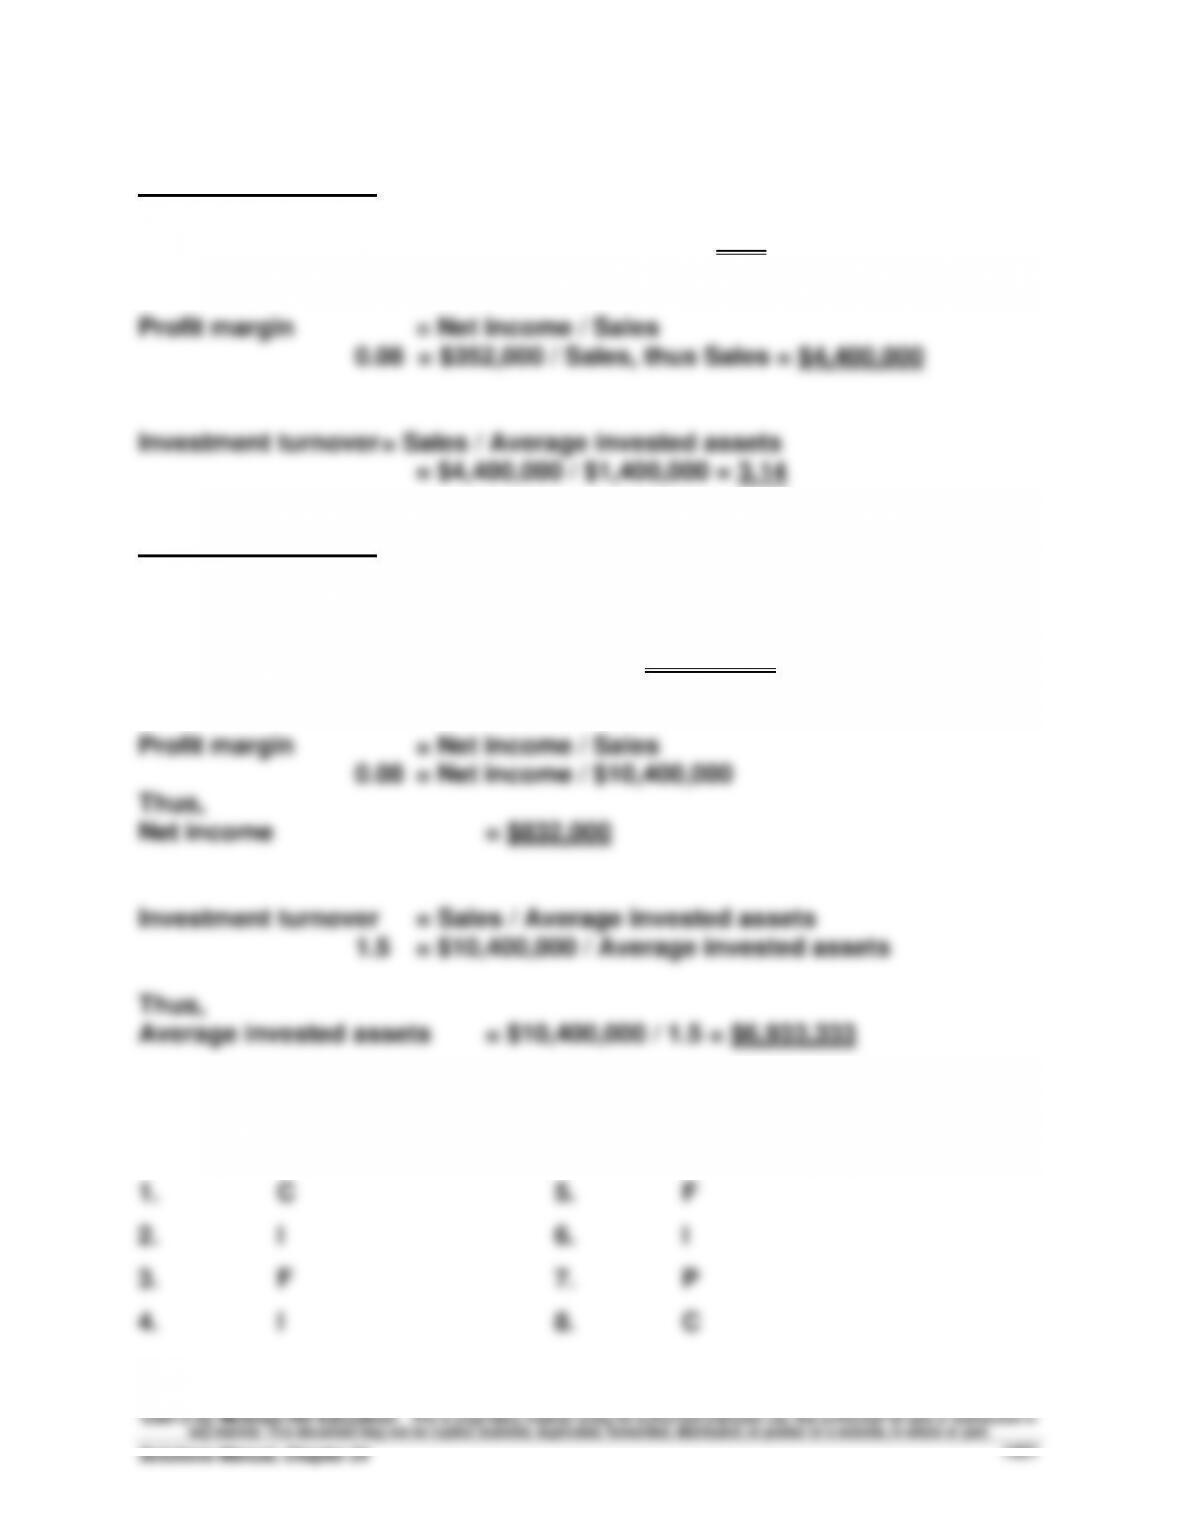
Quick Study 24-8 (15 minutes)
Investment center A:
Return on investment = Net income / Average invested assets
= $352,000 / $1,400,000 = 25%
Investment center B:
Return on investment = Profit margin x Investment turnover
0.12 = Profit margin x 1.5
Thus,
Profit margin = 0.12 / 1.5 = 0.08, or 8%
Quick Study 24-9 (5 minutes)
Fundamental Accounting Principles, 21st Edition
1422
Quick Study 24-10 (10 minutes)
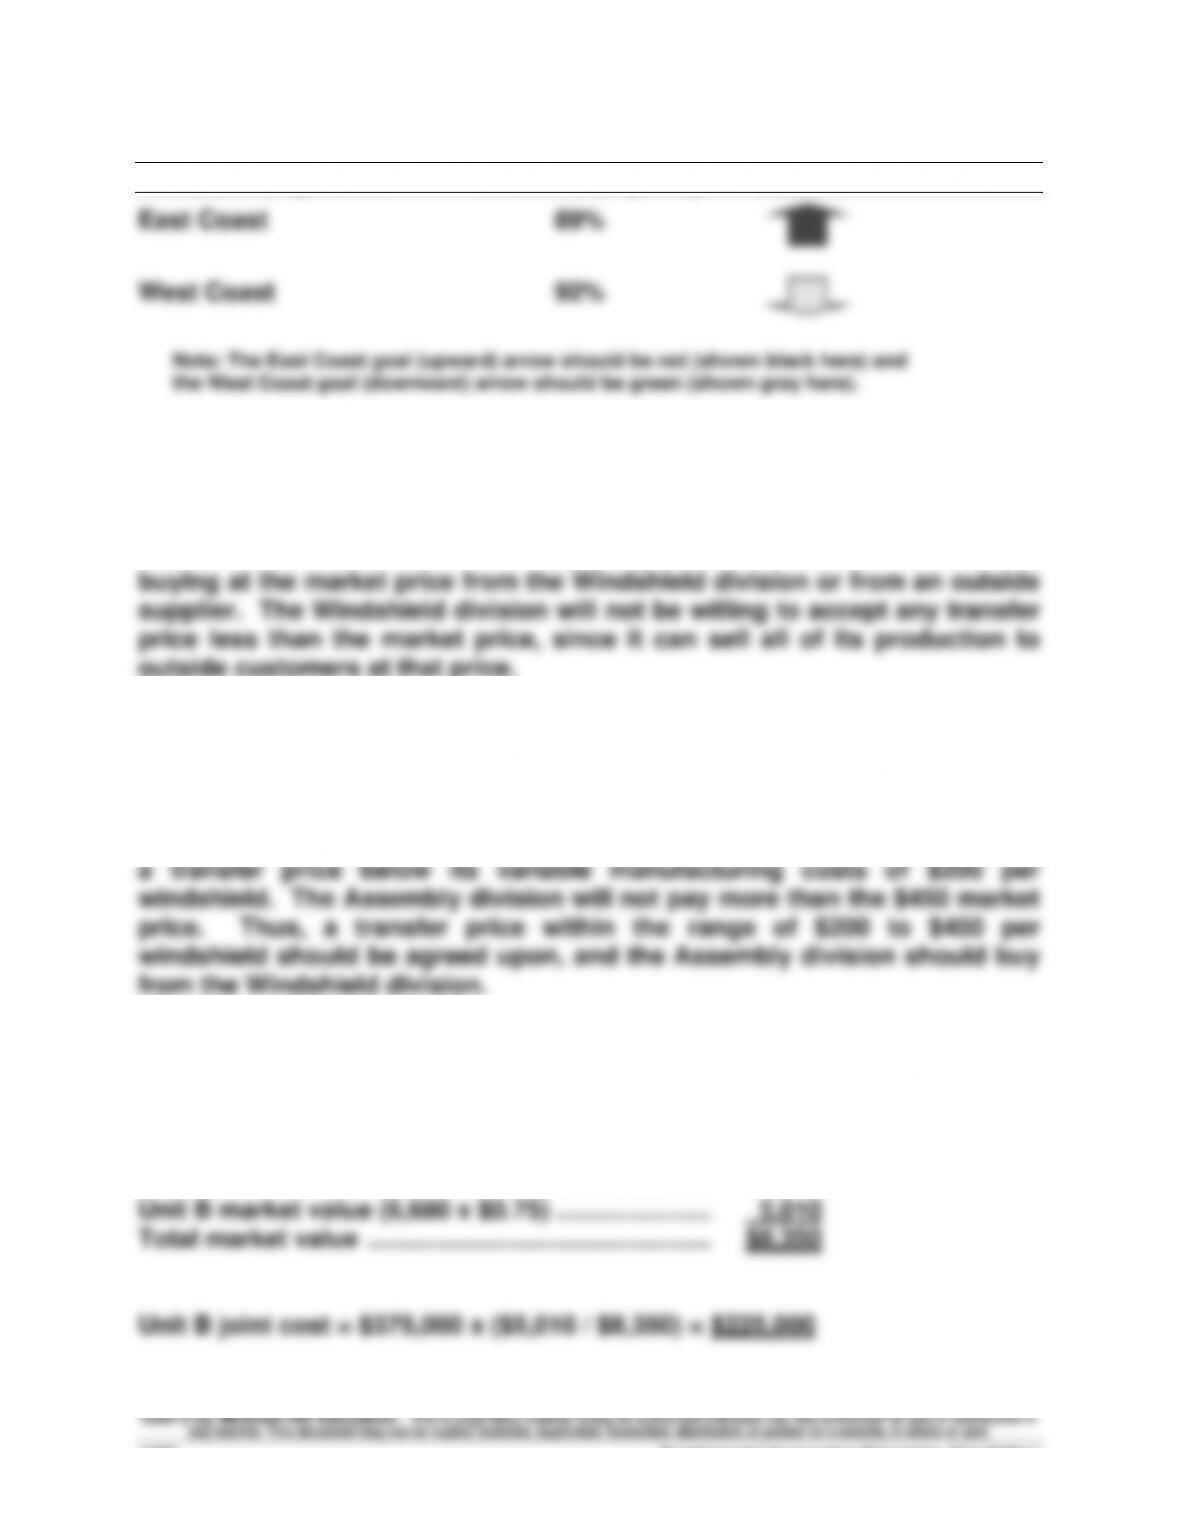
Process Perspective Actual Occupancy Goal
Quick Study 24-11A (10 minutes)
Without excess capacity, a market–based transfer price of $450 per
windshield should be used. The Assembly division should be indifferent to
Quick Study 24-12A (10 minutes)
If the Windshield division has excess capacity, a range of acceptable
transfer prices becomes possible. The Windshield division will not accept
Quick Study 24-13B (15 minutes)
Total joint cost = $325,000 + $50,000 = $375,000
Unit A market value (3,340 x $1.00) …………………..…….
$3,340
Unit B market value (6,680 x $0.75) …………………..…….
5,010
Total market value …………………………………………..…….
$8,350
Unit B joint cost = $375,000 x ($5,010 / $8,350) = $225,000
Quick Study 24-14 (15 minutes)
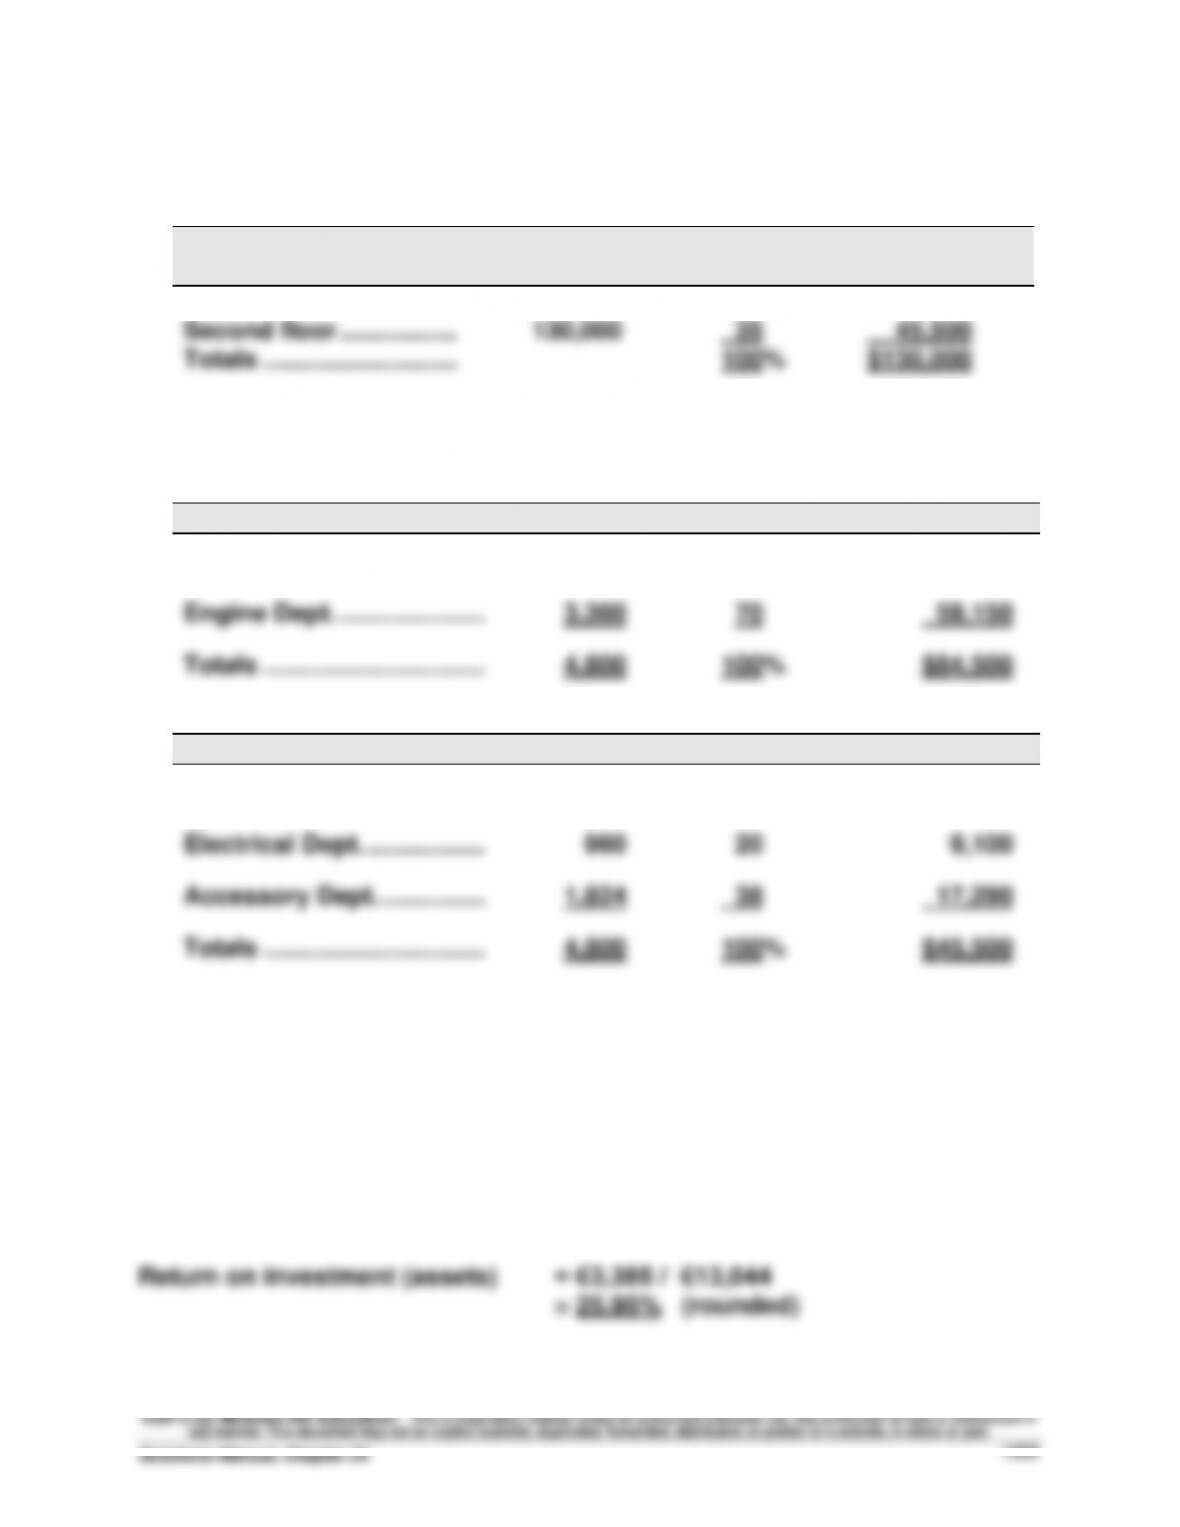
The first step is to allocate total rent expense between the two floors.
Amount
Allocated
% of Total
Cost
First floor ………………….
$130,000
65%
$ 84,500
Second floor ……………..
130,000
35
45,500
Totals ……………………….
100%
$130,000
The second step is to allocate these portions of total rent expense across
the departments occupying the two floors
First Floor
Sq. Feet
% of Total
Cost
Paint Dept. …………………………
1,440
30%
$25,350
Engine Dept. ………………………
3,360
70
59,150
Totals …………………………..
4,800
100%
$84,500
Second Floor
Sq. Feet
% of Total
Cost
Window Dept. ……………….……
2,016
42%
$19,110
Electrical Dept. ……………..……
960
20
9,100
Accessory Dept. …………………
1,824
38
17,290
Totals …………………………..
4,800
100%
$45,500
Quick Study 24-15 (5 minutes)
Average invested assets = (€12,888 + €13,099) / 2
= €12,994 (rounded)
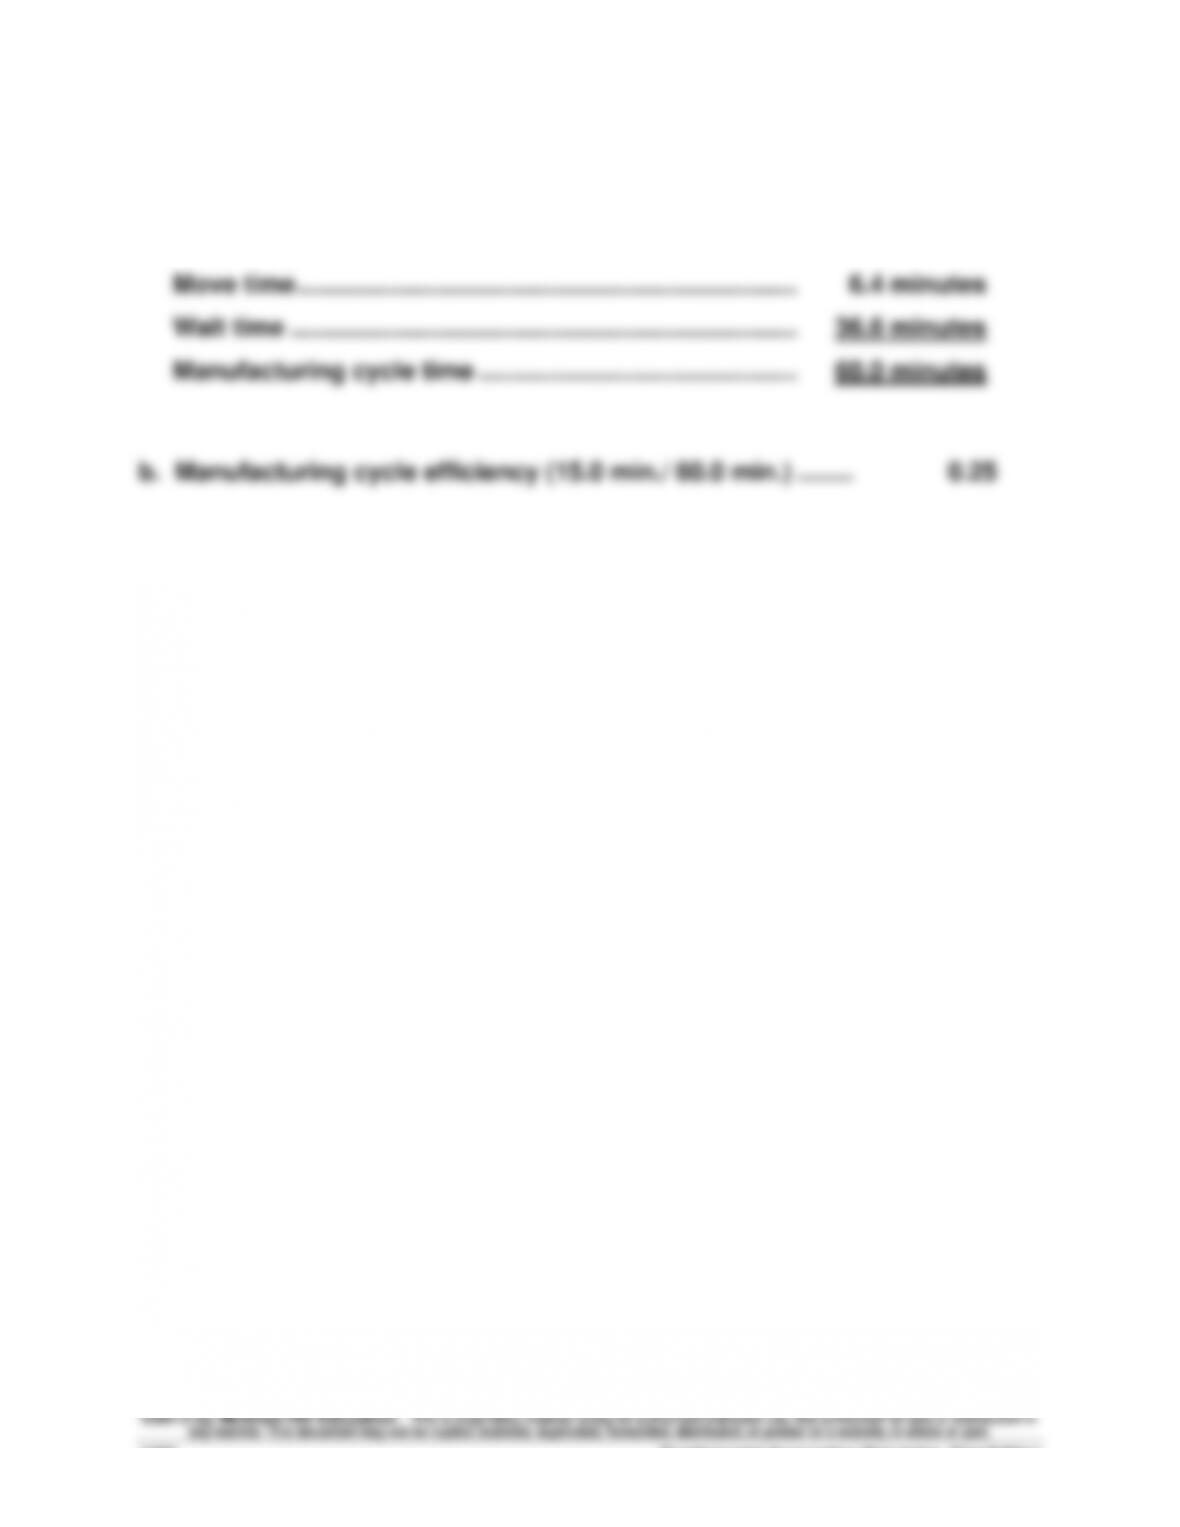
Manufacturing cycle efficiency (15.0 min./ 60.0 min.) ……..…
Quick Study 24-16 (10 minutes)
a.
Process time ………………………………………………………….………..
15.0 minutes
Inspection time ……………………………………………………….
2.0 minutes
Move time ………………………………………………………………………..
6.4 minutes
Wait time ……………………………………………………………….………..
36.6 minutes
Manufacturing cycle time ……………………………………….………..
60.0 minutes
EXERCISES
Exercise 24-1 (25 minutes)
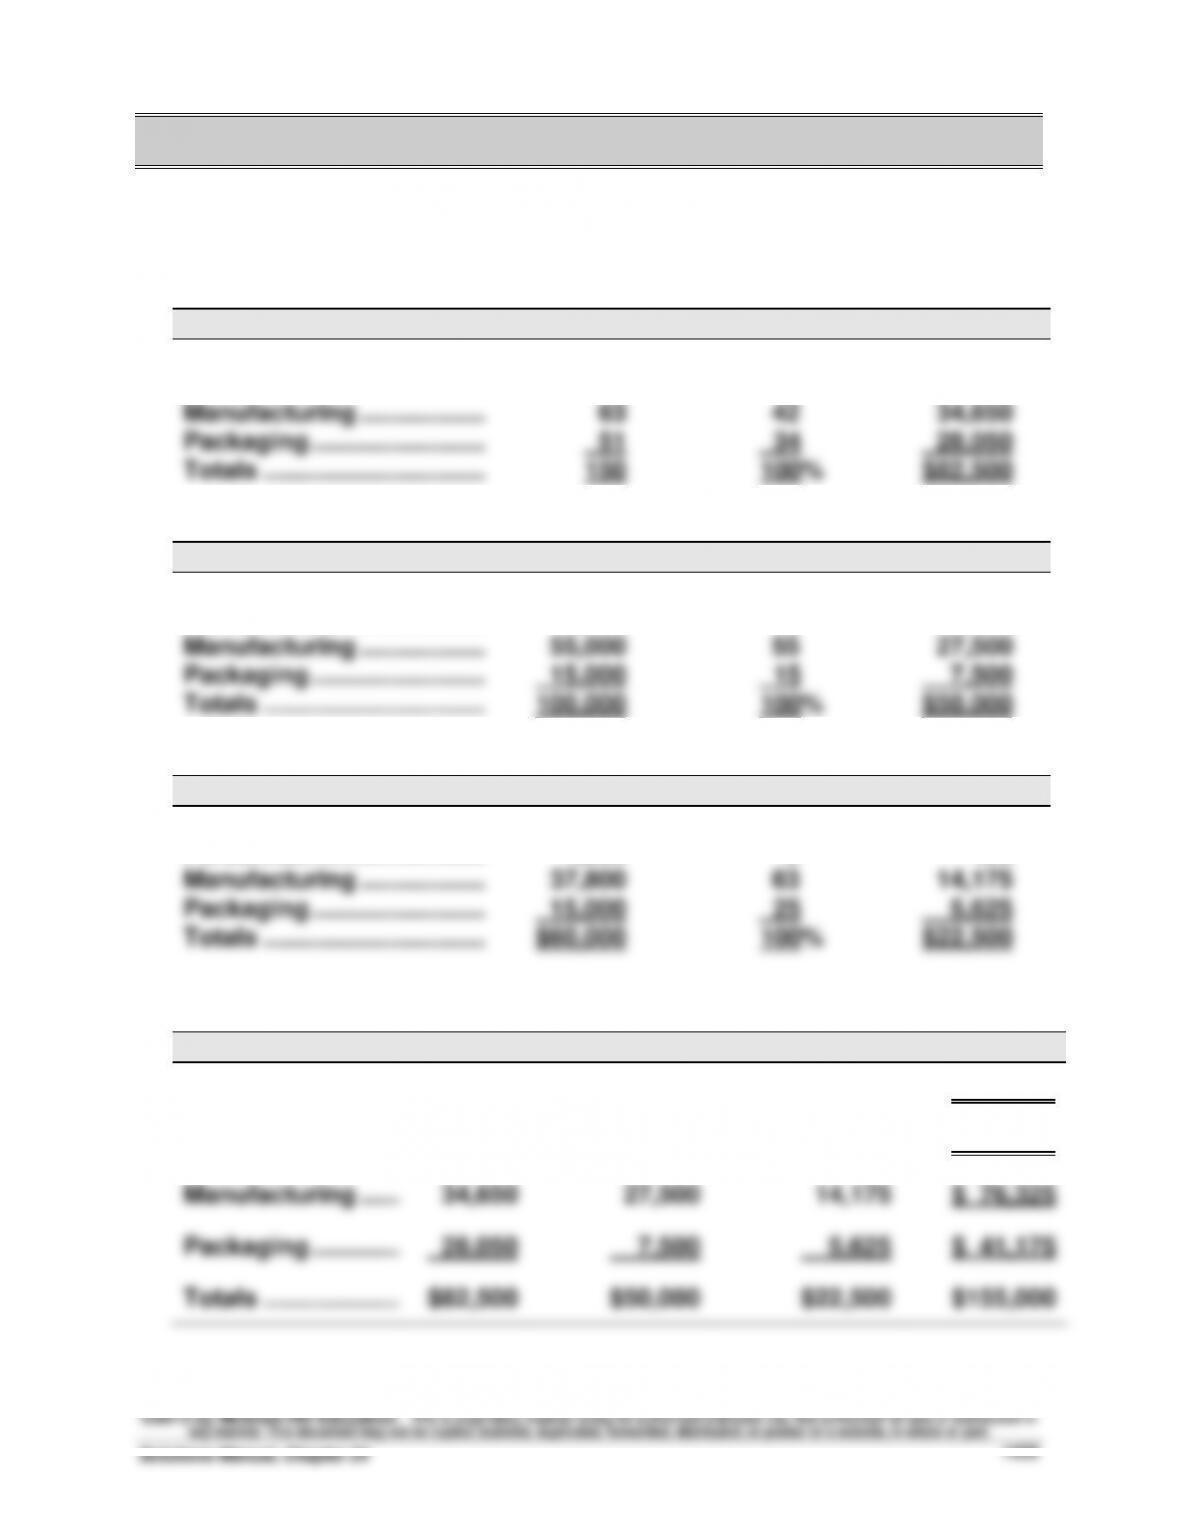
1. Allocation of Indirect Expenses to Four Operating Departments
Supervision expenses
Department
Employees
% of Total
Cost
Materials …………………………..
27
18%
$14,850
Personnel ……………………..……
9
6
4,950
Manufacturing ……………………
63
42
34,650
Packaging …………………….……
51
34
28,050
Totals …………………………..
150
100%
$82,500
Utilities expenses
Department
Square Feet
% of Total
Cost
Materials …………………………..
25,000
25%
$12,500
Personnel ……………………..……
5,000
5
2,500
Manufacturing ……………………
55,000
55
27,500
Packaging …………………….……
15,000
15
7,500
Totals …………………………..
100,000
100%
$50,000
Insurance expenses
Department
Assets Value
% of Total
Cost
Materials …………………………..
$ 6,000
10%
$ 2,250
Personnel ……………………..……
1,200
2
450
Manufacturing ……………………
37,800
63
14,175
Packaging …………………….……
15,000
25
5,625
Totals …………………………..
$60,000
100%
$22,500
2. Report of Indirect Expenses Assigned to Four Operating Departments
Supervision
Utilities
Insurance
Total
Materials …………………………..
$14,850
$12,500
$ 2,250
$ 29,600
Personnel …………..………………
4,950
2,500
450
$ 7,900
Manufacturing ……………………
34,650
27,500
14,175
$ 76,325
Packaging ………….………………
28,050
7,500
5,625
$ 41,175
Totals ………………..…………
$82,500
$50,000
$22,500
$155,000
Fundamental Accounting Principles, 21st Edition
1426
Exercise 24-2 (30 minutes)
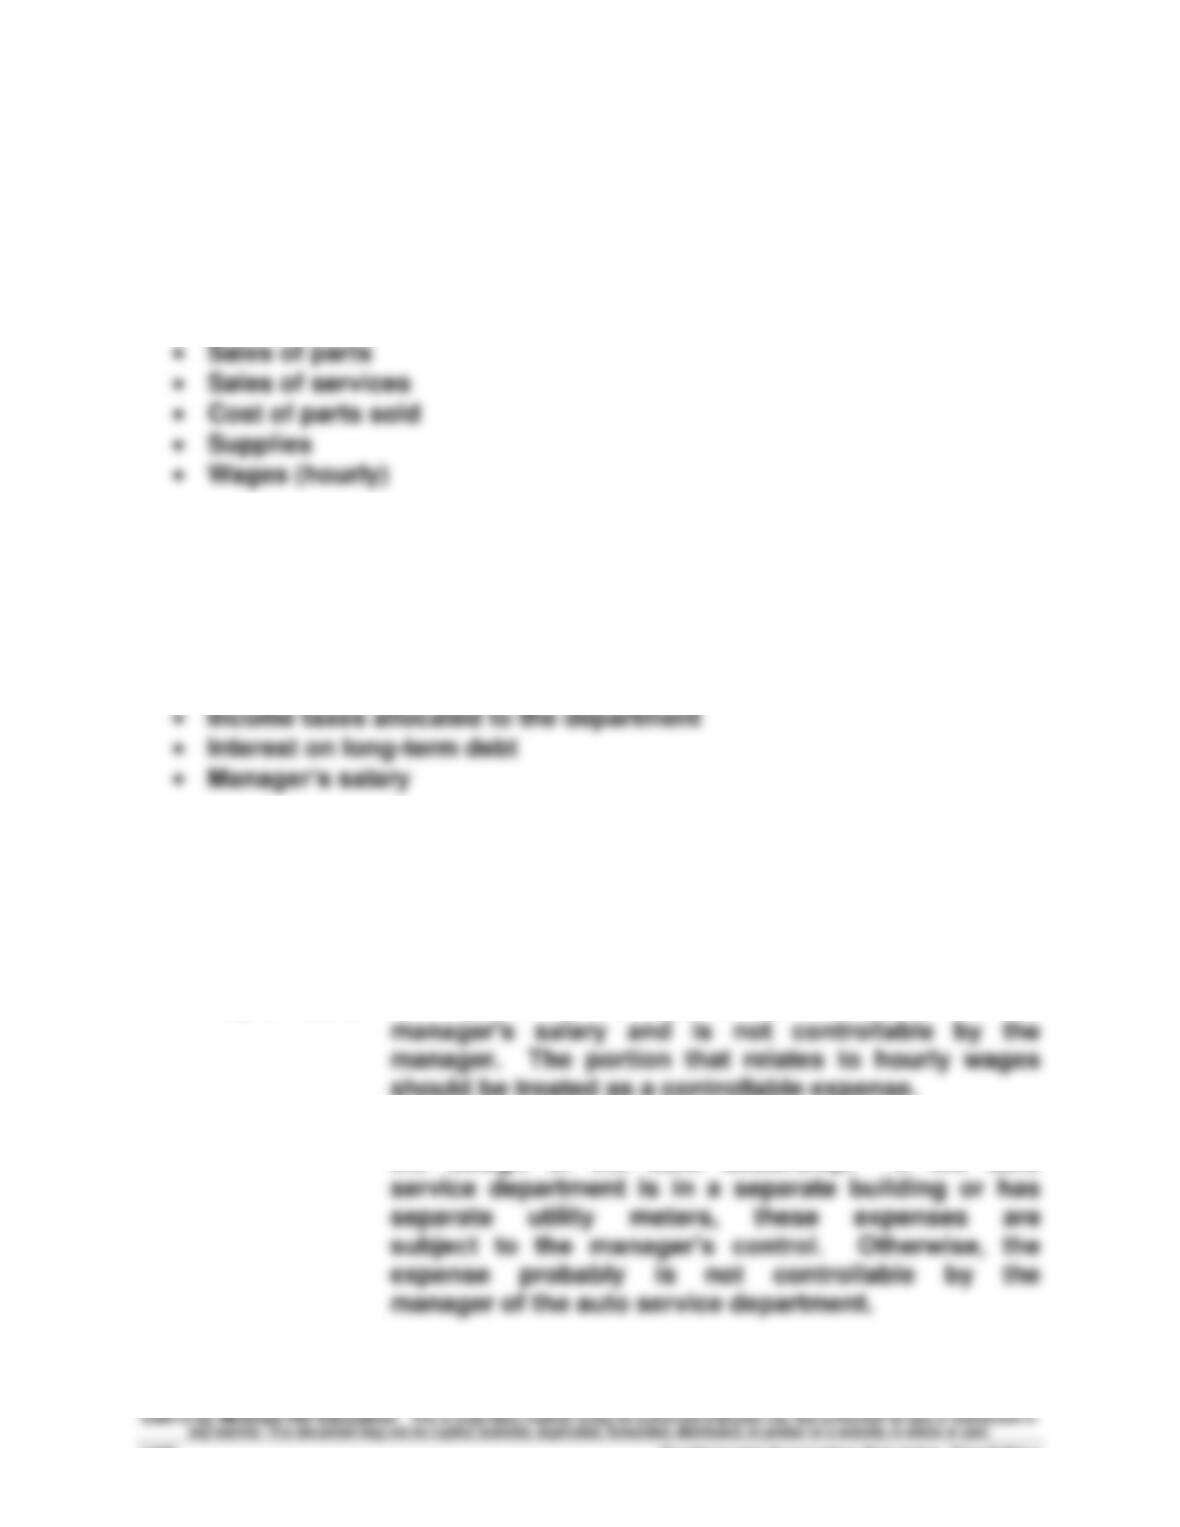
(1) Items included in performance report
The following items definitely should be included in the performance
report for the auto service department manager because they are
controlled or strongly influenced by the manager’s decisions and
activities:
(2) Items excluded from performance report
The following items definitely should be excluded from the performance
report because the department manager cannot control or strongly
influence them:
• Building depreciation
(3) Items that may or may not be included in performance report
The following items cannot be definitely included or definitely excluded
from the performance report because they may or may not be
completely under the manager’s control or strong influence:
• Payroll taxes Some portion of this expense relates to the
should be treated as a controllable expense.
• Utilities Whether this expense is controllable depends on
the design of the auto dealership. If the auto
Exercise 24-3 (20 minutes)
(1)
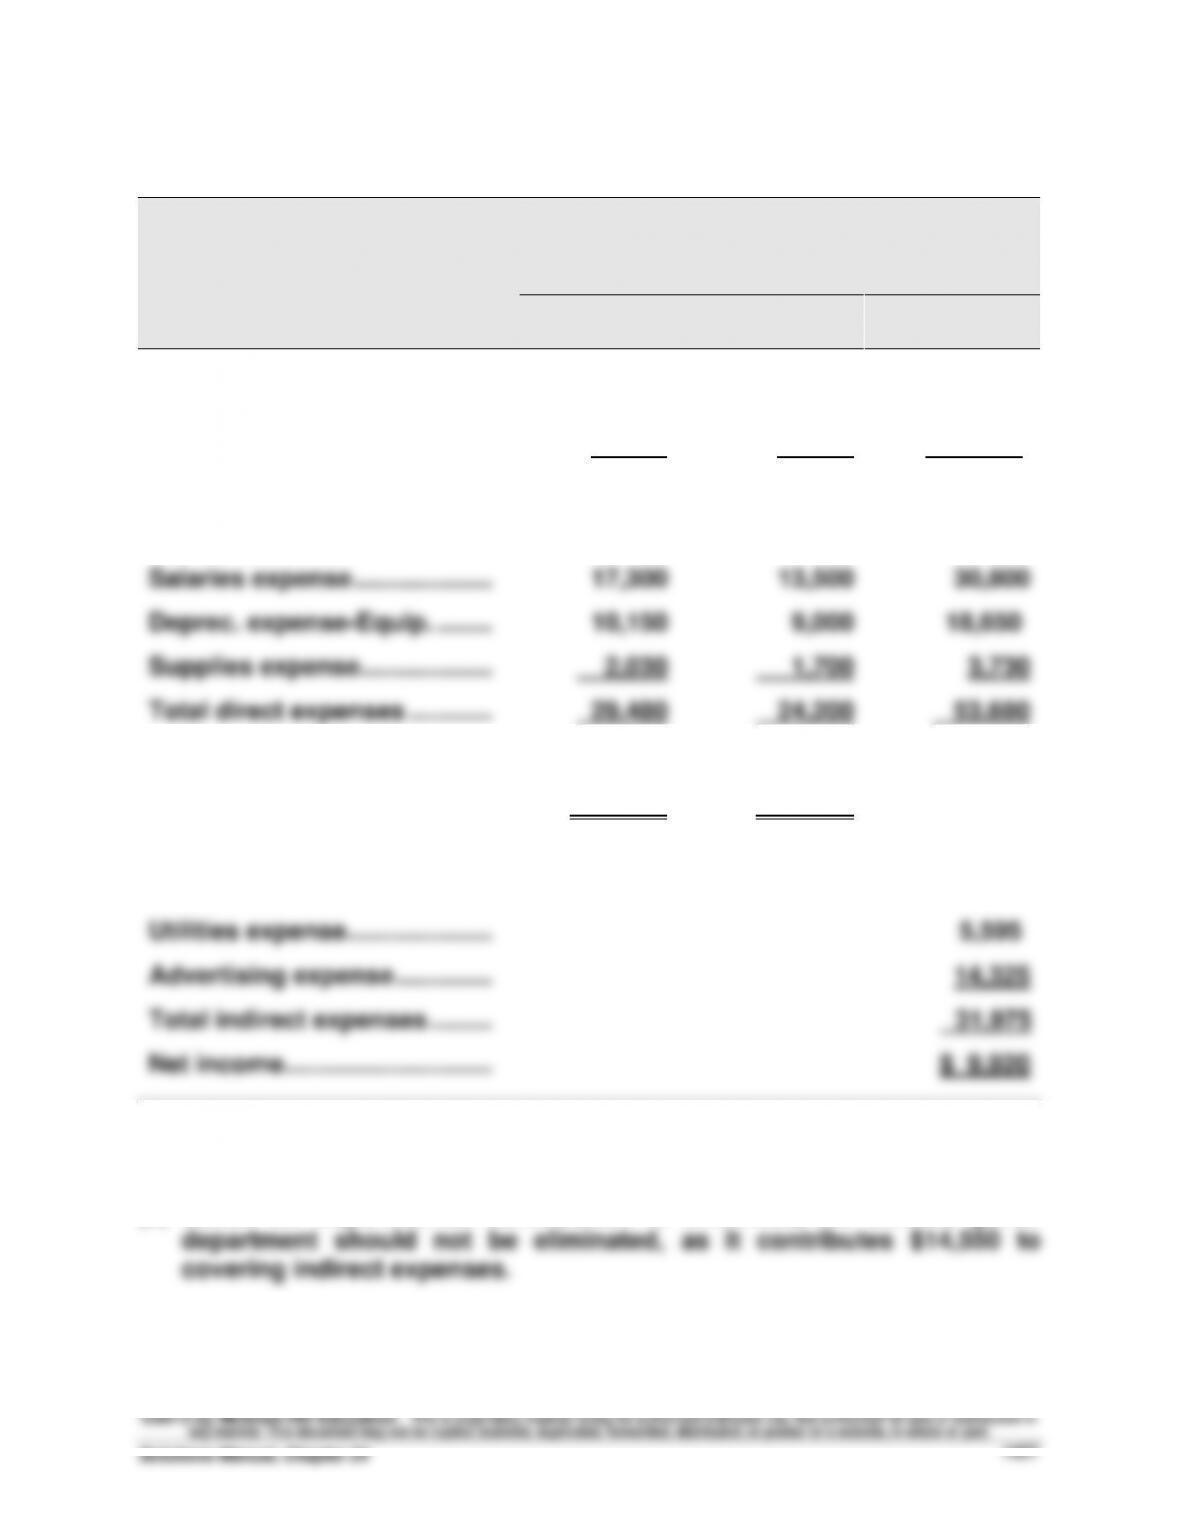
WHOLESALE GUITARS
Departmental Contribution Statements
For Year Ended December 31, 2013
Acoustic
Electric
Dept.
Dept.
Combined
Sales ………………………………….
$112,500
$105,500
$218,000
Cost of goods sold …………….
55,675
66,750
122,425
Gross profit ……………………….
56,825
38,750
95,575
Direct expenses
Salaries expense ………………..
17,300
13,500
30,800
Deprec. expense-Equip. ……..
10,150
9,000
18,650
Supplies expense……………….
2,030
1,700
3,730
Total direct expenses …………
29,480
24,200
53,680
Departmental contributions to
overhead
Indirect expenses
$ 27,345
$ 14,550
$ 41,895
Rent expense ……………………..
12,055
Utilities expense…………………
5,595
Advertising expense …………..
14,325
Total indirect expenses ………
31,975
Net income …………………………
$ 9,920
(2) Based on departmental contribution to overhead, the electric guitar
Fundamental Accounting Principles, 21st Edition
1428
Exercise 24-4 (20 minutes)
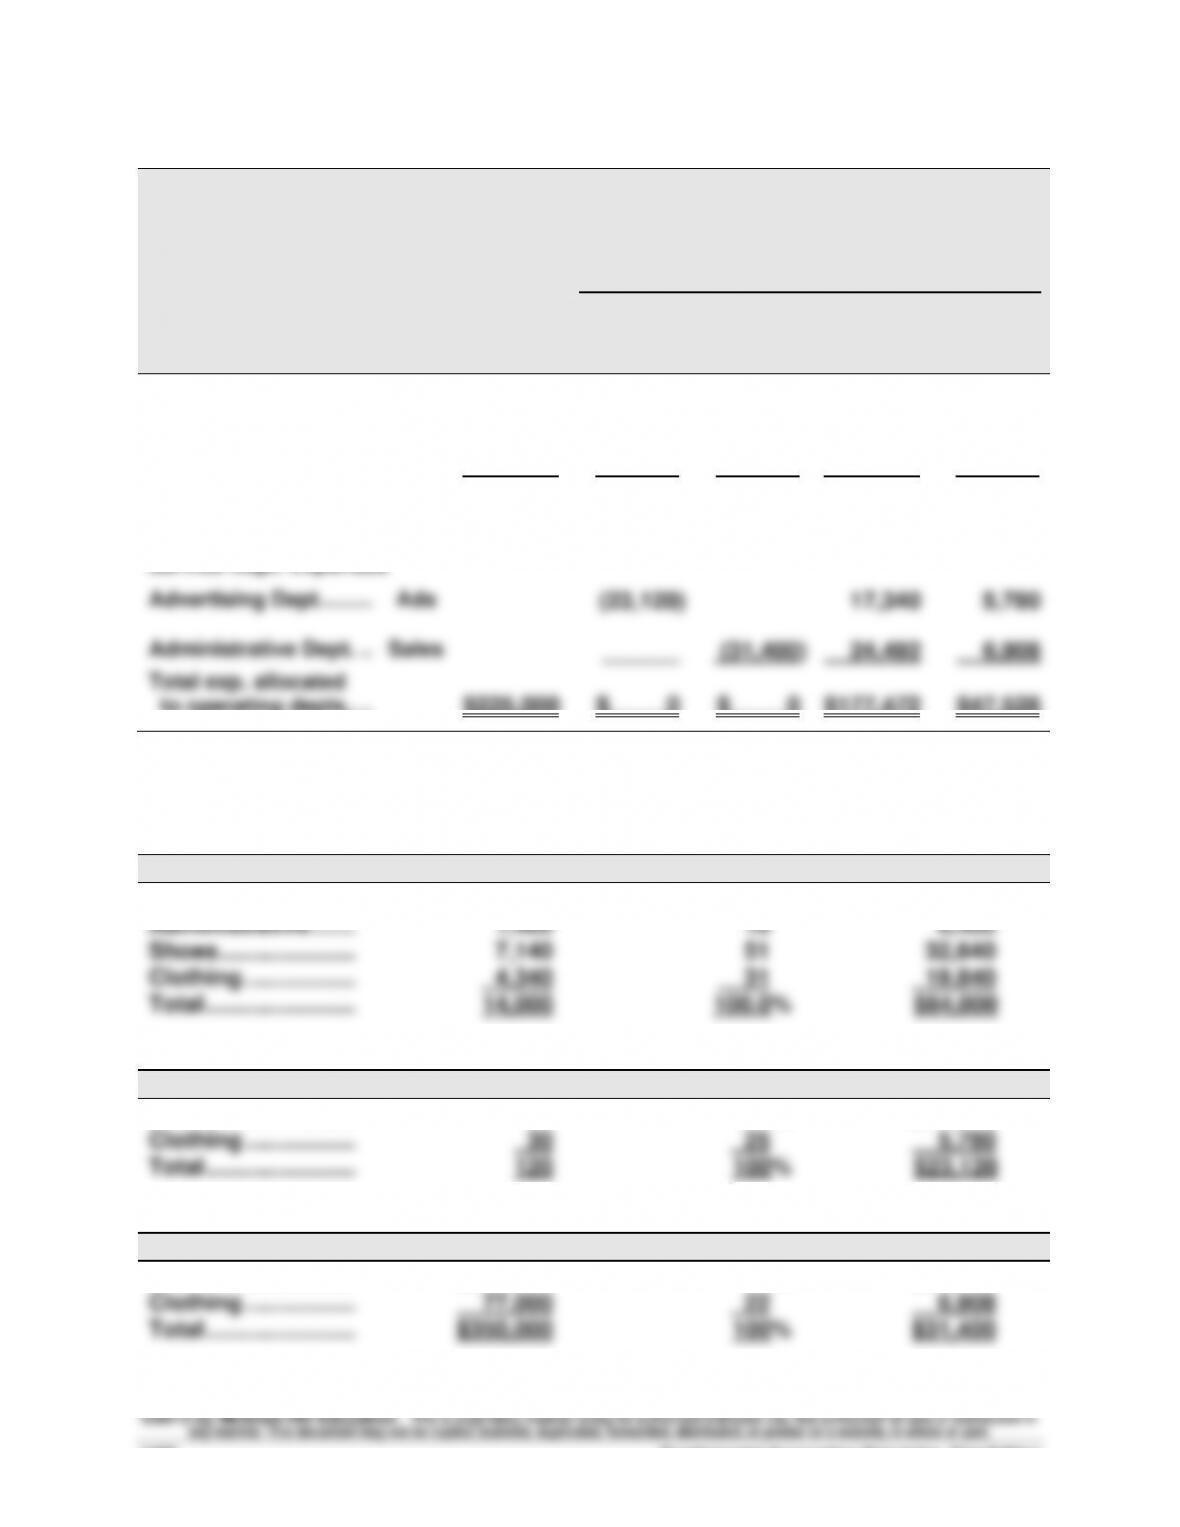
MARATHON RUNNING SHOP
Departmental Expense Allocation Spreadsheet
For Year Ended December 31, 2013
Allocation of Expenses to Departments .
Alloca-
tion
Base
Expense
Account
Balance
Adver-
tising
Dept.
Admini-
strative
Dept.
Shoes
Dept.
Clothing
Dept.
Direct expenses ………...
$161,000
$18,000
$25,000
$103,000
$15,000
Indirect utilities
expenses. ………………..
Sq.
feet
64,000
5,120
6,400
32,640
19,840
Total dept. exp. ………....
225,000
23,120
31,400
135,640
34,840
Service Dept. Expenses
Advertising Dept.……....
Ads
(23,120)
17,340
5,780
Administrative Dept. ....
Sales
______
(31,400)
24,492
6,908
Total exp. allocated
to operating depts.. ....
$225,000
$ 0
$ 0
$177,472
$47,528
Supporting expense allocation calculations
Utilities expense: $64,000
Square Feet
% of Total
Cost
Advertising …………
1,120
8%
$ 5,120
Administrative …….
1,400
10
6,400
Shoes …………………
7,140
51
32,640
Clothing ……………..
4,340
31
19,840
Total …………………..
14,000
100.0%
$64,000
Advertising expense: $23,120
Ads Placed
% of Total
Cost
Shoes …………………
90
75%
$17,340
Clothing ……………..
30
25
5,780
Total …………………..
120
100%
$23,120
Administrative expense: $31,400
Sales
% of Total
Cost
Shoes …………………
$273,000
78%
$24,492
Clothing ……………..
77,000
22
6,908
Total …………………..
$350,000
100%
$31,400
Exercise 24-5 (25 minutes)
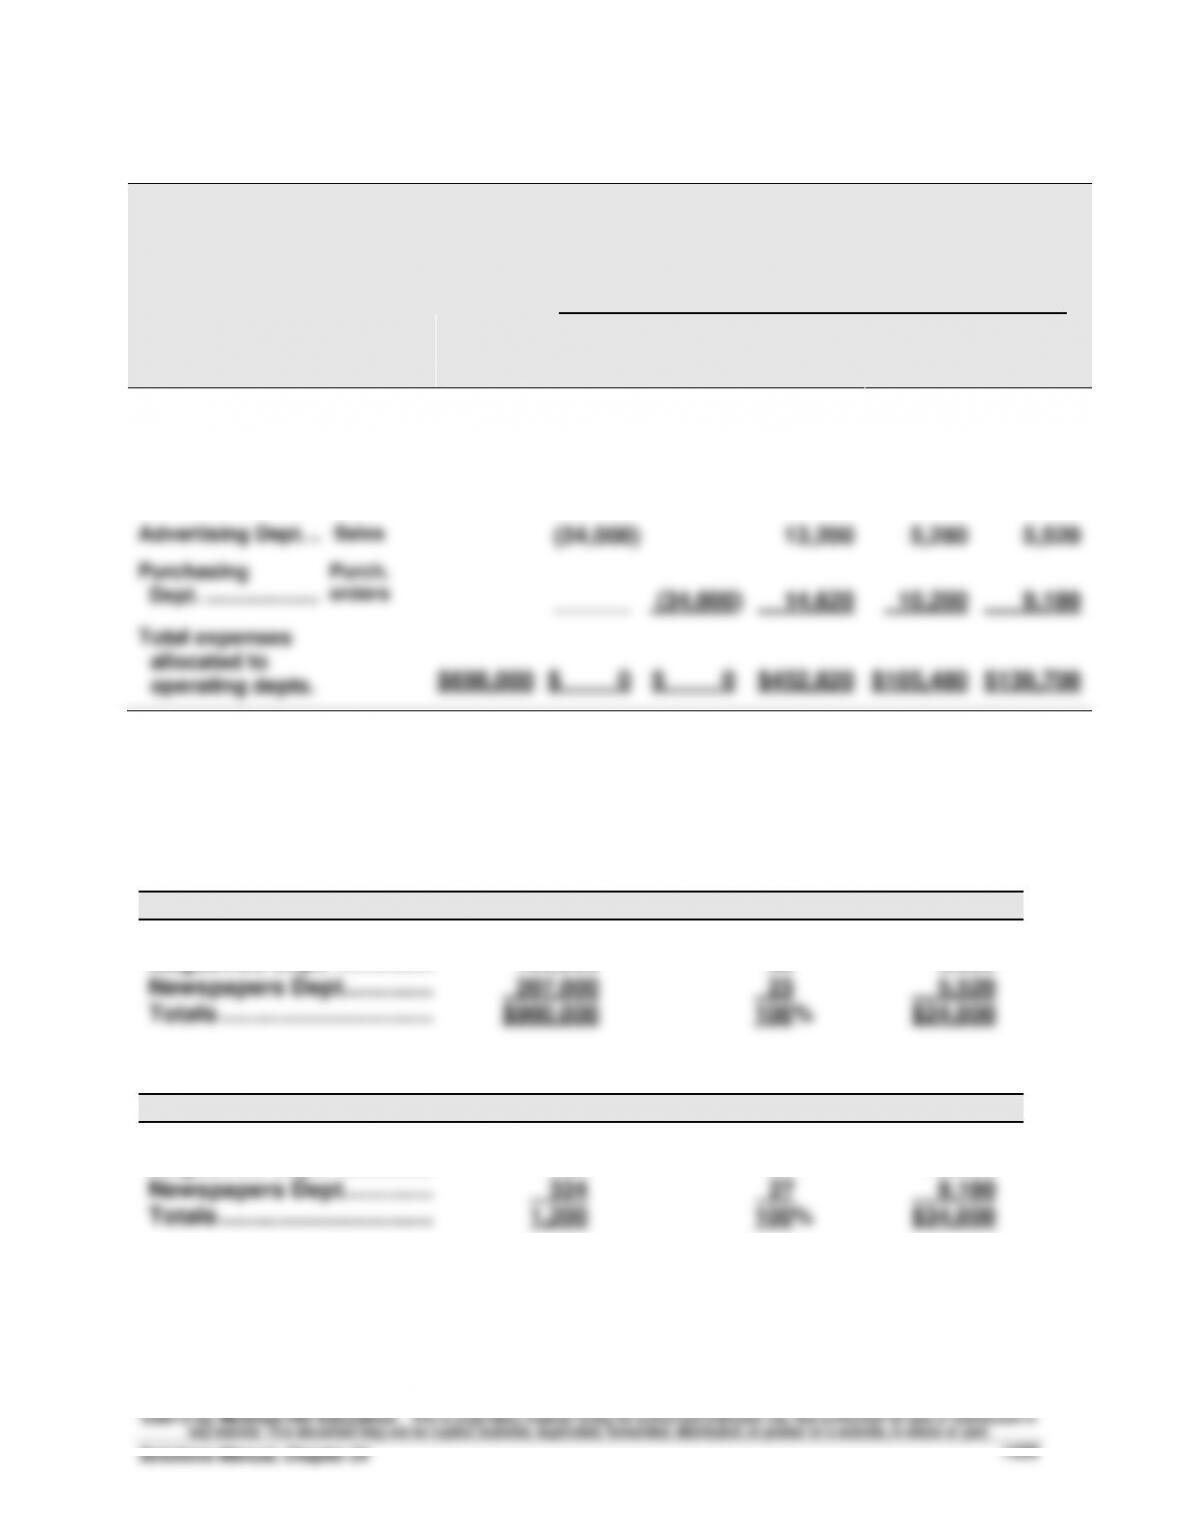
COZY BOOKSTORE
Departmental Expense Allocation Spreadsheet
For Period Ended _______
Allocation of Expenses to Departments .
Alloca-
tion Base
Exp.
Account
Balance
Adver-
tising
Dept.
Purch-
asing
Dept.
Books
Dept.
Maga-
zines
Dept.
News-
papers
Dept.
Total dept. exp. …….………….
$698,000
$24,000
$34,000
$425,000
$90,000
$125,000
Service Dept. Expenses
Advertising Dept. ..……………..
Sales
(24,000)
13,200
5,280
5,520
Purchasing
Dept. …………………………..
Purch.
orders
______
(34,000)
14,620
10,200
9,180
Total expenses
allocated to
operating depts.
$698,000
$ 0
$ 0
$452,820
$105,480
$139,700
Computations for allocations of service dept. costs to operating departments
Advertising: $24,000
Sales
% of Total
Cost
Books Dept. …………………..………
$495,000
55%
$13,200
Magazines Dept. ……………………
198,000
22
5,280
Newspapers Dept.………….………
207,000
23
5,520
Totals ……………………………………
$900,000
100%
$24,000
Purchasing: $34,000
Purchase Orders
% of Total
Cost
Books Dept. …………………..………
516
43%
$14,620
Magazines Dept. ……………………
360
30
10,200
Newspapers Dept.………….………
324
27
9,180
Totals ……………………………………
1,200
100%
$34,000