24-1
CHAPTER 24
PERFORMANCE MEASUREMENT AND
RESPONSIBILITY ACCOUNTING
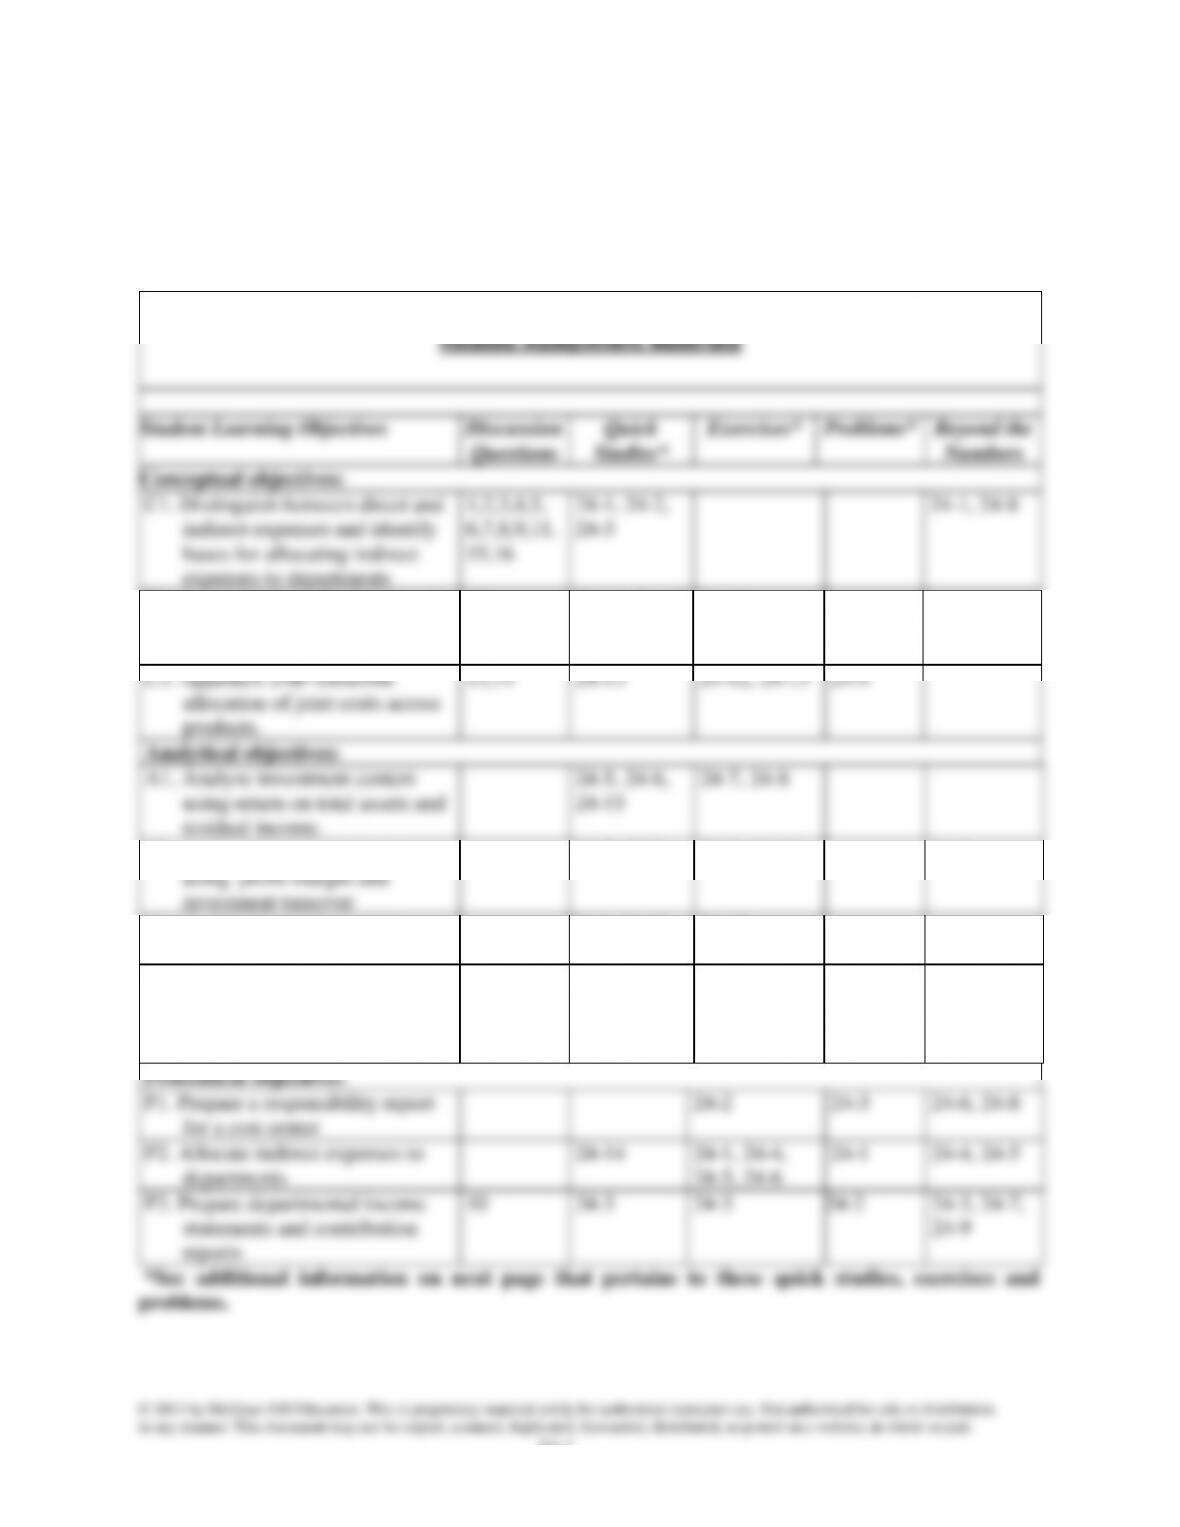
Related Assignment Materials
Student Learning Objectives
Discussion
Questions
Quick
Studies*
Exercises*
Problems*
Beyond the
Numbers
Conceptual objectives:
C1. Distinguish between direct and
indirect expenses and identify
bases for allocating indirect
expenses to departments
1,2,3,4,5,
6,7,8,9,11,
15,16
24-1, 24-2,
24-3
24-1, 24-8
C2. Appendix 24A—Explain transfer
pricing and methods to set
transfer prices.
12
24-11, 24-12
24-11
C3. Appendix 24B—Describe
allocation of joint costs across
products.
13,14
24-13
24-12, 24-13
24-4
Analytical objectives:
A1. Analyze investment centers
using return on total assets and
residual income.
24-5, 24-6,
24-15
24-7, 24-8
A2. Analyze investment centers
using profit margin and
investment turnover
24-7, 24-8
24-9, 24-14
24-2
A3. Analyze investment centers
using the balance scorecard
24-9, 24-10
24-10
A4. Compute cycle time and cycle
efficiency, and explain their
importance to production
management.
17,18, 19,
20
24-5
Procedural objectives:
P1. Prepare a responsibility report
for a cost center
24-2
24-3
24-6, 24-8
P2. Allocate indirect expenses to
departments
24-14
24-1, 24-4,
24-5, 24-6
24-1
24-4, 24-5
P3. Prepare departmental income
statements and contribution
reports
10
24-3
24-3
24-2
24-3, 24-7,
24-9
*See additional information on next page that pertains to these quick studies, exercises and
problems.
Additional Information on Related Assignment Material
Connect (Available on the instructor’s course-specific website) repeats all numerical Quick Studies, all
Exercises and Problems Set A. Connect provides new numbers each time the Quick Study, Exercise or
Problem is worked. It allows instructors to monitor, promote, and assess student learning. It can be used
in practice, homework, or exam mode.
Corresponding problems in set B also relate to learning objectives identified in grid on previous page.
Problems 24-1A and 24-2A can be completed using Excel. The Serial Problem for Success Systems
starts in this chapter and continues throughout many chapters of the text. It is most readily solved
manually if you use the working papers that accompany text.
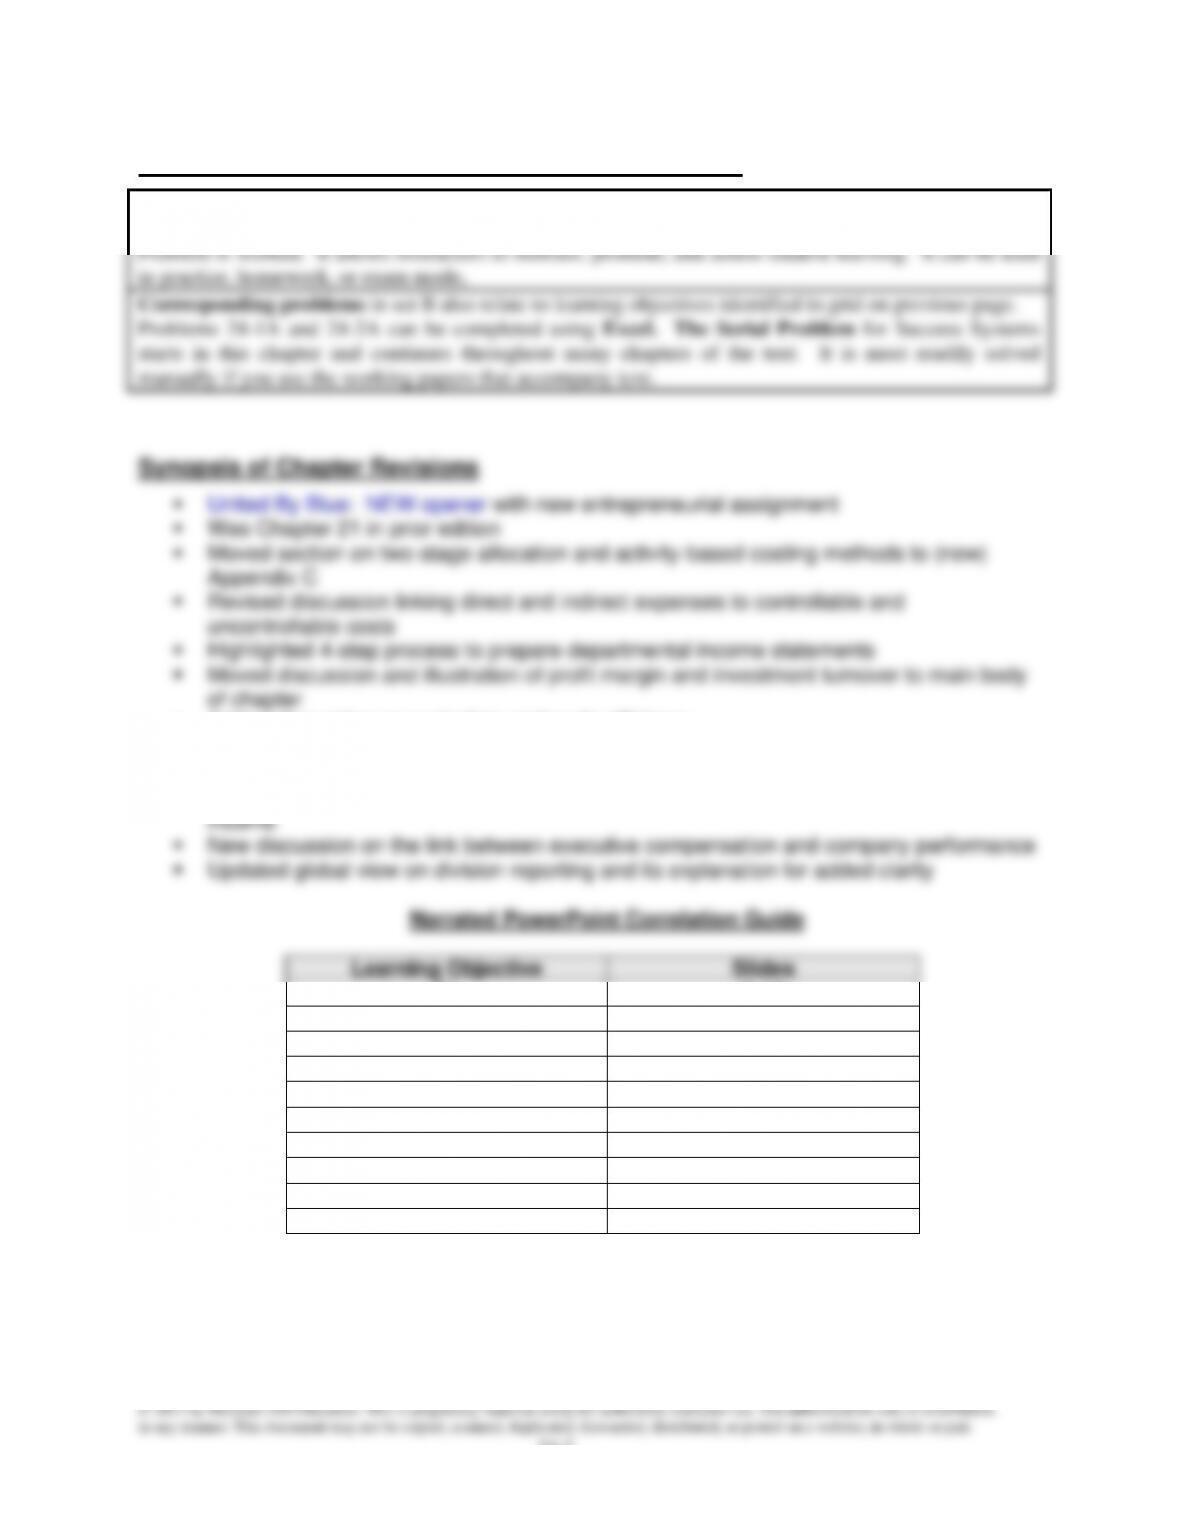
Synopsis of Chapter Revisions
▪ United By Blue: NEW opener with new entrepreneurial assignment
▪ Was Chapter 21 in prior edition
▪ Moved section on two-stage allocation and activity-based costing methods to (new)
Appendix C
▪ Revised discussion linking direct and indirect expenses to controllable and
uncontrollable costs
▪ Highlighted 4-step process to prepare departmental income statements
▪ Moved discussion and illustration of profit margin and investment turnover to main body
of chapter
▪ Added discussion on cycle time and cycle efficiency
▪ New exhibit on how to prepare departmental performance reports
▪ Edited discussion of example on preparing departmental performance reports
▪ New discussion on issues in computing return on (assets) investment and residual
Chapter Outline
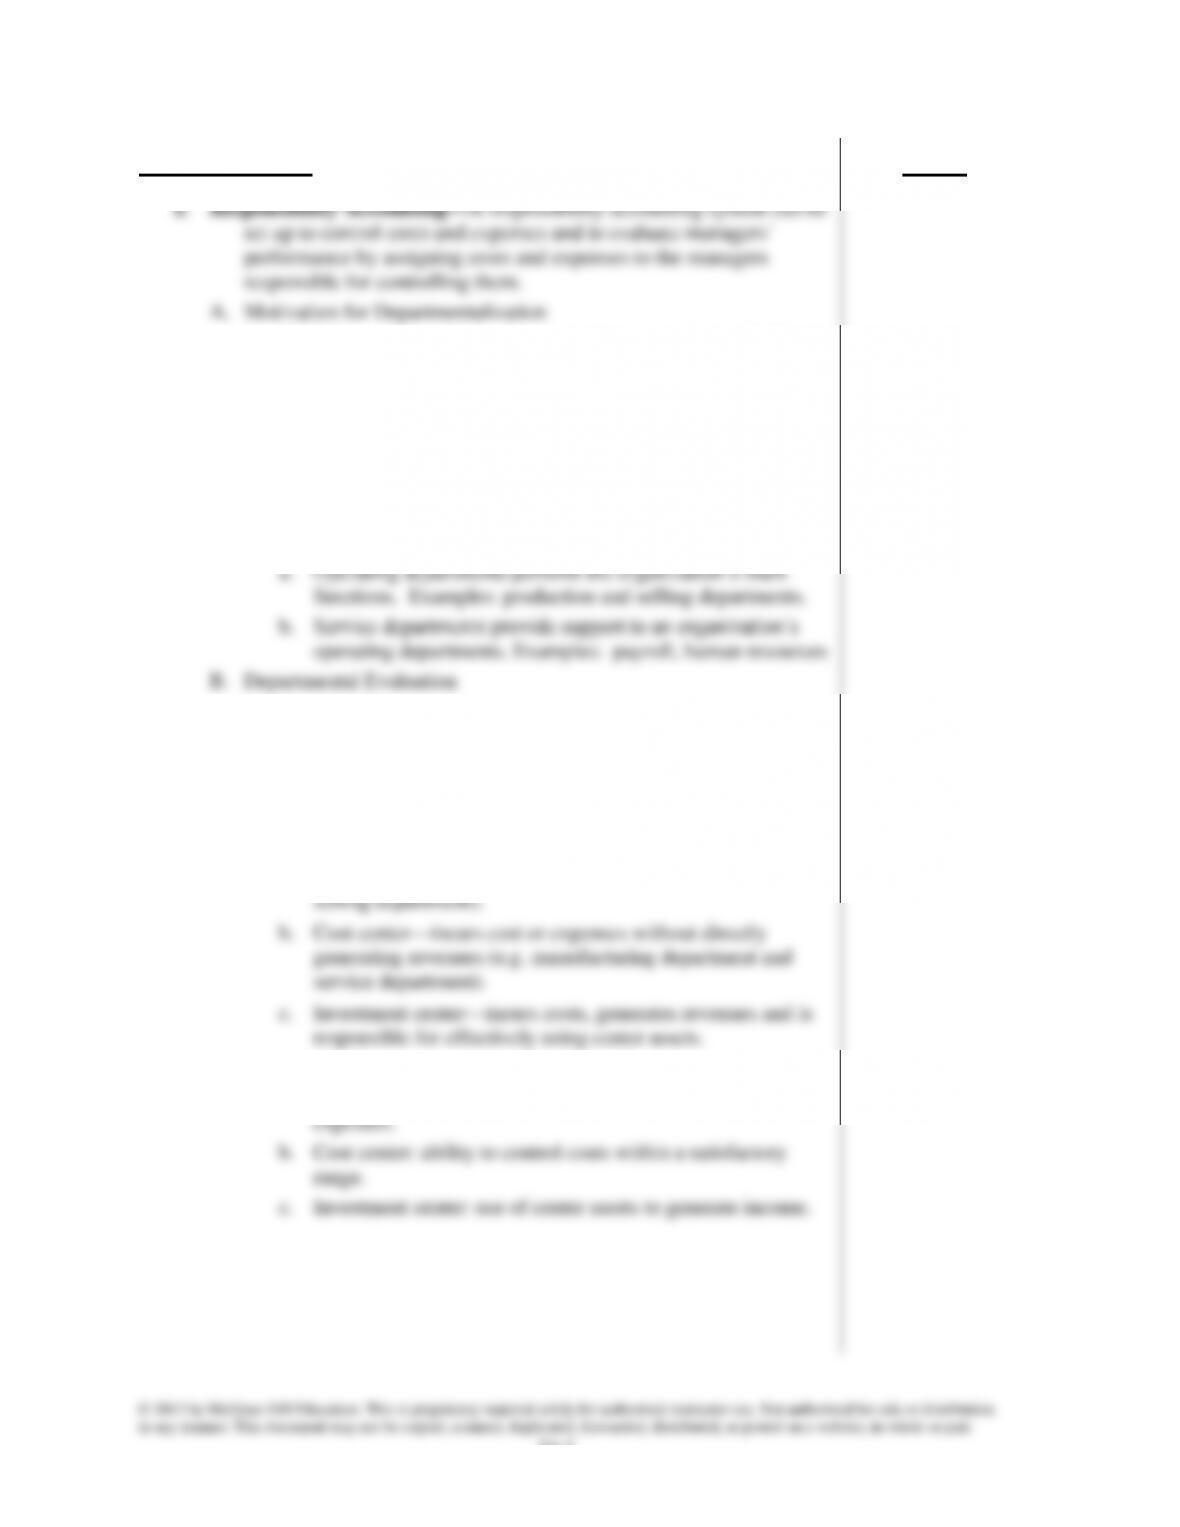
I. Responsibility Accounting⎯A responsibility accounting system can be
set up to control costs and expenses and to evaluate managers’
performance by assigning costs and expenses to the managers
responsible for controlling them.
A. Motivation for Departmentalization
1. divide large and complex companies into subunits (or divisions)
when too large.
2. Divisions are organized into separate departments.
3. Each department placed under direction of a manager.
departments.
a. Operating departments perform the organization’s main
functions. Examples: production and selling departments.
b. Service departments provide support to an organization’s
operating departments. Examples: payroll, human resources
B. Departmental Evaluation
1. Prepared for internal managers to help control operations,
appraise performance, allocate resources, and plan strategy.
2. More companies are emphasizing customer satisfaction as main
responsibility of each operating department.
b. Cost center⎯incurs cost or expenses without directly
generating revenues (e.g. manufacturing department and
service department).
c. Investment center⎯incurs costs, generates revenues and is
responsible for effectively using center assets.
4. Basis for evaluating performance:
a. Profit center: ability to generate more revenue than
Notes
24-4
Chapter Outline
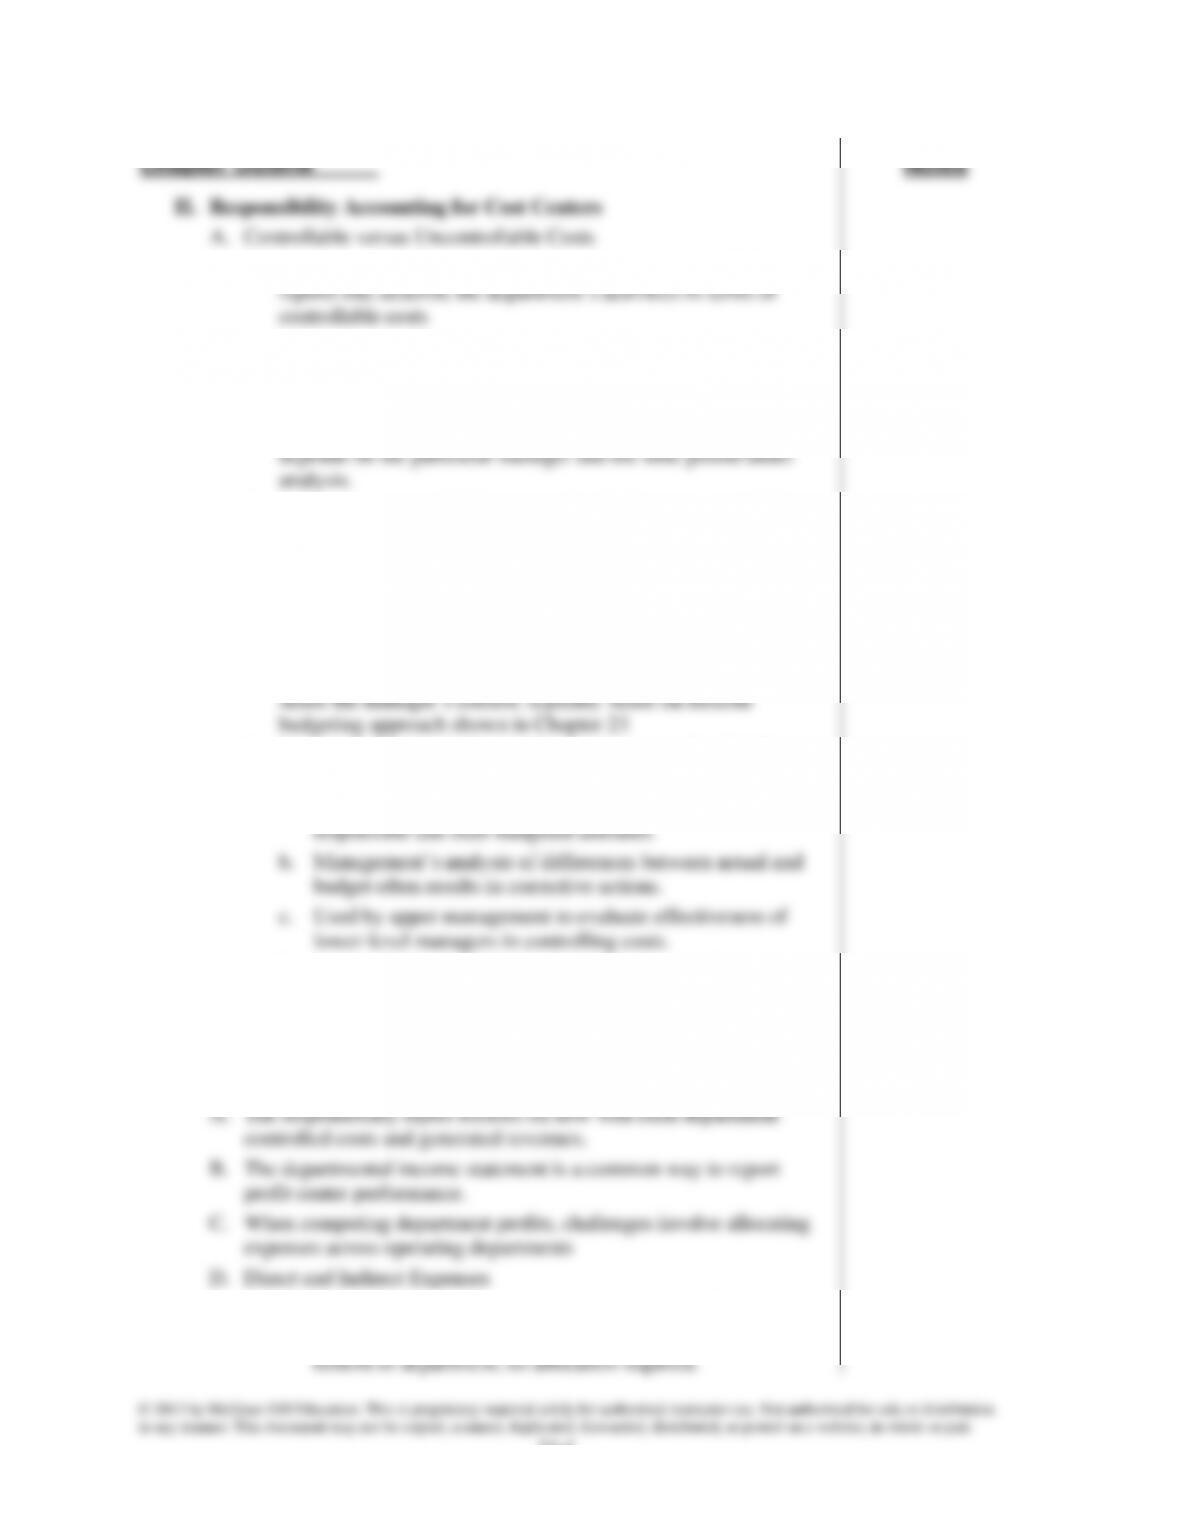
II. Responsibility Accounting for Cost Centers
A. Controllable versus Uncontrollable Costs
1. A manager’s performance is evaluated using responsibility
reports that describe the department’s activities in terms of
3. A cost is uncontrollable if it is not within the manager’s control
4. Distinguishing between controllable and uncontrollable costs
analysis.
5. All costs are controllable at some level of management if the
time period is sufficiently long;
6. Good judgment is required when identifying controllable costs.
B. Responsibility Accounting System
responsibility for costs and expenses under their control.
2. Responsibility accounting budgets identify costs and expenses
under the manager’s control; typically based on flexible
budgeting approach shown in Chapter 23
3. Responsibility accounting performance reports (See Exhibit
24.2):
a. Accumulate and report costs for which a manager is
responsible and their budgeted amounts.
budget often results in corrective actions.
c. Used by upper management to evaluate effectiveness of
lower-level managers in controlling costs.
4. Recognizes that control over costs and expenses belongs to
A. The responsibility report focuses on how well each department
controlled costs and generated revenues.
B. The departmental income statement is a common way to report
profit center performance.
C. When computing department profits, challenges involve allocating
expenses across operating departments
Notes
2. Indirect Expenses are typically considered uncontrollable costs:
a. Incurred for joint benefit of more than one department; can’t
be readily traced to just one department.
b. Allocated across departments benefiting from them.
c. Ideally allocated using a cause-effect relation or, if cause-
effect relation cannot be identified, allocated on a basis
approximating the benefit received by each department.
E. Allocation of Indirect Expenses⎯no standard rule identifies the best
basis; judgment required.
1. Wages and salaries:
a. Direct expense of the department if time spent entirely in
one department; otherwise indirect.
b. Basis for allocating when indirect:
3. Advertising⎯Departmental portion of total sales, or by
newspaper space or TV/radio time devoted to products of each
department.
5. Utilities⎯portion of floor space occupied by departments (if
used uniformly); otherwise more complicated.
F. Departmental Income Statements
1. Departmental income statements are prepared after all expenses
have been assigned to the departments.
allocated to the operating departments.
24-6
Chapter Outline
2. Four Steps for allocating costs and preparing departmental
income statements.
a. Step one – accumulate revenues and direct expenses for
each service and selling department.
i. Cost centers do not generate revenues
ii. Direct expenses include wages, salaries, and other
expenses that a department incurs but does not share
with any other department.
b. Step two – allocate indirect expenses across all service and
operating departments
i. Can include items such as depreciation, rent, advertising
and other expenses than can’ not be assigned to a
department.
ii. The indirect expenses are recorded in company accounts
and an allocation based is identified to allocate the costs
to the departments on a departmental expense allocation
spreadsheet
expenses are a large portion of total expenses.
2. Evaluate using departmental contributions to overhead⎯a report
of the amount of sales less direct expenses (indirect expenses are
Notes
24-7
Chapter Outline
IV. Evaluating Investment Center Performance
A. Financial Performance Evaluation Measures
1. Assesses how well center manager has utilized center’s
productive assets to generate income.
computed as:
Investment center net income
Investment center average invested assets
4. Investment center residual income is computed as:
*target net income : Hurdle rate x average invested assets
hurdle rate: typically the cost to obtain financing
5. Using residual income encourages managers to accept all
1. Evaluating performance solely on financial measures has
limitations.
centers of different size.
c. Return on investment and residual income can encourage
managers to focus too heavily on short-term financial goals.
b. Internal process: which of our operations are critical?
c. Innovation and learning: how can we improve?
d. Financial: what do our owners think of us?
e. Exhibit 24.21 lists common performance measures.
Notes
V. Appendix 24A – Transfer Pricing
A. The price used to record transfers between divisions in the same
company is called a transfer price.
1. If there is no excess capacity, the internal supplier will not
accept a transfer price less than the market price. This is called
market based transfer pricing.
2. If there is excess capacity, the internal supplier should accept a
price between the cost to manufacturer the part and the market
price. This is called cost based transfer pricing
3. Other issues to consider in determining transfer prices include:
a. Market price may not exist
b. Cost controls
c. Division managers’ negotiation
d. Nonfinancial factors to consider include: quality control,
reduced lead times and impact on employee morale.
products at the same time; similar to indirect expense in that it’s
shared across more than one cost object.
2. Allocated to different products produced from it when total cost
of each product must be estimated (e.g., preparation of GAAP
financial statements).
3. Allocation bases
Notes

24-9
Alternate Demo Problem Chapter Twenty-Four
Jack and Susan Roberts own a farm that produces potatoes. Based on a
review of the income statement shown below, Jack remarked that they
should have fed the No. 3 potatoes to the pigs; then they would have
avoided the loss from the sale of the those potatoes.
JACK AND SUSAN ROBERTS
Income from the Production and Sale of Potatoes
For Year Ended December 31, 20xx
Results by Grade
No. 1
No. 2
No. 3
Combined
Sales by grades:
No. 1, 300,000 lbs. $0.045 per lb.
$13,500
No. 2, 500,000 lbs. $0.04 per lb.
$20,000
No. 3, 200,000 lbs. $0.03 per lb.
$6,000
Combined
$39,500
Costs:
Land preparation, seed,
planting,
cultivating @ $0.01422 per lb.
4,266
7,110
2,844
14,220
Harvesting, sorting, grading
@ $0.01185 per lb.
3,555
5,925
2,370
11,850
Marketing @ $0.00415 per lb.
1,245
2,075
830
4,150
Total costs
9,066
15,110
6,044
30,220
Net income (or loss)
$4,434
$4,890
($44)
$9,280
Jack and Susan divided their costs among the grades on a per pound
basis, because their records do not show cost per grade. However, their
records did show that $4,020 of the $4,150 of marketing costs represented
the cost of placing the No. 1 and No. 2 potatoes in bags and hauling them
to the warehouse of the produce buyer. Bagging and hauling costs were
the same for both grades. The remaining $130 represented the cost of
loading the No. 3 potatoes into the trucks of the potato starch factory that
bought these potatoes in bulk and picked them up at the farm.
Required:
Prepare an income statement that will better show the results of producing
and marketing the each of the grades of potatoes.
24–10
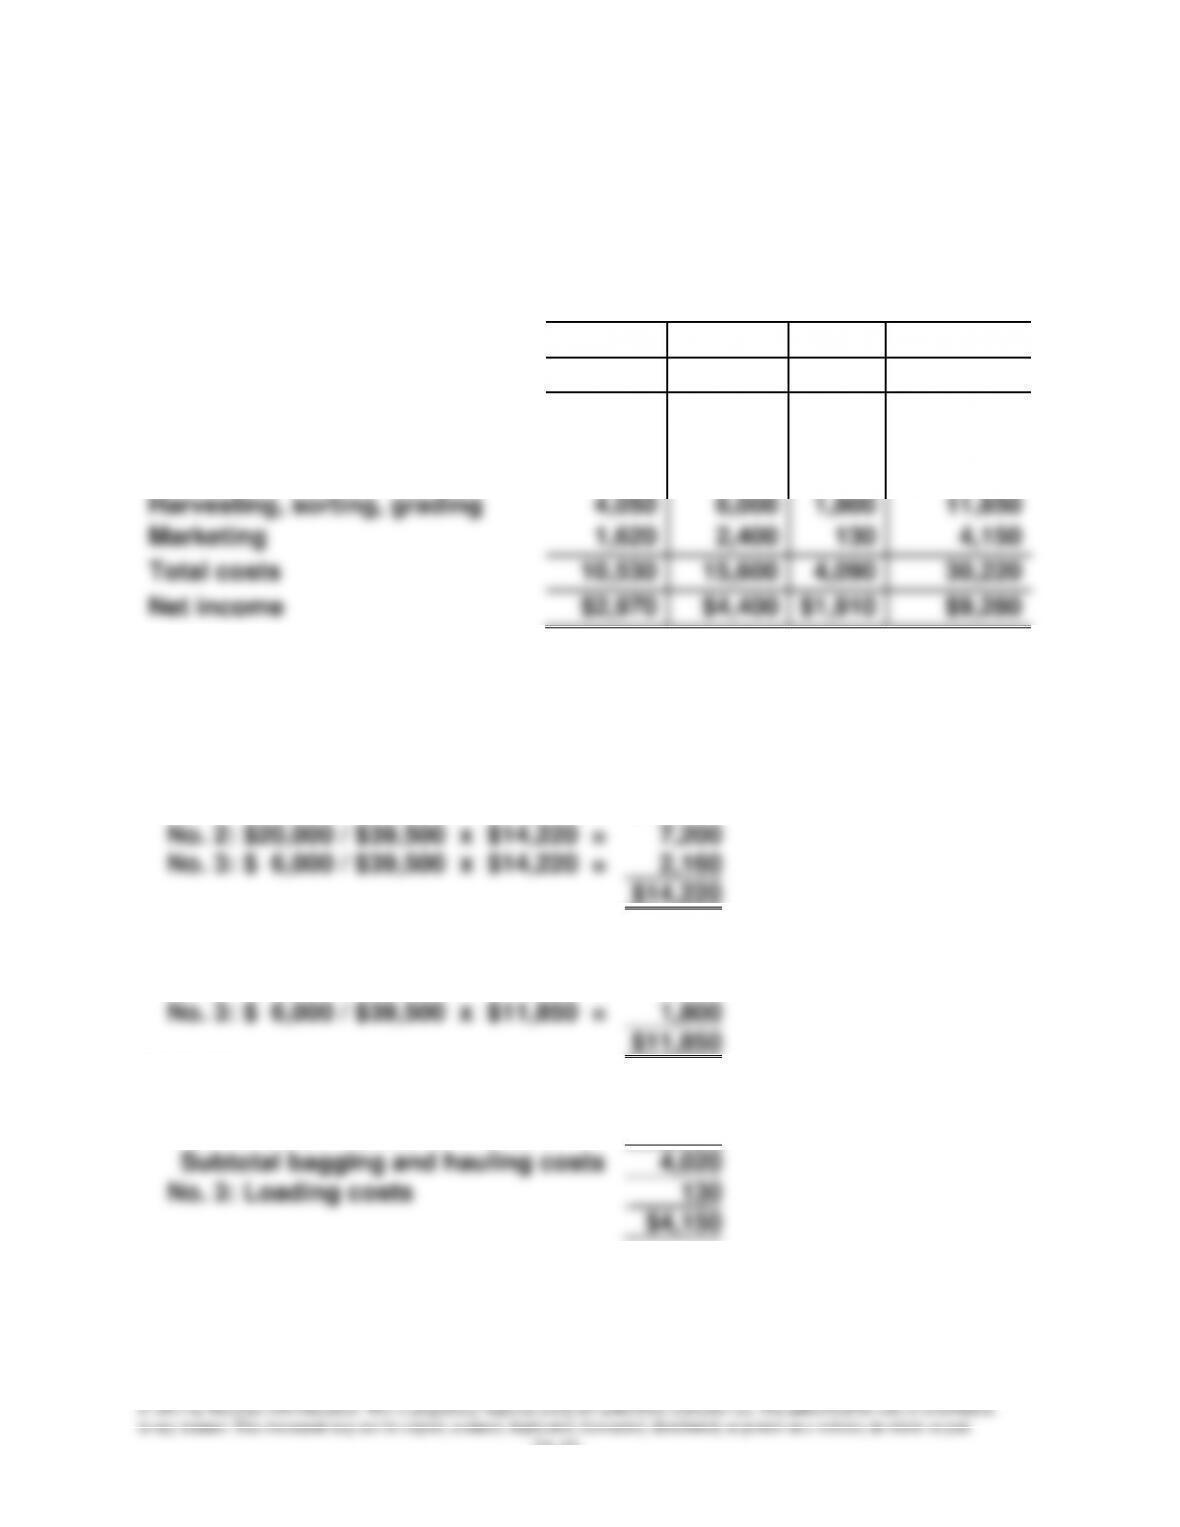
Solution: Alternate Demo Problem Chapter Twenty-Four
JACK AND SUSAN ROBERTS
Income from the Production and Sale of Potatoes
For Year Ended December 31, 20xx
Results by Grade
No. 1
No. 2
No. 3
Combined
Revenue from sales:
$13,500
$20,000
$6,000
$39,500
Costs:
Land preparation, seed,
planting, cultivating
4,860
7,200
2,160
14,220
Harvesting, sorting, grading
4,050
6,000
1,800
11,850
Marketing
1,620
2,400
130
4,150
Total costs
10,530
15,600
4,090
30,220
Net income
$2,970
$4,400
$1,910
$9,280
COST ALLOCATIONS
Land preparation, seed, planting, and
cultivating:
No. 1: $13,500 / $39,500 x $14,220 =
No. 2: $20,000 / $39,500 x $14,220 =
No. 3: $ 6,000 / $39,500 x $14,220 =
$ 4,860
7,200
2,160
$14,220
Harvesting, sorting, and grading:
No. 1: $13,500 / $39,500 x $11,850 =
No. 2: $20,000 / $39,500 x $11,850 =
No. 3: $ 6,000 / $39,500 x $11,850 =
$ 4,050
6,000
1,800
$11,850
Marketing:
No. 1: $13,500 / $33,500 x $4,020 =
No. 2: $20,000 / $33,500 x $4,020 =
$1,620
2,400
Subtotal bagging and hauling costs
4,020
No. 3: Loading costs
130
$4,150