Title: Problem 21-3A
QA_Ori:
Parts 1 and 2
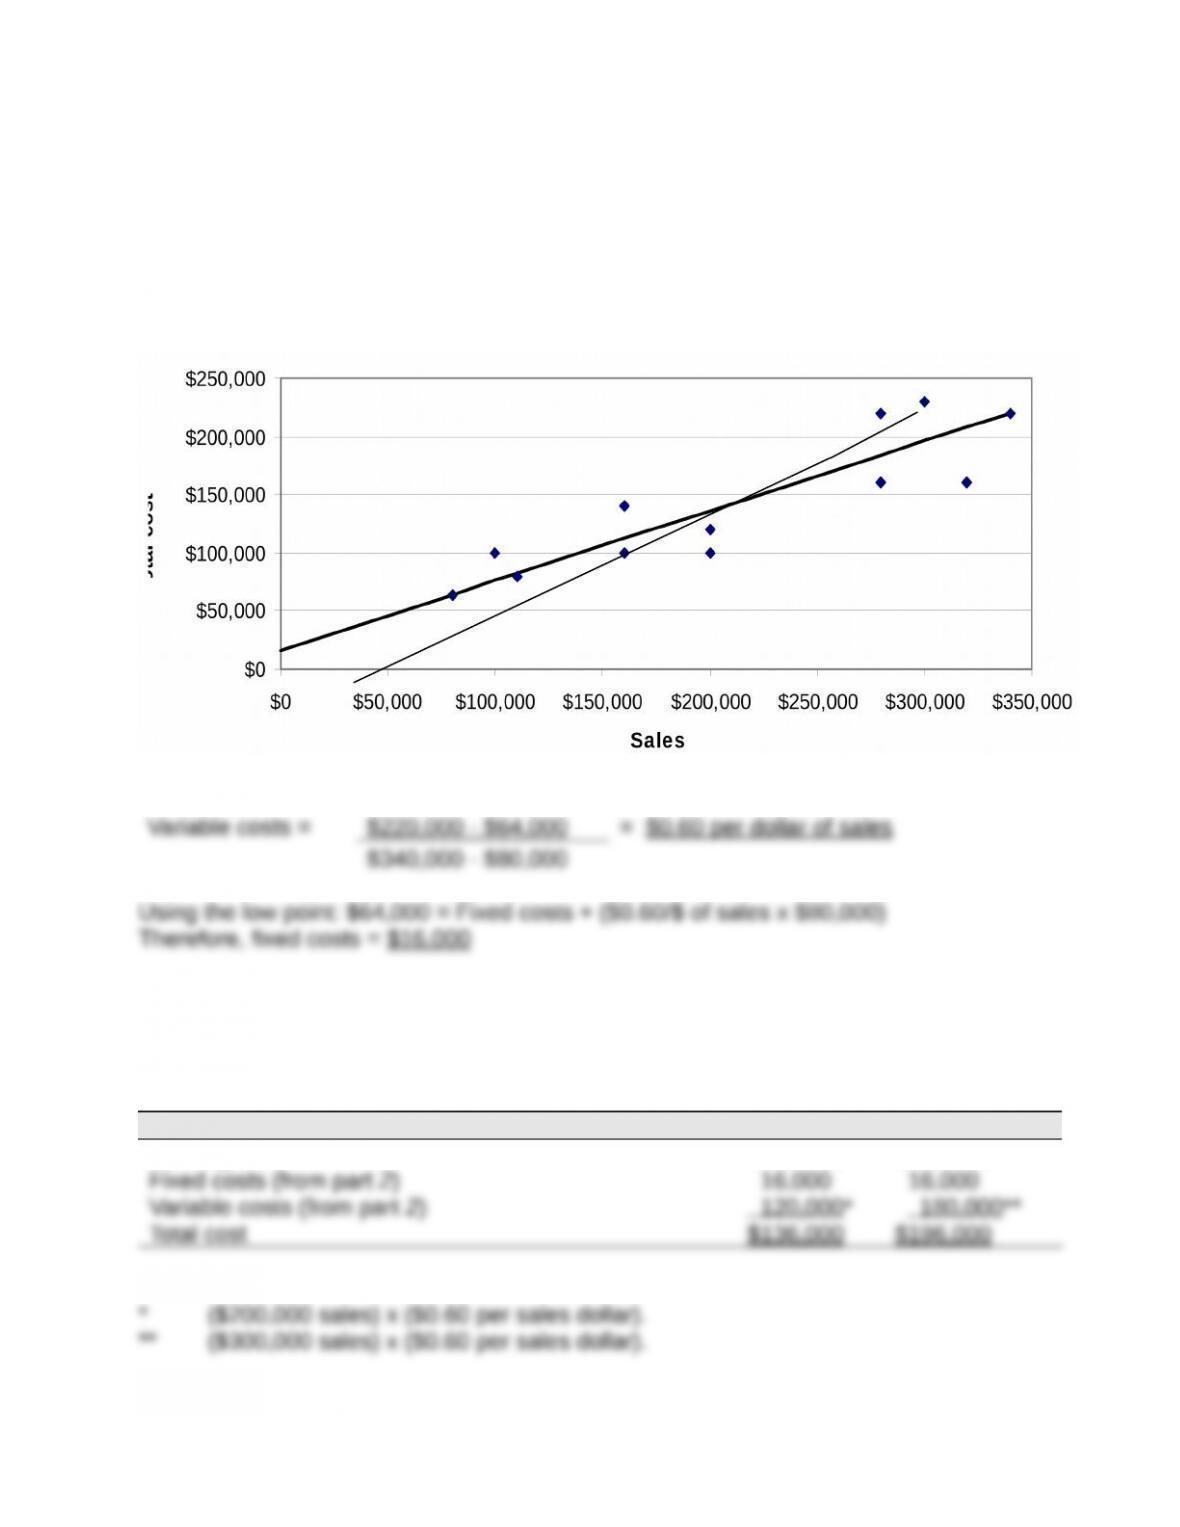
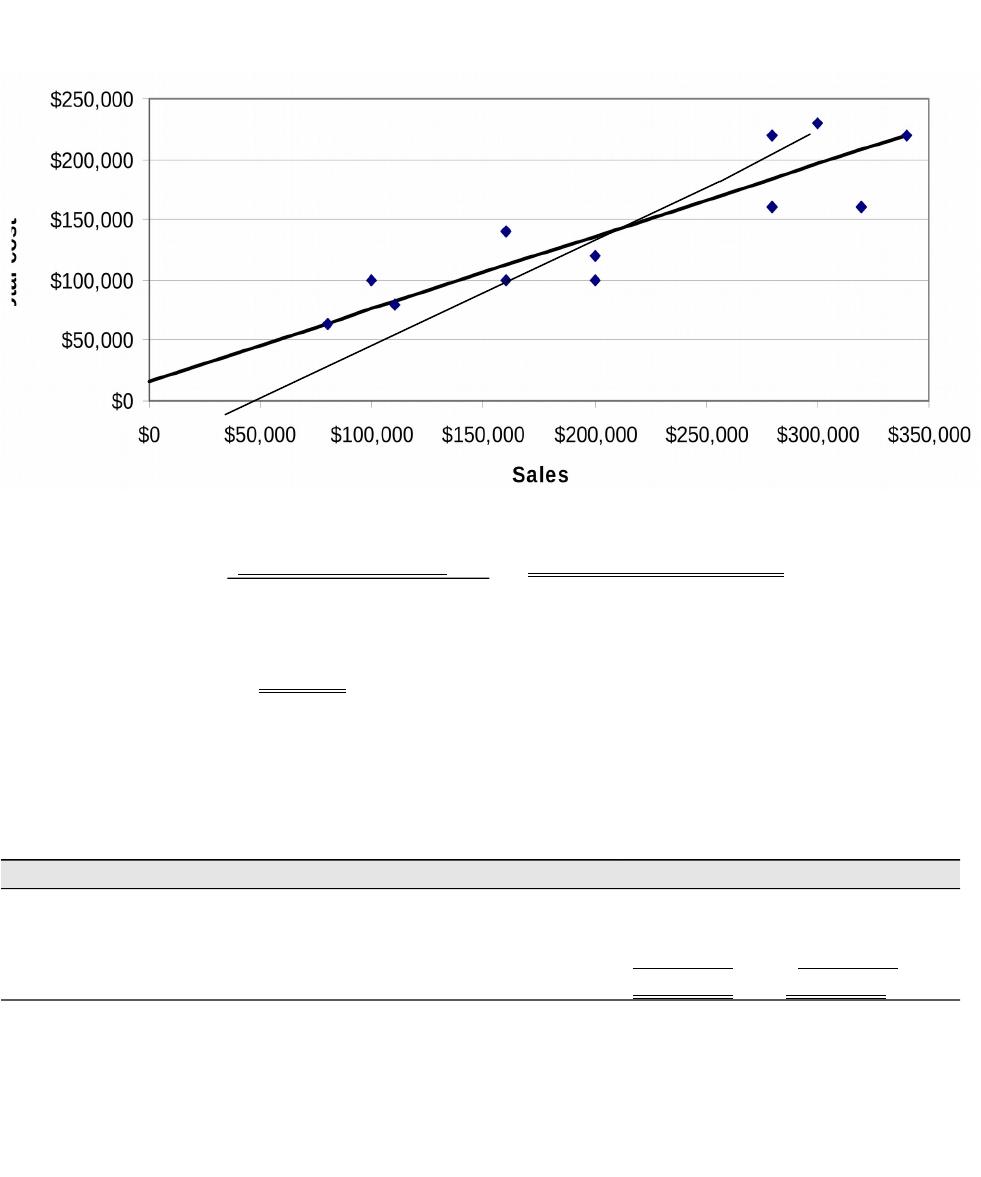
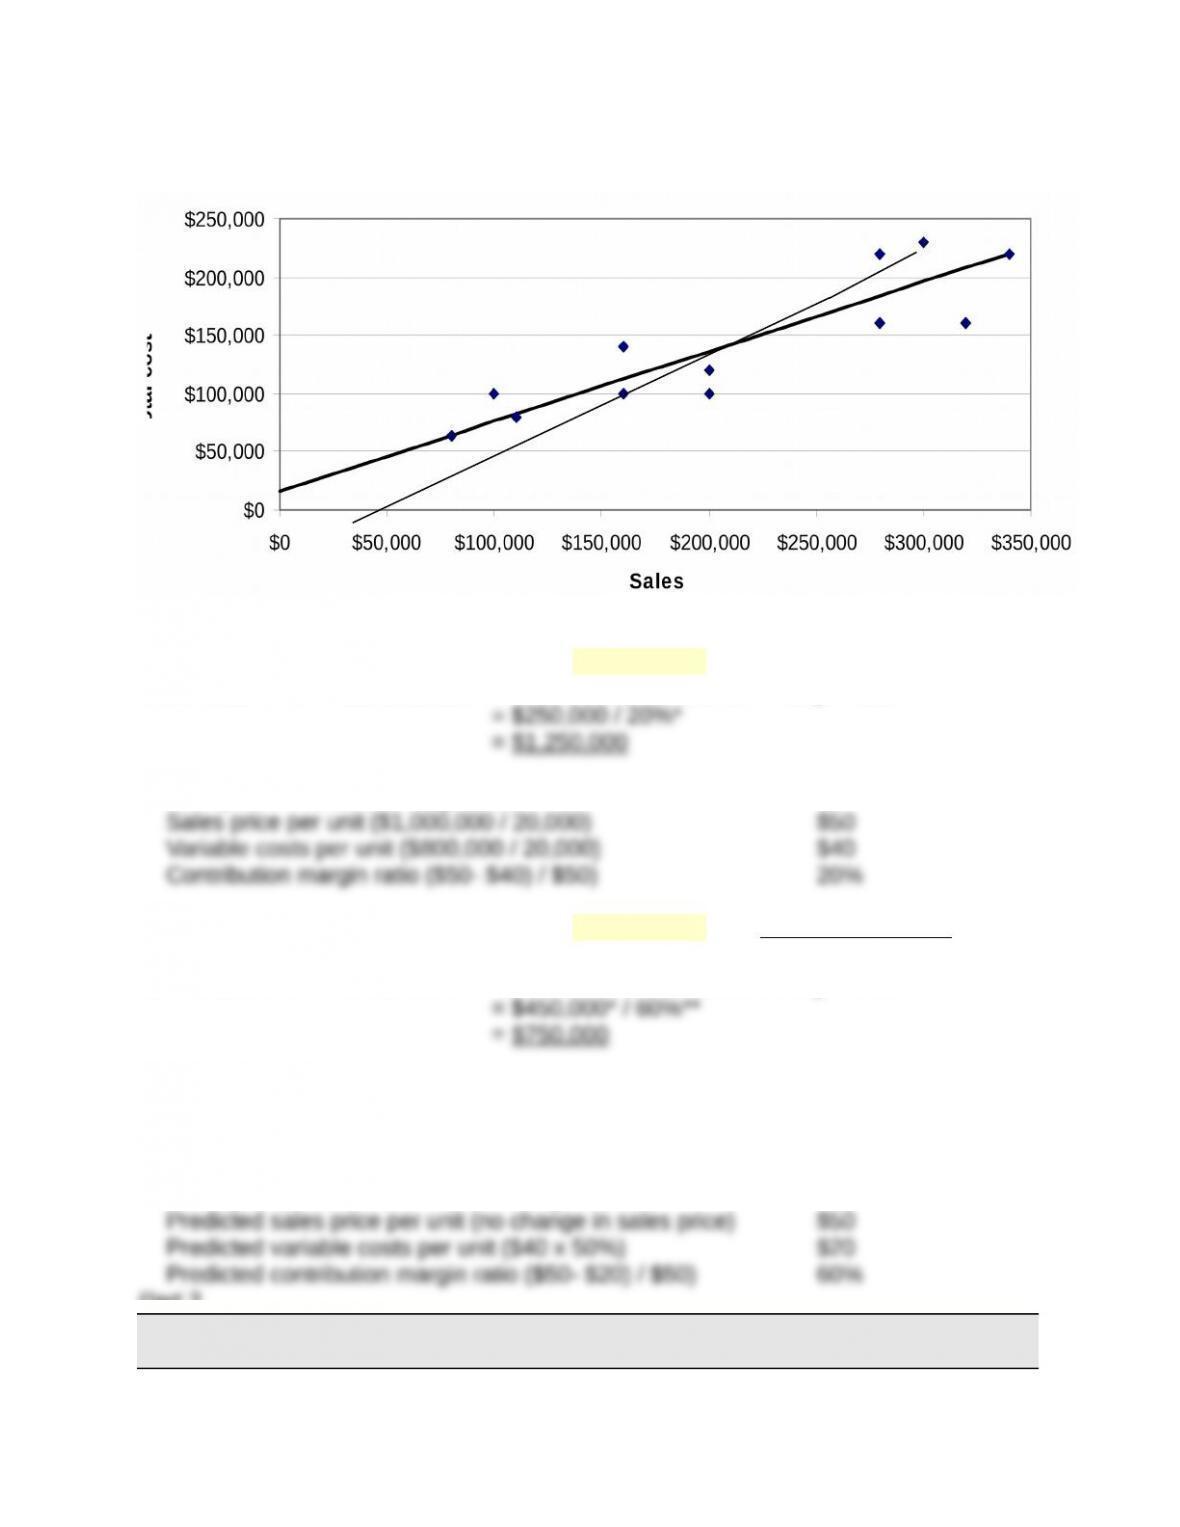
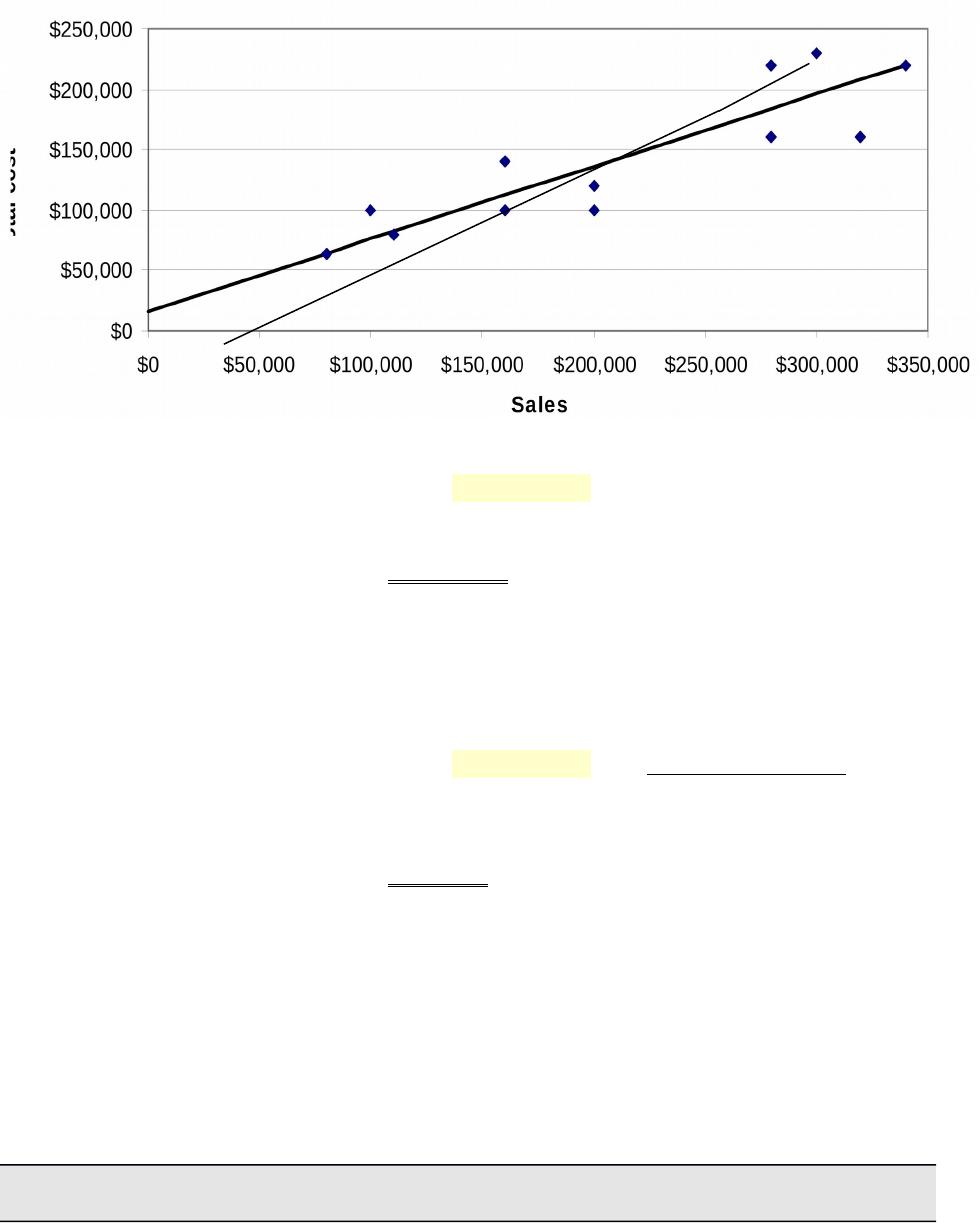
The scatter diagram and its estimated line of cost behavior appear below.
Part 2 – Calculation of variable and fixed costs
Part 3
The estimates in Part 2 can be used to predict the total costs that will be incurred at
sales levels of $200,000 and $300,000.
Predictions
Sales (given) $200,000 $300,000
Alden Co.
Alden Co.
Title: Problem 21-4A
QA_Ori:
Part 1 Instructor note: Use the equation in Exhibit 21.12
2013 break-even in sales dollars = Fixed costs / Contribution margin ratio
*To compute contribution margin ratio
Part 2 Instructor note: Use the equation in Exhibit 21.12 with predicted numbers
2014 break-even in sales dollars = Fixed costs / Contribution margin ratio
*To compute predicted fixed costs
2013 fixed costs plus 2014 increase ($250,000 + $200,000) $450,00
0
**To compute predicted contribution margin ratio
Part 3
ASTRO COMPANY
Forecasted Contribution Margin Income Statement

For Year Ended December 31, 2014
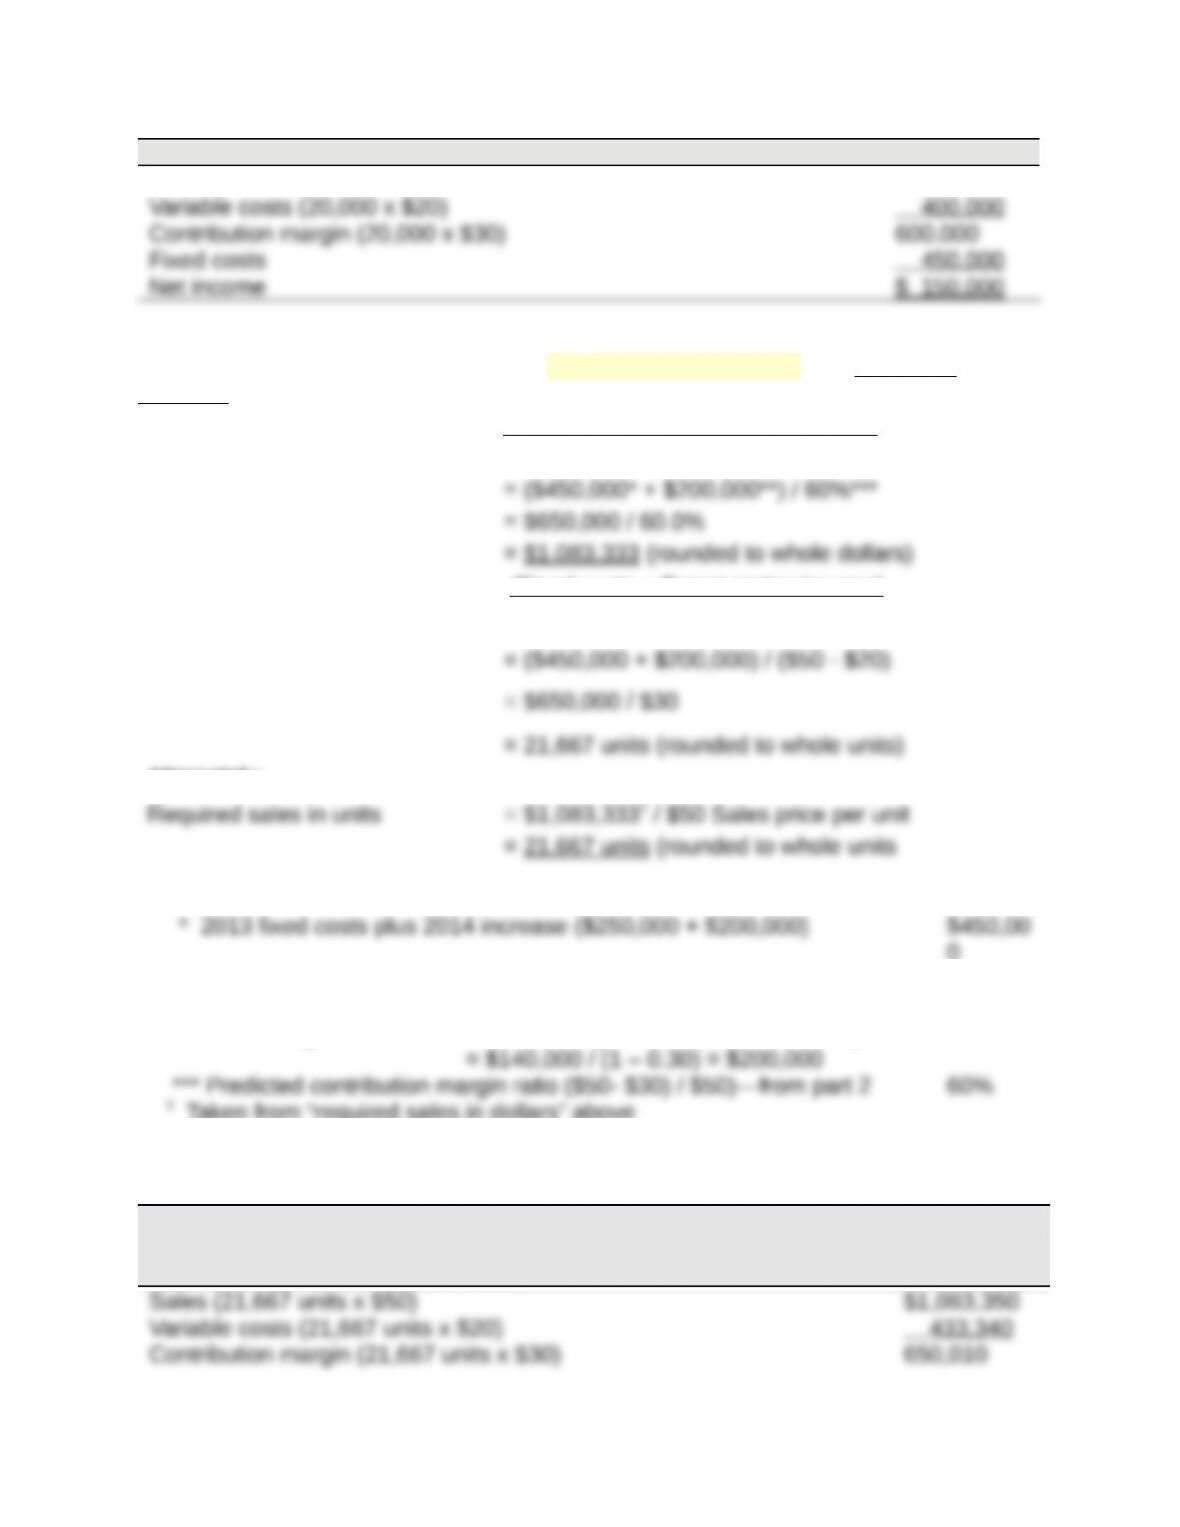
Sales (20,000 x $50) $1,000,000
Part 4 Instructor note: Use equations in Exhibits 21.22 and 21.23 with predicted
numbers
Required sales in dollars = (Fixed costs + Target pretax income)
Contribution margin ratio
(Fixed costs + Target pretax income)
Required sales in units = Contribution margin per unit
Alternately:
0
** Target after-tax income (given) $140,00
0
Pretax target income = After-tax target income / (1 – Tax rate)
† Taken from “required sales in dollars” above
Part 5
ASTRO COMPANY
Forecasted Contribution Margin Income Statement
For Year Ended December 31, 2014
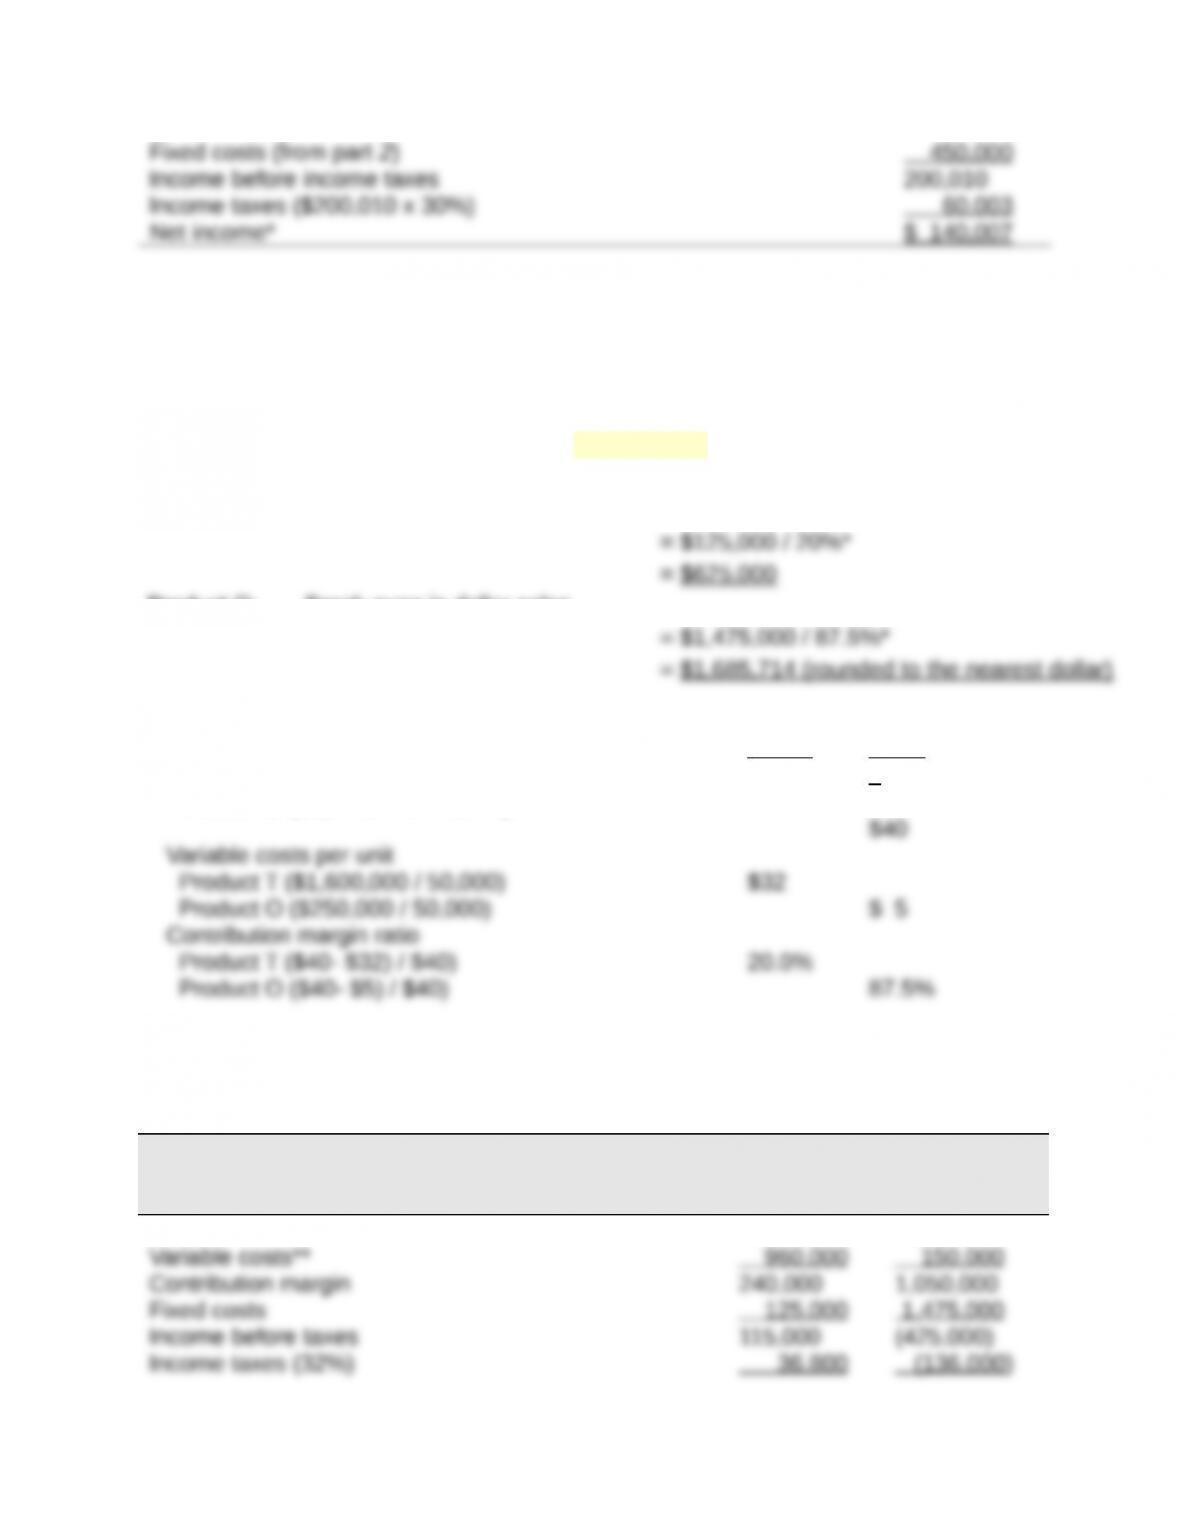

*Slightly greater than the targeted $140,000 income due to rounding of units.
Title: Problem 21-5A
QA_Ori:
Part 1 Instructor note: Use the equation in Exhibit 21.12
Break-even in dollar sales = Fixed costs / Contribution margin ratio
Product T: Break-even in dollar sales
Product O: Break-even in dollar sales
*To compute contribution margin ratio
Sales price per unit
Product T ($2,000,000 / 50,000)
Product O ($2,000,000 / 50,000)
__T__
$40
__O_
_
Part 2
Forecasted contribution margin income statements for each product assuming sales
declines to 30,000 units with no change in unit sales price
VANNA CO.
Forecasted Contribution Margin Income Statement
Product T Product O
Sales* $1,200,000 $1,200,000

Unit sales price and variable costs are computed in Part 1 and used in these
computations:
units x $5.
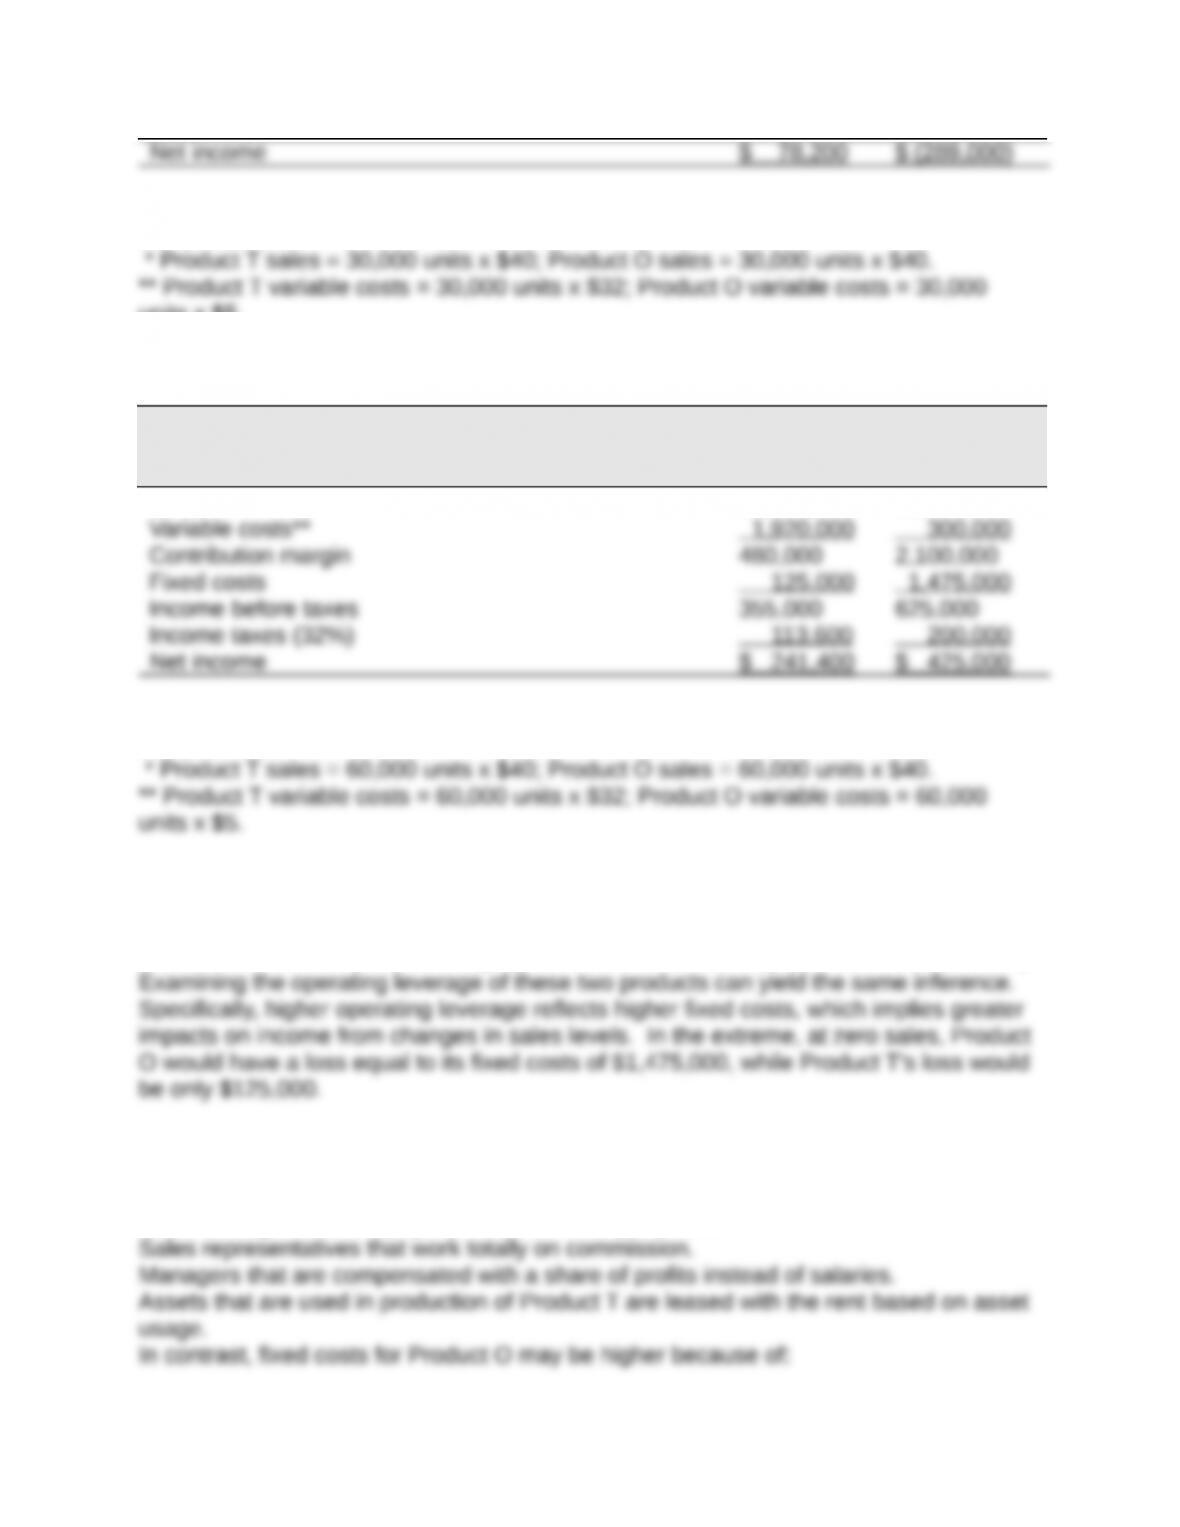
Part 3 Forecasted contribution margin income statements for each product assuming
sales increase to 60,000 units with no change in unit sales price
VANNA CO.
Forecasted Contribution Margin Income Statement
Product T Product O
Sales* $2,400,000 $2,400,000
Unit sales price and variable costs are computed in Part 1 and used in these
computations:
Part 4
If sales were to greatly decrease, Product O would suffer the greater loss because it
would lose more contribution margin per unit than Product T ($35 for O versus $8 for T).
Part 5
Factors that could cause Product T to have lower fixed costs might include:
Labor arrangement that pays workers for units produced.

A salary structure that is not based on production or sales.
Product O’s assets that are owned or obtained under a lease agreement based on time,
and not on asset usage.
Title: Problem 21-6A
QA_Ori:
Part 1 Instructor note: Use the equation in Exhibit 21.12
Break-even in dollar sales = Fixed costs / Contribution margin ratio
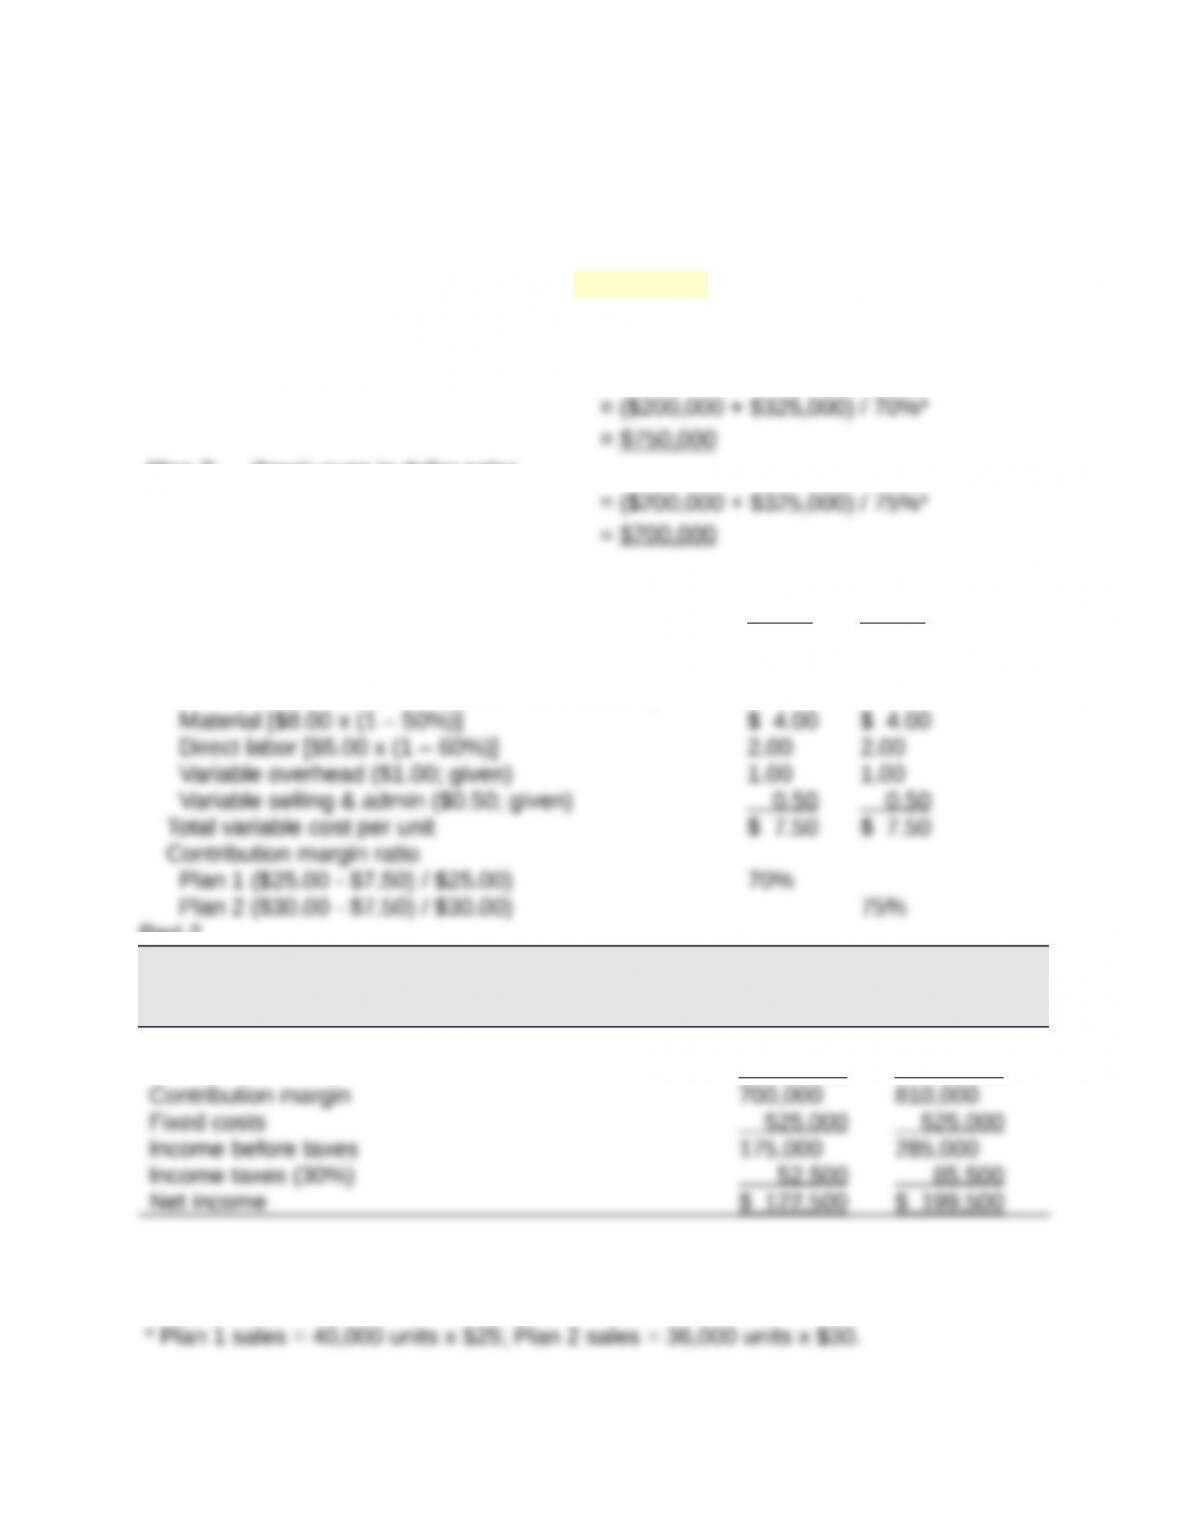
Plan 1: Break-even in dollar sales
Plan 2: Break-even in dollar sales
*To compute contribution margin ratio
Sales price per unit
Plan 1 (no change)
Plan 2 [$25.00 x (1 + 20%)]
Plan 1
$25.00
Plan 2
$30.00
Total variable costs per unit (both Plans 1 and 2)
Part 2
BERTRAND CO.
Forecasted Contribution Margin Income Statement
Plan 1 Plan 2
Sales* $1,000,000 $1,080,000
Variable costs** 300,000 270,000
Unit sales price and variable costs are computed in Part 1 and used in these
computations:

** Plan 1 variable costs = 40,000 units x $7.50; Plan 2 variable costs = 36,000 units x
$7.50.
Title: Problem 21-7A
QA_Ori:
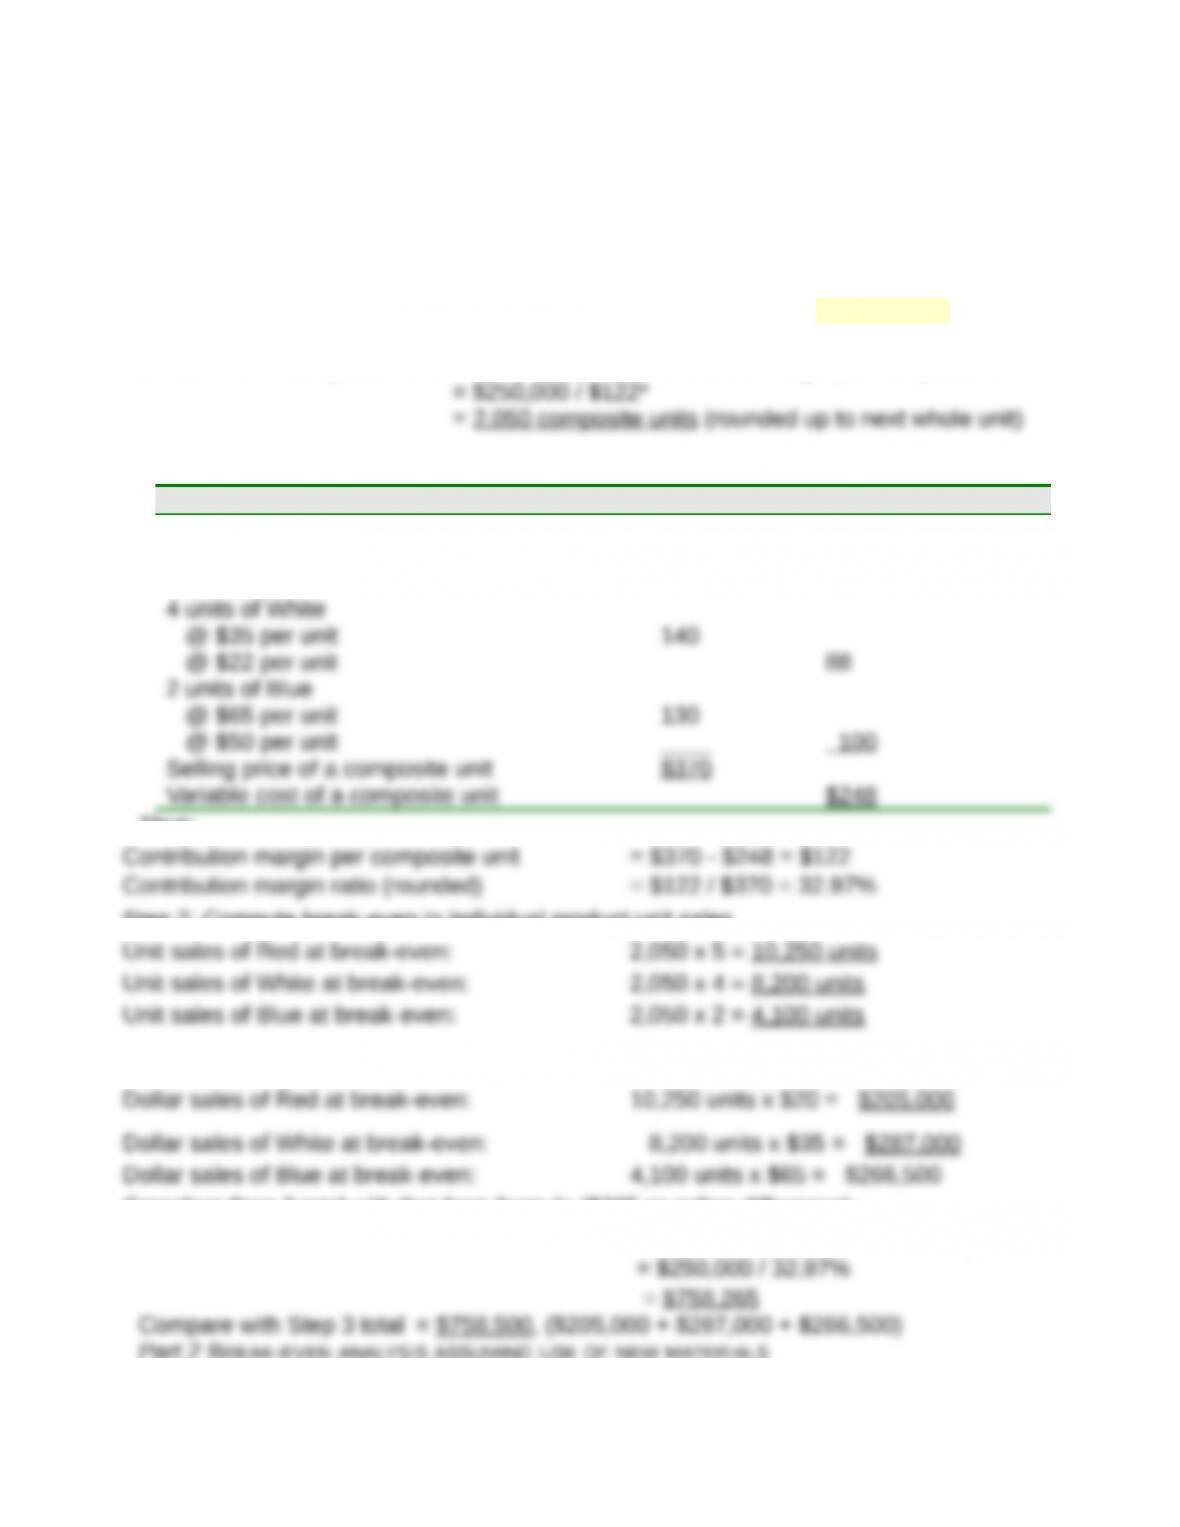
Part 1 BREAK–EVEN ANALYSIS ASSUMING USE OF SAME MATERIALS
Step 1: Compute break-even in composite units—Use equation in Exhibit 21.27
Break-even in composite units = Fixed costs/Contribution margin per composite unit
*To compute the contribution margin per composite unit
Unit Sales Price Unit Variable Costs
5 units of Red
@ $20 per unit
@ $12 per unit
$100
$ 60
Thus:
Step 2: Compute break-even in individual product unit sales
Step 3: Compute break-even in individual product dollar sales
Crossfoot Step 3 total with that from formula ($235 rounding difference):
Break-even in dollar sales = Fixed costs / Contribution margin ratio
Part 2 BREAK–EVEN ANALYSIS ASSUMING USE OF NEW MATERIALS
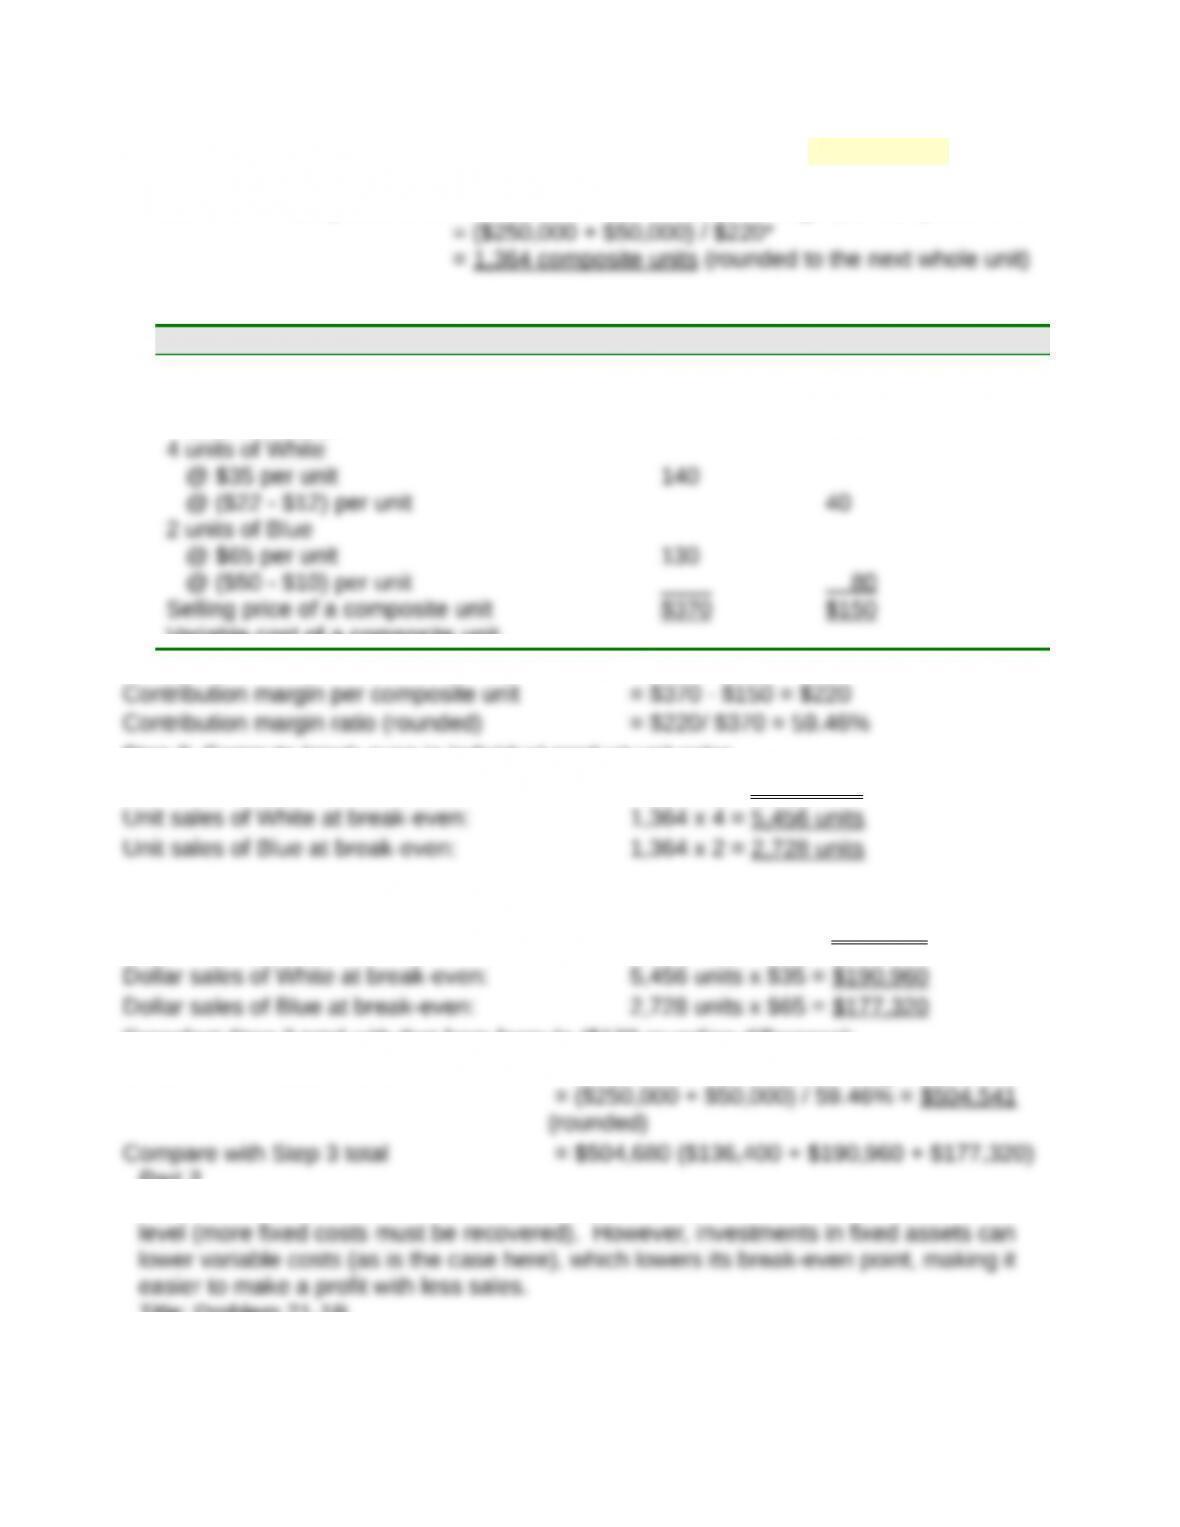

Step 1: Compute break-even in composite units—Use equation in Exhibit 21.27
Break-even in composite units = Fixed costs/Contribution margin per composite unit
*To compute the contribution margin per composite unit
Unit Sales Price Unit Variable Costs
5 units of Red
@ $20 per unit
@ ($12 – $6) per unit
$100
$ 30
Thus:
Step 2: Compute break-even in individual product unit sales
Unit sales of Red at break-even: 1,364 x 5 = 6,820 units
Step 3: Compute break-even in individual product dollar sales
Dollar sales of Red at break-even: 6,820 units x $20 = $136,400
Crossfoot Step 3 total with that from formula ($139 rounding difference):
Break-even in dollar sales = Fixed costs / Contribution margin ratio
Part 3
When a business invests in fixed assets, as in this case, there is an increase in its risk
Title: Problem 21-1B
QA_Ori:
Parts 1 and 2


Gilmore Company
Contribution Margin Income Statement
For Year Ended December 31, 2013
(12,000 units) Per unit % of sales
Sales ($18 x 12,000) $216,000 $18.00
0
100.00
%
Variable costs
Plastic for CD sets $ 1,500 $0.12
5
The contribution margin per unit is $14.625, and the contribution margin ratio is 81.25%.
Part 3 Analysis Component
Contribution margin shows how much of total sales are available to cover fixed costs

Title: Problem 21-2B
QA_Ori:
Part 1
(a) Instructor note: Use the equation in
Exhibit 21.11
= Fixed costs / Contribution margin
per unit
(b) Instructor note: Use the equation in
Exhibit 21.12
= Fixed costs / Contribution margin
ratio
Break-even in dollar sales
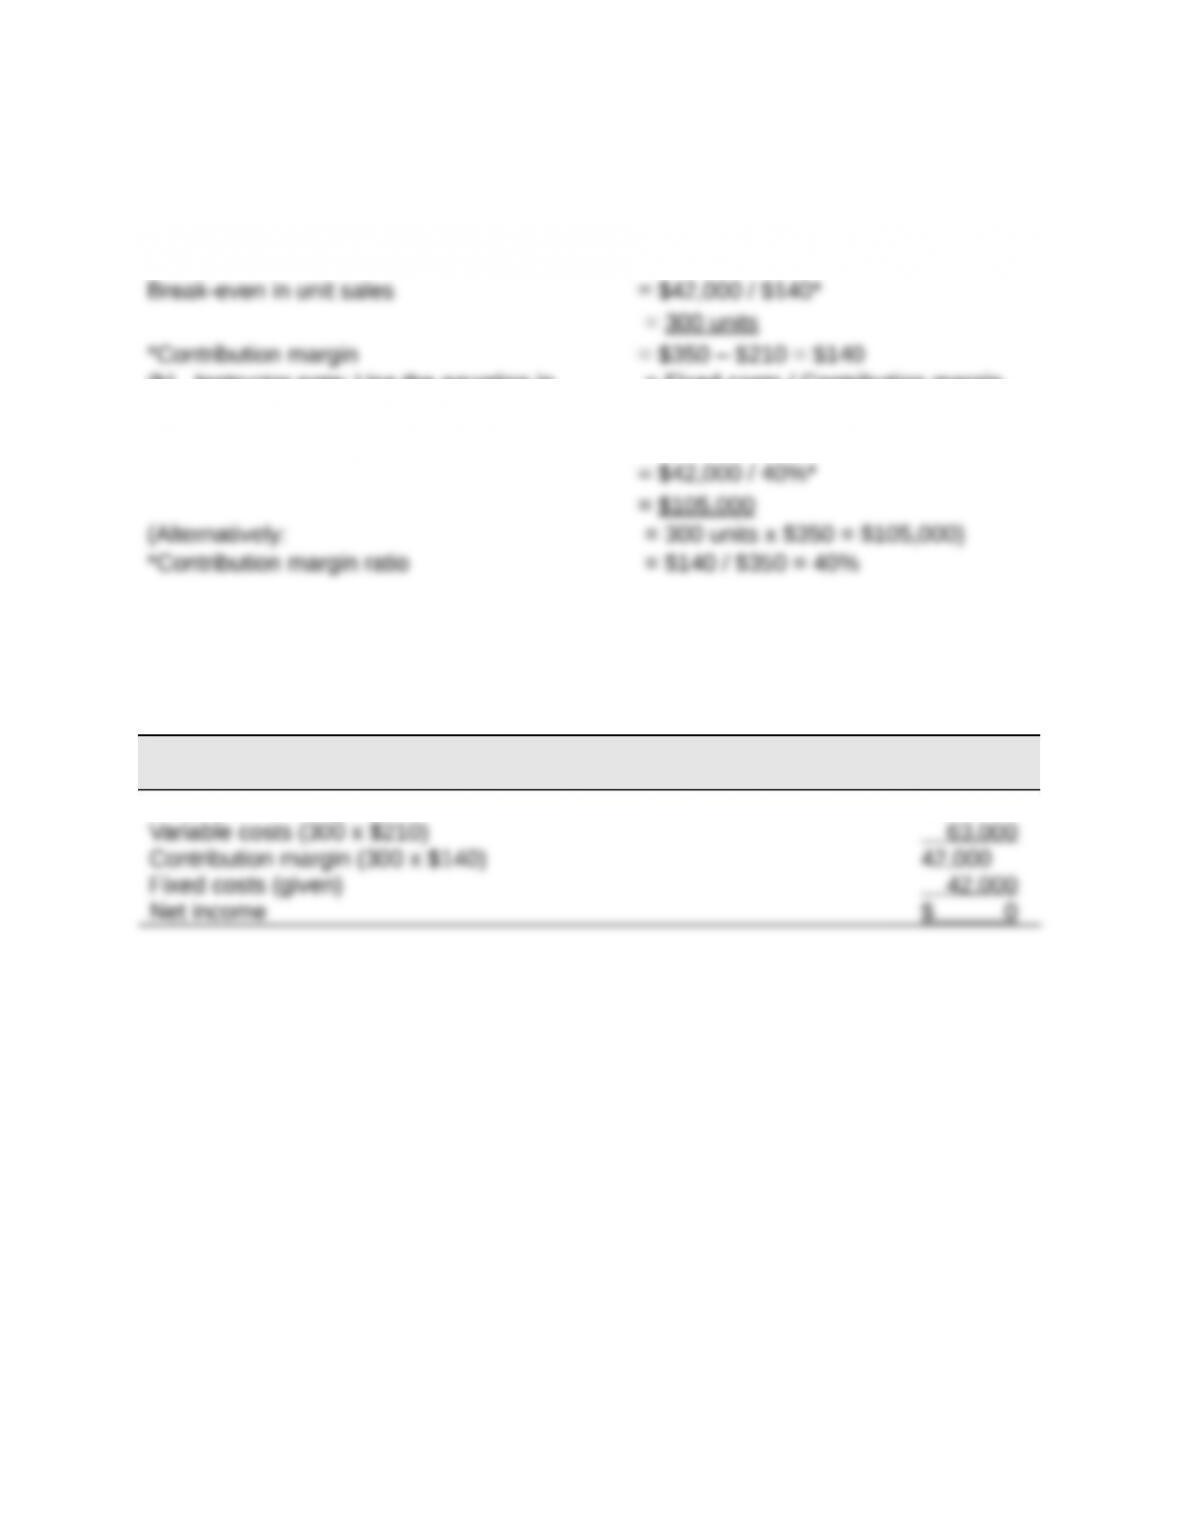
Part 2
Part 3
HIP-HOP CO.
Contribution Margin Income Statement (at Break-Even) — Keyboards
Sales (300 x $350) $105,000
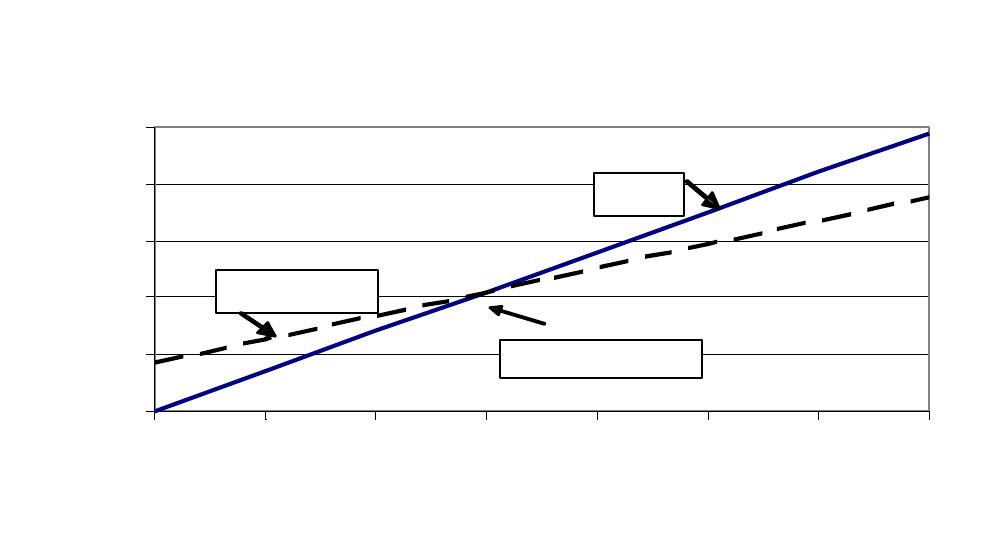
Hip-Hop Company CVP chart
$ 0
$50,000
$100,000
$150,000
$200,000
$250,000
0 100 200 300 400 500 600 700
Units
Sales
Total Costs
Breakeven point